I. INTRODUCTION
Among all greenhouse gases, carbon dioxide (CO2) is the highest contributor to global warming due to its huge emission into atmosphere mostly by the use of carbon-based fuels. Developing CO2 capture and storage technologies are well-accepted methods not only to reduce CO2 in atmosphere but also to store it until its further use in industry. Reference Rackley1,Reference Kaithwas, Prasad, Kulshreshtha and Verma2 Solid adsorbents with highly porous structures (i.e., activated carbons, zeolites, and alumina powders) are excellent candidates to implement this technology. Reference Figueroa, Fout, Plasynski, McIlvried and Srivastava3,Reference Tekin, Karalti and Karadas4 Zeolites are one of the most commonly used porous adsorbents; they capture CO2 through the electrostatic interactions between the gas molecules and alkali-metal cations in their structure. Reference Zhang, Singh and Webley5,Reference Schitco, Seifollahi Bazarjani, Riedel and Gurlo6 Up until now, various types of zeolites have been used in the adsorption of gases such as SO2, NO, and N2 besides CO2. Reference Deng, Yi, Tang, Liu and Zhou7–Reference Chiu, Hsi and Lin9
The use of metal oxides has also been reported to be a favorable alternative to the aforementioned solid adsorbents. This is mostly because of their advantage in providing selective adsorption of gas molecules with stronger chemical interactions relative to weaker physical ones. The presence of metal oxides as basic species in the medium causes preferential adhesion of acidic CO2 onto basic metal oxide surfaces. This chemical interaction leads to the formation of metal carbonate and thus the storage of CO2 more effectively. Reference Freund and Roberts10,Reference Isahak, Ramli, Ismail, Ismail, Yusop, Hisham and Yarmo11 Studies on metal oxides (i.e., CuO, Cu2O, Al2O3, Fe2O3) prepared either in macroscale or nanoscale revealed promising CO2 adsorption capacities. Reference Isahak, Ramli, Ismail, Ismail, Yusop, Hisham and Yarmo11–Reference Baltrusaitis, Schuttlefield, Zeitler and Grassian14
Developing new systems for enhancing CO2 adsorption and storage capacities are still drawing a great deal of attention. Numerous efforts to implant various metal structures and/or to modify the surface chemistry of solid adsorbents have been reported so far. Reference Zukal, Pastva and Čejka15–Reference Bezerra, Da Silva, De Moura, Sousa, Vieira, Rodriguez-Castellon and Azevedo19 Among all these efforts, the design of hybrid systems that accommodate both metal oxide nanomaterials and solid adsorbents is particularly intriguing since they embody the advantages of both of the components. Although solid adsorbents serve as very stable host materials, metal oxides in nanoscale contribute to an increase in the surface area for the selective adsorption of more gas molecules. The use of copper oxide nanoparticles (NPs) in such a hybrid system is an attractive way for the improving gas adsorption capabilities of solid adsorbents. The main advantage of copper oxides over other metal oxides is that they require relatively low temperatures for both the adsorption and desorption of CO2 for further use. Studies reveal that calcium oxide and magnesium oxide are also good at adsorbing CO2 at 823 K and 423–673 K, respectively. Reference Han, Zhou, Chun and Zhu20,Reference Dou, Song, Liu and Feng21 However, decomposition of calcium carbonate and magnesium carbonate requires considerably higher energy (∆H decomp. values of CaCO3 and MgCO3 are +178.5 kJ/mol and +118 kJ/mol, respectively). Reference Han, Zhou, Chun and Zhu20,Reference Dou, Song, Liu and Feng21 On the other hand, CO2 adsorption on copper oxide surfaces can be done at room temperature, and regeneration of the gas from copper carbonate can happen at lower temperature of approximately 580 K (∆H decomp. for CuCO3 is only +45.5 kJ/mol). Reference Isahak, Ramli, Ismail, Ismail, Yusop, Hisham and Yarmo11
The synthesis of copper(I) oxide (Cu2O) and copper(II) oxide (CuO) NPs on different support surfaces (i.e., zeolite, activated carbon, carbon nanotube) and their use in various applications such as super capacitors and gas adsorbents have been reported in several studies. Reference Jeon, Min, Ahn, Hong, Shin, Kim and Lee13,Reference Phiwdang, Suphankij, Mekprasart and Pecharapa22–Reference Kim, Cho and Park25 However, to the best of our knowledge synthesis of CuO nanostructures in spiky morphology on zeolite surfaces have not been reported to date. Moreover, there is no study investigating the CO2 adsorption properties of any hybrid system that contains nanosized CuO on zeolites.
In this study, CuO NPs with two different morphologies (spiky and spherical) were synthesized on zeolite-Y by a modified impregnation method. The CuO NP-loaded zeolites were characterized by transmission electron microscopy (TEM), scanning electron microscopy (SEM), X-ray diffraction (XRD), X-ray photoelectron spectroscopy (XPS), Brunauer–Emmett–Teller (BET), and atomic absorption spectroscopy (AAS), and their capabilities of CO2 capture were also investigated by thermogravimetric analysis (TGA), Temperature Programmed Desorption (TPD), and fourier transform infrared (FTIR). The results showed that compared to bare zeolite there is a significant increase in chemical adsorption of CO2 with the presence of CuO NPs on zeolite surfaces. Both of the hybrid systems are promising additions to the family of materials with CO2 capturing properties.
II. EXPERIMENTAL SECTION
A. Materials
Copper(II) chloride (CuCl2), sodium hydroxide (NaOH), sodium chloride (NaCl), and sodium Y zeolite (zeolite-Y) were purchased from Sigma Aldrich (St. Louis, Missouri). Sodium borohydride (NaBH4) (98%), and nitric acid (HNO3) (65%) were purchased from Merck (Kenilworth, New Jersey). Deionized ultrapure water (DIUPW) was obtained by water purification system (PURELAB Option-Q, ELGA, High Wycombe, United Kingdom).
B. Synthesis of CuO NP-loaded zeolite-Y
1. Pretreatment of zeolite-Y
500 mg zeolite-Y was slurried with 100 mM NaCl solution to remove cation sites. Next, the slurry was washed with DIUPW until the surface was free of chloride, then calcined under oxygen gas flow in a furnace. Reference Zahmakiran and Özkar23
2. Synthesis of spiky CuO nanostructures on zeolite surface
0.1 M CuCl2 solution (268.9 mg CuCl2 in 20 mL DIUPW) and 500 mg zeolite-Y were mixed for 72 h at room temperature. Remnant was dried at 90 °C. Next, 20 mL of 0.1 M NaOH was added to the Cu2+ ions-implanted zeolite to form Cu(OH)2. After 2 h of mixing, black precipitate was formed. The solid was separated and washed with DIUPW. It was calcined at 350 °C for 4 h. Reference Phiwdang, Suphankij, Mekprasart and Pecharapa22
3. Synthesis of spherical CuO NPs on zeolite surface
268.9 mg CuCl2 was dispersed in 20 mL water. 500 mg pretreated zeolite-Y was added to this solution. Later, the solution was mixed for 72 h at room temperature. Slurry was washed with DIUPW and separated by centrifuging. Remnant was dried at 90 °C. 0.137 M, 100 mL NaBH4 was then added to reduce Cu2+ ions to Cu(0). Mixing was continued until no more hydrogen gas was evolved. Brown precipitate was separated by centrifuging and washed with DIUPW. Next, it was dehydrated for 4 h at 300 °C. Copper(0) particles were oxidized by oxygen gas flow to obtain CuO NPs.
C. CO2 adsorption studies
CO2 adsorption on the supports was performed at standard conditions (298 K, 1 atm) by using a simple experimental set up that contained a cylindrical glass column reactor. The samples (approximately 0.5 g) were placed in the column, which allows flow of the gas in a controlled rate. Firstly, the whole system was degassed at 423 K for 2 h, and then Ar gas was passed through the reactor to create an inert atmosphere. Later, a gas mixture of 5% CO2 and 95% N2 was flown through the column at a rate of 10 mL/min for 2 h at room temperature and pressure.
D. Instrumentation
TEM and SEM were acquired by JEM 2100F-RTEM (JEOL Ltd., Peabody, Massachusetts) and QUANTA 400F Field Emission SEM (FEI, Hillsboro, Oregon), respectively. The energy dispersive X-ray (EDX) measurements were performed on QUANTA 400F Field Emission SEM. XRD measurements were carried out on Rigaku D Miniflex pc diffractometer with Cu Kα radiation (λ = 1.54 Å) in the 2θ range from 10° to 80°. PHI-5000 Versa Probe [Physical Electronics (PHI) Chanhassen, Minneapolis, Minnesota], equipped with Al Kα at 1486.92 eV source, was used to perform XPS analyses. All data were calibrated to the hydrocarbon contamination peak at C1s of 284.5 eV. FTIR spectra of the solid samples were collected using Nicolet iS10 FTIR with iTR accessory (Thermo Fisher Scientific, Waltham, Massachusetts). The same FTIR instrument in transmission mode with 10 cm gas cell was used for collecting FTIR spectra of gas samples. A dual manifold system containing two separate channels for sample and reference was used during FTIR measurements for determination of relative CO2 adsorption amounts. Both the sample (approximately 0.3 g) and the reference were degassed for 2 h at 423K prior to the measurements. A mixture of 5% CO2 and 95% N2 was flown through the sample and the reference sequentially at a flow rate of 1 mL/min at room temperature and pressure. The mixture passed through the sample was then filled into a gas cell and spectra were collected. Perkin Elmer Pyris 1 TGA instrument (Perkin Elmer, Boston, Massachusetts) was used for TGA. 5.0 ± 0.2 mg of each sample was used in each analysis. All TGA samples were kept at 323 K for 5 min to minimize moisture content of the samples. Then, all samples were heated up to 973 K at a rate of 278 K/min under a nitrogen flow rate of 20 mL/min. The TPD analysis was performed with Micromass Quattro Micro TMGC instrument (McKinley Scientific, Sparta, New Jersey) at a heating rate of 13 K/min under flowing Ar, and the results were monitored by electron multiplier detector. BET analyses were performed with Autosorb-6 (Quantachrome Coporation, Boynton Beach, Florida) instrument. Micropore volume and area were calculated from the adsorption isotherms. Samples were dehydrated at 623 K for 6 h before each analysis. Thermo Scientific iCE 3000 SERIES spectrometer (Thermo Fisher Scientific, Waltham, Massachusetts) was used for AAS measurements. Signals were processed with Solaar software. Hollow cathode lamp was used as a radiation source. All measurements were performed at the wave length of 324.8 and 327.4 nm, with a spectral band pass of 0.5 nm.
III. RESULTS AND DISCUSSION
The synthesis of spiky CuO nanostructures on zeolite was done with a modified impregnation method based on methods previously described in the literature. Reference Phiwdang, Suphankij, Mekprasart and Pecharapa22,Reference Shoja Razavi and Loghman-Estarki24 The synthesis of spiky nanostructures involved mixing copper precursor and zeolite, which led to the introduction of Cu2+ ions onto the support surface. Addition of NaOH then resulted in the formation of a Cu(OH)2 precipitate. Finally, dehydration of the precipitate resulted in the formation of CuO nanostructures in spiky morphology on the supports’ surface. Similar to the spiky nanostructure synthesis, the spherical NP synthesis also include loading of Cu2+ ions onto the zeolite surface by ion exchange. Reference Zahmakiran and Özkar23,Reference Shoja Razavi and Loghman-Estarki24 However, the ions were first reduced to copper(0) by NaBH4 and then oxidized to form CuO NPs by O2 treatment. Difference in the final step of two procedures is the most likely reason for the observed variation in their morphologies. While dehydration of Cu(OH)2 resulted in an irregular growth of CuO NPs with spiky morphology, the reduction of Cu2+ ions to Cu(0) particles and then its oxidation led to a slower but more controlled method to synthesize CuO NPs with spherical morphology. This prevented them from assembling into more complex structures.
TEM and SEM images of zeolite with spiky CuO nanostructures and bare zeolites are demonstrated in Figs. 1(a), 1(b), and S1. The TEM micrographs show that CuO nanostructures grow out of the zeolite surface irregularly to form mainly spiky and rarely wire-like structures. The size of the spiky-shaped nanostructures is around 450 nm in length while the wire-like structures are in the micron range. The sizes of the crystallites were estimated with XRD peak analysis as 17 ± 2 nm. This estimation, along with the TEM images, suggests that synthesized spiky and wire-like structures are formed by the assembly of CuO nanocrystallites. EDX analysis which is performed in conjunction with SEM analysis provides a primitive verification of the CuO NPs’ existence on the zeolite surface [Fig. S1(f)]. AAS analysis shows that the copper content of the system is 12% by weight.
TEM and SEM images of (a–b) spiky, (c–d) spherical CuO NPs on zeolite.

Figures 1(c), 1(d), and S2 show microscope images of spherical CuO NPs on zeolite. TEM images demonstrate that spherical NPs with sizes of 18 ± 7 nm are located on the surface in a well-dispersed form [Fig. 1(c)]. The SEM image shows aggregated NPs as well as the dispersed ones on the support surface [Fig. 1(d)]. Analysis of the XRD peaks reveals the size of crystallites as 15 ± 2 nm. The EDX analysis of these NPs on the zeolite surface suggests the presence of copper oxide on the support [Fig. S2(d)]. The copper content of the adsorbent was measured as 10% by weight with AAS analysis.
XRD patterns of zeolite and zeolite-supported CuO nanostructures are given in Fig. 2. A comparison of these patterns shows that the zeolite framework and its crystalline nature remained after NP synthesis on it. Unfortunately, most of the CuO peaks are washed out by the strong peaks of zeolite. Only two CuO signature peaks at 35.48° and 38.92°, which are assigned to the (200) and (002) planes (JCPDS 80-1268), Reference Phiwdang, Suphankij, Mekprasart and Pecharapa22 are observed for both CuO NP and zeolite hybrid systems, confirming the formation of CuO on zeolite.
XRD patterns of (a) zeolite-Y, (b) spherical, and (c) spiky CuO NPs on zeolite.

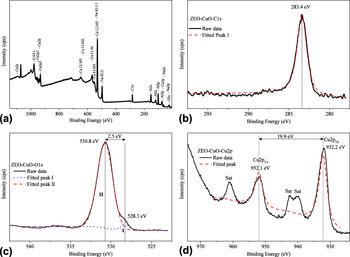
The XPS spectra of spiky CuO NP-loaded zeolites are demonstrated in Fig. 3. The spectra of spherical CuO NP-loaded zeolites are given in Supplementary Materials since they are identical to the ones for the spiky CuO NP–zeolite system (Fig. S3). The survey XPS spectra of both systems suggest the presence of copper on the zeolite surface as well as Na, Si, Al, and O of the zeolite structure [Fig. 3(a)]. No species contaminating the hybrid systems are observed, except a low amount of carbon (C1s at 283.4 eV) used for calibration [Fig. 3(b)]. Compared to the expected reference value of C1s at 284.6 eV, the 1.2 eV shift of the peak toward a lower binding energy is most likely due to a matrix effect of Na-zeolite-Y. Reference Zahmakiran, Durap and Özkar26
The XPS spectra of spiky CuO NPs on zeolite: (a) survey, (b) C1s, (c) O1s, and (d) Cu2p.

A O1s core-level spectrum is given in Figs. 3(c) and S3(c). The two Gaussians (I and II) were resolved by using a curve-fitting process. The peak located at 528.3 eV (I) is for the O2− ion in CuO and the one at 530.8 eV (II) is for the oxygen adsorbed on the CuO surface. Reference Xu, Ji, Shen, Tang, Ye, Jia and Xin27–Reference Ghijsen, Tjeng, van Elp, Eskes, Westerink, Sawatzky and Czyzyk29 Figs. 3(d) and S3(d) show the Cu2p core-level XPS spectrum. The peaks corresponding to Cu2p 1/2 and Cu2p 3/2 are observed at 952.1 eV and 932.2 eV, respectively. These values are in good agreement with the previously reported values of CuO. Reference Ghijsen, Tjeng, van Elp, Eskes, Westerink, Sawatzky and Czyzyk29–Reference Parhizkar, Singh, Nayak, Kumar, Muthe, Gupta, Srinivasa, Talwar and Major31 The separation between the Cu2p 3/2 peak and its strong satellite, which is on the high-binding-energy side, is about 9 eV. This is a characteristic feature of materials (i.e., copper dihalides or CuO) with d 9 ground state electron configuration. Reference Yao, Yu, Zhou, Jiang, Wu, Zhang and Jiang28,Reference Parhizkar, Singh, Nayak, Kumar, Muthe, Gupta, Srinivasa, Talwar and Major31,Reference Scrocco32 Thus, the XPS results prove that the synthesized hybrid systems contain copper oxide, where copper is in an oxidation state of two.
Nitrogen adsorption isotherms of zeolite and CuO NPs on zeolite systems are shown in Fig. S4. All isotherms appear to be Type I, verifying the microporous nature of the studied materials. Reference Zahmakiran, Durap and Özkar26 The micropore area and volume of zeolite-Y and CuO NP-loaded zeolite were determined by using BET. The surface areas of zeolite decrease from 750 to 695 m2/g for spherical to 734 m2/g for spiky CuO NP-containing zeolites. The pore volume of zeolite decreases from 0.269 to 0.249 cm3/g in the presence of spherical-like CuO NPs on the support, whereas it decreases to 0.265 cm3/g in the spiky CuO NP–zeolite system. The amount of change for the spiky CuO NP–zeolite system is quite low (approximately 2%) and within the instrumental error range (less than 3%). Slightly higher amounts of decrease (approximately 7%) in the zeolite surface area and pore volume are observed with the existence of spherical CuO NPs compared to spiky ones. These results suggest that spherical NPs occupy a larger area on a zeolite surface and larger volume in pores. This tentative interpretation of BET measurements agrees with the observations in SEM and TEM analyses, as the spiky CuO nanostructures grow out of the zeolite surface, and quite a large part of the structures have no contact with the support. By contrast, spherical NPs are extensively distributed on the support surface and possibly in its pores.
TGA in conjunction with TPD analysis enabled the estimation of physically and chemically adsorbed CO2 amounts. The chemical adsorption of CO2 on CuO NPs results in the formation of CuCO3. The experimental investigations showed that high temperatures (between 400 and 900 K) are required for a complete decomposition of CuCO3. Reference Isahak, Ramli, Ismail, Ismail, Yusop, Hisham and Yarmo11 On the other hand, desorption of physically adsorbed CO2 starts to occur at relatively lower temperatures (approximately 340 K). Reference Isahak, Ramli, Ismail, Ismail, Yusop, Hisham and Yarmo11 Therefore, in this study, TGA analysis was performed at elevated temperatures up to 973 K to monitor the release of both physically and chemically adsorbed CO2.
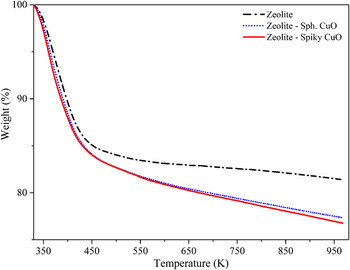
Figure 4 presents TGA curves of bare zeolite and CuO NP-loaded zeolite after CO2 treatment. The slope change in the CuO-zeolite curve is observed at around 435 K. As noted above, this is most likely the temperature where desorption of chemically adsorbed CO2 starts to occur. Thus, the weight loss up to this temperature is considered as mostly due to the desorption of physically adsorbed CO2, and the loss above 435 K results from the desorption of chemically adsorbed CO2.
TGA curves for zeolite, zeolite with spherical and spiky CuO NPs.

TGA as well as TPD analysis results are summarized in Table SI. The captured CO2 amounts under standard conditions (1 atm and 298 K) are reported in mmol CO2 per gram of sample. TGA analysis shows that the amount of weight losses is 18.59%, 22.63%, and 23.24% for zeolite, spherical, and spiky CuO NP–zeolite systems, respectively. The total amount of CO2 (both physically and chemically) adsorbed on supports is calculated as 0.916 mg (4.226 mmol/g) for bare zeolite, 1.146 mg (5.146 mmol/g) for spherical CuO NP–zeolite and 1.192 mg (5.284 mmol/g) for the spiky CuO NP–zeolite system. The comparison of these amounts reveals that the spiky CuO NP–zeolite system adsorbs 25% and the spherical CuO NP–zeolite system adsorbs 22% more CO2 compared to the bare zeolite. The increase in amount of CO2 adsorption for both systems is about 10% more than the previously reported system where physically mixed CuO powder and zeolite were used as sorbents. Reference Mat12 This increase suggests that having CuO in nanoscale results in a better capture of CO2 on a hybrid system.
TPD analyses were performed to determine the temperature ranges of physically and chemically adsorbed CO2 and to calculate their relative amounts for comparison (Fig. S5). The analyses show that desorption of physisorbed CO2 occurs at a lower temperature range (340–520 K), while that of the chemisorbed CO2 takes a place at a higher temperature range (520–810 K). Unusual broadness of physisorbed and chemisorbed regions are possible due to the presence of different types of adsorption sites and different coordination of CO3 (monodendate or bidentate) on the support surface. The results show that the majority of CO2 is physically adsorbed on bare zeolites, while chemical adsorption is dominant on CuO NP–zeolite hybrid systems (Fig. S5 and Table SI). Compared to bare zeolite (0.568 mg, 2.620 mmol/g), physically adsorbed CO2 amount decreases with spiky (0.429 mg, 1.884 mmol/g) and spherical (0.481 mg, 2.161 mmol/g) CuO NPs loaded on the zeolite. On the other hand, chemical adsorption of the CO2 increases significantly in the presence of CuO NPs on zeolite surfaces. It increases from 0.348 mg (1.606 mmol/g for bare zeolite) to 0.763 mg (3.400 mmol/g) and 0.665 mg (2.985 mmol/g) for spiky and spherical CuO NP–zeolite systems, respectively. The results show that the amount of chemisorbed CO2 increases by approximately 112% and 86% with the presence of spiky and spherical NPs on zeolite for each gram of sample, respectively. Compared to the bare zeolites as discussed previously, these increases are due to the enhanced capability of CuO to capture CO2 chemically. Within the two hybrid systems, the ones with spiky CuO NPs are slightly better sorbents than the spherical ones. This is most likely due to the higher Cu content of the spiky CuO NP–zeolite system as measured by AAS analysis. This might lead to an increase in available sites for CO2 adsorption and thus the higher CO2 adsorption capacity of this system.
Regeneration performances of the hybrid systems were investigated by adsorption–desorption cycle experiments carried out by TGA analysis. An average weight change of 23% was observed at the end of each cycle (Table SII). The results show that the hybrid systems are very stable and regenerated with a simple heat treatment without performance loss.
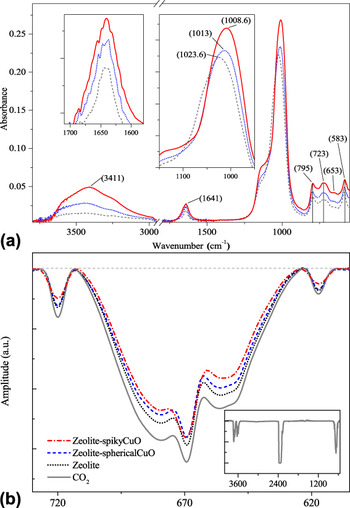
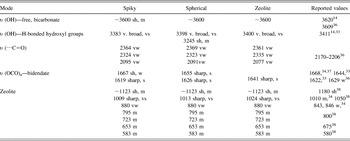
The FTIR spectra of bare zeolite and zeolite with CuO NPs after CO2 treatment are given in Fig. 5(a). Band assignments for each species observed in each of the spectra are summarized in Table I. The strong and very broad band centered around 3400 cm−1 for zeolite clearly belongs to the hydrogen-bonded hydroxyl group. Reference Isahak, Ramli, Ismail, Ismail, Yusop, Hisham and Yarmo11,Reference Baltrusaitis, Schuttlefield, Zeitler and Grassian14,Reference Baltrusaitis, Jensen and Grassian33,Reference Su and Suarez34 Similar features with slightly red shifted centers are observed for the CuO NP-loaded zeolite systems, too. Such a strong and broad feature is not observed in any of the untreated adsorbents. The most likely reason of the existence of a hydrogen-bonded network is the exposure of samples to ambient air during measurements. Vibrational modes of some free –OH of bicarbonates appear as a shoulder around 3600 cm−1 on the high energy side of this broad feature in each of the adsorbent. The clear appearance of a hump on the red side around 3250 cm−1 suggests the occurrence of a hydrogen-bonding network. The spiky CuO NP–zeolite system has the strongest features suggesting significantly higher amounts of CO2 adsorption on its surface, and this can form a large H bonding network. Similarly, the spherical CuO NP–zeolite system, too, has higher enhancement on the CO2 adsorption compared to the bare zeolite. This observation is consistent with TGA and TPD analyses. It is also important to note that the spectra given are of ATR FTIR; thus, the species or groups on the surface of the samples are the ones exposed to air mostly, and their bands are more apparent.
(a) FTIR-ATR spectra of zeolite (dash), zeolite with spherical (dot) and spiky (line) CuO NPs after CO2 adsorption. Insets show the 900–1200 and 1550–1700 cm−1 regions of the spectra. (b) FTIR spectra of CO2 before and after passed through zeolite, spherical and spiky CuO NP–zeolite systems in the range of 600–750 cm−1. Inset shows the full FTIR spectrum of CO2.

Summary of observed IR bands on surface of the bare zeolite and CuO NP–zeolite systems after CO2 treatment.

sh: shoulder; v.: very; s: strong; m: medium; w: weak.
The region below 2500 cm−1 in the spectra of all samples show bands of CO2 adsorbed on the surface. Reference Dantas, Luna, Silva, de Azevedo, Grande, Rodrigues and Moreira35 The observed features are consistent with the vibrational modes of the bidentate CO3 group (mainly of bicarbonate and H-bonded) when compared with the literature. Reference Baltrusaitis, Jensen and Grassian33,Reference Su and Suarez34,Reference Su, Zhang, Feng, Chen, Ying and Li36,Reference Pirngruber, Raybaud, Belmabkhout, Čejka, Zukal, Arean and Nachtigall37 The main feature centered at 1640 cm−1 is assigned to asymmetric stretching, υ (OCO)a mode. Reference Baltrusaitis, Jensen and Grassian33,Reference Su, Zhang, Feng, Chen, Ying and Li36 The band broadens due to a combination of two modes, and it increases in intensity for both spiky and spherical NP-loaded zeolites. The bands observed below 1150 cm−1 belong to metal–oxygen or various kinds of torsional and bending modes of carbonates and bicarbonates. Reference Isahak, Ramli, Ismail, Ismail, Yusop, Hisham and Yarmo11,Reference Baltrusaitis, Schuttlefield, Zeitler and Grassian14,Reference Baltrusaitis, Jensen and Grassian33,Reference Godhani, Nakum, Parmar, Mehta and Desai38 The strongest mode observed in the spectrum of bare zeolite at 1024 cm−1 with a shoulder at approximately 1123 cm−1 is mainly due to the zeolite structure. Reference Godhani, Nakum, Parmar, Mehta and Desai38 However, a red shift of 10 cm−1 and an increase in intensity were observed for both spiky and spherical CuO NP–zeolite systems. The observed shift is possible due to the interaction between CO2 and CuO NPs to form a bicarbonate, Reference Baltrusaitis, Schuttlefield, Zeitler and Grassian14,Reference Baltrusaitis, Jensen and Grassian33 while the intensity increase is because of the larger amount of CO2 adsorption on hybrid systems compared to on the bare zeolite. The modes below 800 cm−1 are also mainly due to zeolite structure as given in Table I along with reported cases in the literature. The spectrum of virgin zeolite is given in Fig. S6 for comparison.
Relative CO2 adsorption capacities of zeolite and hybrid zeolite with two different morphologies of CuO NPs are evaluated with the aid of FTIR analysis. The spectra of a reference gas [CO2 (5%) and N2 (95%)] that filled into the gas cell and the gas that passed through the bare zeolite and through two CuO NP–zeolite systems are given in Fig. 5(b). The spectra given in the inset of Fig. 5(b) clearly show CO2 bands 39 in 4000–550 cm−1 range. As the gas mixture passes through the sample, CO2 is adsorbed on the surface and a loss in its partial pressure in the mixture occurs. This results in a decrease in the band intensity of CO2 at the IR transmission spectra. The loss in intensity is clearly observed in the 740–600 cm−1 region. The relative adsorption amounts are determined with respect to the reference CO2–N2 mixture spectrum. The analysis shows that the presence of spiky and spherical CuO NPs on zeolite increases the CO2 adsorption by approximately 80% and approximately 50%, respectively. This large increase is consistent with TGA and TPD analysis. In addition, the comparison of these two hybrid systems confirms the higher CO2 capture capacity of spiky CuO NPs (approximately 20%) compared to the one of spherical NPs.
XPS analysis of CO2-treated bare zeolite and CuO NP–zeolite systems were performed to confirm the results obtained by FTIR analysis and for observing carbonate formation after chemical adsorption of CO2 on CuO. The spectrum obtained from spiky CuO NP–zeolite systems are presented in Fig. 6 and discussed here. The spectrum collected from the spherical CuO NP-containing system is given in Fig. S7, since both NP systems yielded quite similar results. The spectrum for C1s shows two peaks at 283.4 and 288.0 eV [Fig. 6(a)]. The one at 283.4 eV corresponds to C1s where the reference value is 284.5 eV. Reference Isahak, Ramli, Ismail, Ismail, Yusop, Hisham and Yarmo11 The peak at 288.0 eV is assigned to a carbonate, based on the reported literature value of 289.0 eV. Reference Isahak, Ramli, Ismail, Ismail, Yusop, Hisham and Yarmo11
XPS spectra of spiky CuO NPs on zeolite after CO2 treatment: (a) C1s, (b) O1s, (c) Cu2p.

The O1s spectrum demonstrates two peaks at 529.2 and 530.7 eV with a difference of 1.5 eV [Fig. 6(b)]. These values are in good agreement with the previously reported ones which are at 530.6 eV and 532.1 eV (1.5 eV difference) for CuO and CuCO3, respectively. Reference Isahak, Ramli, Ismail, Ismail, Yusop, Hisham and Yarmo11 The XPS spectrum of O1s therefore suggests the presence of both CuO and CuCO3 in the sample of zeolite with CuO after CO2 exposure. Furthermore, it is important to note that SiO2 (532.9 eV), Al2O3 (531.2 eV), and Na2O (529.6 eV) are also present in the zeolite framework structure, and they are expected to make contributions to the observed O1s peak centered at 530.7 eV. Reference Xie, Huang and Kaliaguine40
The Cu2p core-level XPS spectrum is given in Fig. 6(c). The Cu2p peaks are broader and not symmetrical compared to the ones observed in the XPS spectrum before CO2 treatment. The fitting resulted in two bands under the broad Cu2p peaks. The Cu2p 3/2 peak is the combination of two peaks with the binding energies of 933.5 and 931.9 eV. The position of these peaks and the 1.6 eV difference between them agree well with the CuO (933.0 eV) and CuCO3 (934.8 eV) peaks reported for CuO powders after CO2 adsorption. Reference Isahak, Ramli, Ismail, Ismail, Yusop, Hisham and Yarmo11 The relative areas of those peaks show that 44% of CuO captured CO2 chemically, and carbonate deposition takes place only after 2 h of CO2 exposure. Strong satellite peaks indicate the presence of CuO NPs (about 56%) that do not capture CO2 in the medium. Reference Yao, Yu, Zhou, Jiang, Wu, Zhang and Jiang28,Reference Parhizkar, Singh, Nayak, Kumar, Muthe, Gupta, Srinivasa, Talwar and Major31 The high yield of CuCO3 formation in a relatively short amount of time shows that the prepared systems are good at adsorbing CO2 chemically at room temperature and pressure.
IV. CONCLUSIONS
In this study, spiky and spherical shaped CuO NPs on zeolite-Y were synthesized. After a detailed characterization with various techniques, they were investigated for their CO2 adsorption capabilities under standard conditions. Significant enhancements in the amount of CO2 adsorption by zeolite-Y were noted with the presence of CuO NPs in both morphologies. When both physically and chemically adsorbed CO2 are considered, increases of about 25% and 22% were observed for spiky and spherical CuO NP-loaded zeolites, respectively. The enhancements are more notable when only chemisorbed CO2 amounts are considered. Spiky and spherical CuO NP-loaded zeolites yielded approximately 112 and 86% increases in chemisorption of CO2 compared to the bare zeolite. In all the systems studied, the same general trend (zeolite < zeolite–spherical CuO NP < zeolite–spiky CuO NP) in total CO2 adsorption amounts were observed using two different analyses (FTIR and TGA). The results suggest that the prepared hybrid systems are able to adsorb CO2 very well at room temperature and pressure, and the existence of CuO NPs on zeolite surfaces make a significant contribution, particularly to the amount of chemisorbed CO2. This makes the CuO NP–zeolite systems very promising sorbents for capturing CO2.
Supplementary Material
To view supplementary material for this article, please visit https://doi.org/10.1557/jmr.2017.337.
ACKNOWLEDGMENTS
We acknowledge Assoc. Prof. Okan Esenturk for guidance in FTIR measurements and data evaluation, Assoc. Prof. Gulay Ertas for discussions on XPS data, Prof. Jale Hacaloglu and Halil Ipek for access to TGA instrument and help on TPD measurements and Prof. Aysen Yilmaz for access to XRD instrument in METU Department of Chemistry. We also acknowledge the support from METU-BAP Project: BAP-07-02-2014-007-442.