


Introduction
The spatial heterogeneity of malaria transmission dynamics and intensity differs among sites. Apart from socio-economic, climatic, and ecological factors, vector density, distribution, biology, bionomics, and vectorial attributes are the key determinants of variable malaria transmission (Lindsay and Birley Reference Lindsay and Birley1996; Bigoga et al. Reference Bigoga, Manga, Titanji, Coetzee and Leke2007; Dia et al. Reference Dia, Konate, Samb, Sarr, Diop and Rogerie2008; Pradhan et al. Reference Pradhan, Tarai and Hazra2020). However, it is still difficult to identify the precise factor that contributes significantly to the variation. Despite tremendous control strategies, Odisha, an eastern state in India, has consistently seen malaria endemicity (Kumar et al. Reference Kumar, Valecha, Jain and Dash2007). More than 90% of reported malaria cases are caused by Plasmodium falciparum (Plasmodiidae) (National Vector Borne Disease Control Programme, Odisha 2016–2017, https://nvbdcp.gov.in/index1.php?lang=1&level=1&sublinkid=5784&lid=3689). India has 58 species of anopheline mosquitoes, Anopheles spp. (Diptera: Culicidae). Six are primary malaria vectors. Among these, A. culicifacies and A. fluviatilis are predominant primary vectors in rural Odisha (Sahu et al. Reference Sahu, Gunasekaran, Krishnamoorthy, Vanamail, Mathivanan, Manonmani and Jambulingam2017). The state is also rich in secondary vector species, namely A. annularis and A. subpictus (Gunasekaran et al. Reference Gunasekaran, Sahu, Parida, Sadanandane, Jambulingam and Das1989; Kumari et al. Reference Kumari, Das and Mahapatra2013; Das et al. Reference Das, Patra, Das, Mahapatra, Tripathy, Kar and Hazra2014). Vector heterogeneity is extensive throughout Odisha. However, among various entomological parameters, vector incrimination is a prerequisite for evaluating the role of major anopheline fauna in disease-transmission profiles in terms of entomological inoculation rate (Amek et al. Reference Amek, Bayoh, Hamel, Lindblade, Gimnig and Odhiambo2012; Abraham et al. Reference Abraham, Massebo and Lindtjorn2017).
The present study was conducted in three districts of Odisha – hyperendemic Kalahandi (southern district), mesoendemic Bargarh (western district), and hypoendemic Cuttack (coastal district) – which differ significantly from each other in malariogenic stratification (Pradhan et al. Reference Pradhan, Pradhan, Pati and Hazra2018). Malaria transmission in a particular area refers to anopheline vectors actively transmitting malaria infections in human populations. The intensity of malaria transmission is related to the frequency with which a population at a given location may be exposed to the bite of a plasmodial sporozoite–infected anopheline vector and, thus, to the possibility of becoming infected with plasmodial parasites. Hence, sporozoite rate quantifies the infection rate and the sporozoite propensity to transmit malaria in a population (Sahu et al. Reference Sahu, Gunasekaran, Krishnamoorthy, Vanamail, Mathivanan, Manonmani and Jambulingam2017).
Few studies have been undertaken to detect the infection status or their frequencies in dominant malaria vectors in Odisha. The relationship between parasite density and extent of infectiousness has not been investigated. The overarching goal of the present study was to investigate malaria transmission dynamics in relation to vector incrimination in these three districts where malaria endemicity differs. The study examined how the quality and the quantity of plasmodial infection rate vary among mosquitoes and their organs and among areas. The results will improve understanding of infection status within malaria vectors and how the parasite population density may affect transmissibility, which will in turn provide better information about the development of new intervention measures.
Materials and methods
Study area
The study was carried out in 2015–2017 in three districts of Odisha, namely in Kalahandi, where malaria is highly endemic, in Bargarh, where malaria is moderately endemic, and in Cuttack, where malaria is low endemic (Fig. 1). Nearly 10 villages were selected in each district for their variable malaria endemicity. Hyperendemic Kalahandi, a southwestern district of 7920 km2, is located between 19° 3ʼ N and 21° 5ʼ N and 82° 30ʼ E and 83° 74ʼ E, more than one-third of which is mountainous and densely forested. Hypoendemic subcoastal Cuttack (the former capital of Odisha) is located at 20° 31ʼ 23ʼʼ N and 85° 49ʼ 60ʼʼ E and is 3932 km2 in area. Mesoendemic Bargarh is located in western Odisha, at 21.33° N and 82.62° E, and covers 5837 km2.
Odisha map showing the study areas – Cuttack, Bargarh, and Kalahandi, Odisha, India – along with their annual parasite incidence (API) from 2015 to 2017.
 $$API = {{{\rm{confirmed}}\;{\rm{malaria}}\;{\rm{cases}}\;{\rm{during}}\;{\rm{one}}\;{\rm{year}}\; \times \;1000} \over {{\rm{population}}\;{\rm{under}}\;{\rm{surveillance}}}}$$

Epidemiological investigations
The epidemiological data for Kalahandi, Bargarh, and Cuttack were collected from the National Vector Borne Disease Control Programme, Odisha (https://nvbdcp.gov.in), a surveillance system that measures malaria incidence based on blood-smear examination at primary health centres. Total malaria-positive cases from each district were collected per season (summer, winter, and monsoon) to estimate further association with vector infection status. The proportion of malaria cases in each season throughout the two-year study period in the selected district was calculated as:
 $$Px = {{{\rm{total}}\;{\rm{number}}\;{\rm{of}}\;{\rm{malaria}}\;{\rm{cases}}\;{\rm{per}}\;{\rm{season}}} \over {{\rm{total}}\;{\rm{number}}\;{\rm{of}}\;{\rm{malaria}}\;{\rm{cases}}\;{\rm{throughout}}\;{\rm{the}}\;{\rm{year}}}},$$
where Px equals the proportion of malaria cases in a given season and x equals the season (summer, winter, or monsoon).
Three meteorological seasons, summer (March–May), rainy (monsoon; June–October), and winter (November–February), are pronounced in Odisha.
Mosquito collection and identification and dissection
Both indoor and outdoor mosquito collection was carried out twice daily in each selected village in the morning (06:30–08:30) and evening (18:30–20:30). Indoor mosquitoes were collected from different biotopes, such as cattle sheds and human dwellings, whereas outdoor resting mosquitoes were collected from a variety of environments, such as tree holes, water pipes, outer eves of huts, broken pots, and cracks and holes in the ground. Mosquitoes were collected for 15 minutes from each habit or habitat using an oral aspirator and a flashlight. The adult female Anopheles mosquitoes collected were identified taxonomically based on their distinguishing features (head, thorax, legs, halters, wings, segmentation of body, and size of proboscis), following the standard identification keys described by Barraud (Reference Barraud1934) and Harbach (Reference Harbach2004). Individual female mosquitoes of known and potential vector efficacy (A. culicifacies and A. annularis) were dissected into two parts – head–thorax and abdomen – to detect salivary gland sporozoites and oocyst sporozoites, respectively, by microscope. The corresponding head–thorax and abdomen sections of positive specimens were transferred into two separate 1-mL Eppendorf tubes for further confirmation by polymerase chain reaction (Mohanty et al. Reference Mohanty, Kar, Mishra, Singh, Mahapatra, Das and Hazra2007). Similarly, the engorged Anopheles species were crushed on Whatman filter papers for detection of plasmodium species in blood sources (World Health Organisation 1992).
Multiplex polymerase chain reaction for vector identification and sporozoites detection
Genomic DNA was extracted from the head–thorax and abdomen regions of mosquitoes, following the protocol standardised by Hazra et al. (Reference Hazra, Barik, Prusty, Rath and Kar2013). The blood DNA from filter paper was isolated with the Chelex method, following the procedure by Suenaga and Nakamura (Reference Suenaga and Nakamura2005) and Bereczky et al. (Reference Bereczky, Martensoon, Gil and Farnert2005), with modifications. Multiplex polymerase chain reaction was performed to detect P. falciparum infection and to confirm the vector species identity, following the procedure described by Rath et al. (Reference Rath, Prusty, Barik, Das, Tripathy, Mahapatra and Hazra2017). For each test, a pool of 15–20 anopheline mosquitoes from each species was selected. However, for organ-specific plasmodial-species detection, single mosquito parts (head–thorax and abdomen) were subjected to polymerase chain reaction analysis.
Real-time polymerase chain reaction for plasmodial sporozoite quantification
The DNA extracted from different areas and body parts was stored at –20 °C for real-time polymerase chain reaction. Polymerase chain reaction was performed with the Applied Biosystems 7500 Fast Real-Time PCR system using the SYBR-Green real-time PCR kit (Thermo Fisher Scientific, Waltham, Massachusetts, United States of America). The polymerase chain reaction primers were designed to amplify the targeted r-DNA region of Plasmodium falciparum, as described by Mohanty et al. (Reference Mohanty, Kar, Mishra, Singh, Mahapatra, Das and Hazra2007). Each of the forward (5ʼ AGCGTGATGAGATTGAAGTCAG3ʼ) and reverse (5ʼ CCCTAAACCCTCTAATCATTGTC3ʼ) primers was added to a final concentration of 200 nM, along with 2 µL of DNA sample, for a final reaction volume of 25 µL. The polymerase chain reaction was performed using only Plasmodium falciparum primers and the DNA of the head–thorax parts and the abdomen parts of the same mosquito for detection of sporozoite.
Each sample was assayed in triplicate with the following thermal profile: 6 minutes at 95 °C, followed by 35 cycles of 30 seconds at 95 °C, 30 seconds at 55 °C, and 1 minute at 72 °C. A standard dilution series was included with each polymerase chain reaction run, and a threshold cycle value (C t ) was determined for each sample at the point it crossed a baseline value. Any sample that failed to amplify before the baseline point was reached was considered negative for plasmodial sporozoite presence. The baseline value was set as C t 30. Nuclease-free water was used as the nontemplate control, and DNA isolated from plasmodium-positive mosquitoes was used as positive control. Amplification was followed by a melting curve to ensure the correct target sequence was being amplified.
Data analysis
The density of mosquitoes was expressed as the number of female Anopheles mosquitoes collected per man-hour. One-way analysis of variance was used to compare the mean density of predominant anopheline fauna among the three districts during different seasons. An unpaired t-test was used to compare the organ- and area-specific infection-rate detection and to quantify infection. P-values lower than 0.05 were considered statistically significant. The data were inspected with Microsoft Excel 2010 spreadsheets (Microsoft Corp., Redmond, Washington, United States of America).
The minimum infection rate was calculated as follows:
 $${\rm{Minimum}}\;{\rm{infection}}\;{\rm{rate}} = {{{\rm{number}}\;{\rm{of}}\;{\rm{positive}}\;{\rm{pools}}\; \times \;100} \over {{\rm{total}}\;{\rm{number}}\;{\rm{of}}\;{\rm{specimens}}\;{\rm{tested}}}}$$
The positive pool rate was calculated as follows:
 $${\rm{Pool}}\;{\rm{positive}}\;{\rm{rate}} = {{{\rm{number}}\;{\rm{of}}\;{\rm{positive}}\;{\rm{pools}}\; \times \;100} \over {{\rm{total}}\;{\rm{number}}\;{\rm{of}}\;{\rm{pools}}\;{\rm{tested}}}}$$
Results
Seasonal distribution of Anopheles culicifacies and Anopheles annularis in the three study districts
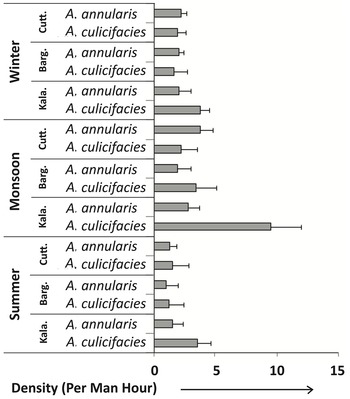
The adult mosquito collection from the three study areas revealed that A. culicifacies, the primary vector, and A. annularis, the secondary vector, were the two most potent vector species collected throughout the study’s surveillance period (Fig. 2). Although other species were collected, we did not find vectorial potential or features among them. In addition, quantitatively significantly few A. fluviatilis, A. stephensi, A. minimus, and A. sundaicus – all primary vectors – were collected during the study period. Because of this, the study concentrated only on A. culicifacies and A. annularis. The per-man-hour density of A. culicifacies was found to be highest in the Kalahandi district. One-way analysis of variance also showed that the mean density of A. culicifacies was significantly higher during the monsoon season (P < 0.05) in Kalahandi, whereas no significant variation in density was observed in the other districts. The mean density of A. annularis did not differ significantly by season or district.
Per-man-hour density of two major anopheline mosquito species collected from Cuttack, Bargarh, and Kalahandi, Odisha, India during three seasons. Error bars represent standard error of mean.

Multiplex polymerase chain reaction: qualitative analysis
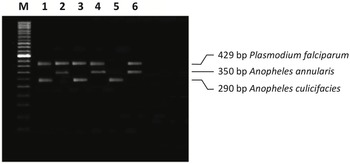
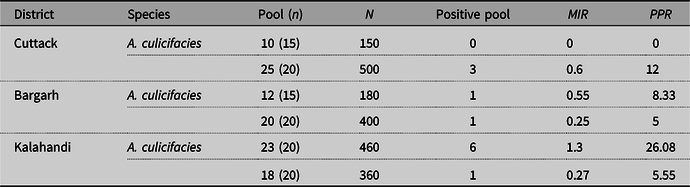
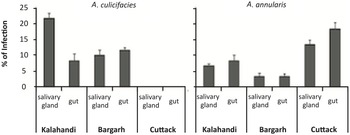
Plasmodium falciparum within A. culicifacies and A. annularis was scanned by multiplex polymerase chain reaction assay. The assay amplified the A. culicifacies and A. annularis species’ 290-bp and 350-bp bands, respectively, and the Plasmodium falciparum-specific 429-bp polymerase chain reaction product (Fig. 3). Table 1 shows the infection status of major malaria vectors in the three malariogenically stratified districts. The minimum infection rate of plasmodial sporozoite for A. culicifacies was highest in Kalahandi, followed by that in Bargarh, and it was nil in Cuttack. However, for A. annularis, the minimum infection rate was highest in Cuttack, followed by Kalahandi and Bargarh. In order to detect infective anopheline vector status, exact localisation of plasmodial sporozoite DNA was performed via organ-specific (salivary gland and gut) polymerase chain reaction. Microscopy- and polymerase chain reaction–confirmed samples are shown in Figure 4. The plasmodium-positive blood samples were also omitted from the experiment and were considered negative for oocyst sporozoites. The results indicated that a significant percentage of anopheline species was both gland- and gut-positive for Plasmodium falciparum, except in the Cuttack district, where a significant percentage was found to be both gland- and gut-positive for A. culicifacies. In hyperendemic Kalahandi, the gland-positive rate was higher for A. culicifacies, whereas in hypoendemic Cuttack, it was higher for A. annularis. The t-test results revealed a significant difference in infection rate between gland and gut in Kalahandi, whereas no such significant difference was observed for Bargarh for A. culicifacies (P < 0.05). Similarly, a significant difference in organ-specific infection rate was detected only in Cuttack for A. annularis (P < 0.05).
Multiplex polymerase chain reaction amplification of mosquito DNA to identify anopheline species and plasmodial sporozoite in Kalahandi (lanes 1 and 2), Bargarh (lanes 3 and 4), and Cuttack (lanes 5 and 6), respectively. Lane M: 50-bp ladder.

Plasmodial sporozoite infection status in three districts of Odisha

N, total number tested; n, number in each pool; MIR, minimum infection rate; PPR, pool positive rate.
Organ-specific percentage of plasmodial infection in major anopheline vector species in Kalahandi, Bargarh, and Cuttack districts, Odisha, India. Error bars represent standard error of mean (N = 100).

Association between sporozoite rate and malaria transmission in three seasons
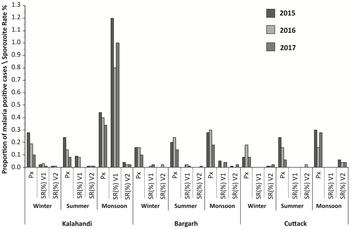
The proportion of malaria-positive cases and infection rates of two anopheline vectors among the three seasons and three districts in Odisha is shown in Figure 5. The epidemiological data indicated a high proportion of malaria morbidity during monsoon season in the three districts throughout the study period. The plasmodial sporozoite rates obtained by multiplex polymerase chain reaction indicated a high infection rate in Kalahandi for A. culicifacies during monsoon season. Similarly, in Bargarh, a visible infection rate was detected for the two studied vector species. In low-endemic Cuttack, an unexpectedly high sporozoite rate was associated with A. annularis compared to those in the other two districts during monsoon season.
Seasonal distribution of plasmodial sporozoite rate and proportion of malaria-positive cases in Kalahandi, Bargarh, and Cuttack districts, Odisha, India. P x : proportion of malaria-positive cases; SR (%) V1: sporozoite rate for A. culicifacies; SR (%) V2: sporozoite rate for A. annularis.

Real-time polymerase chain reaction: quantitative analysis
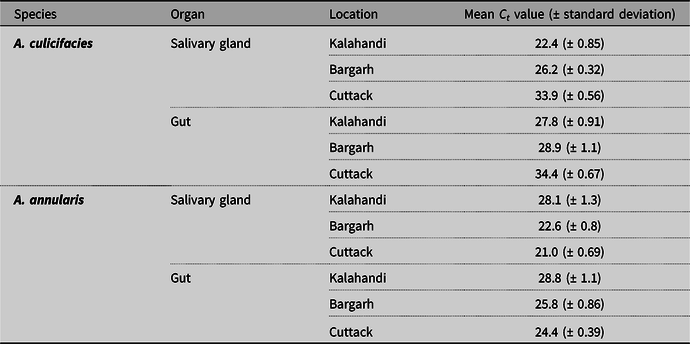
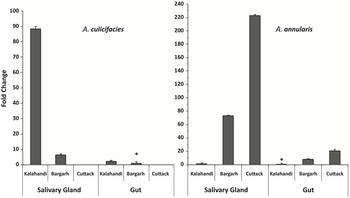
In-depth quantitative analysis of Plasmodium falciparum real-time polymerase chain reaction on DNA extracts from Anopheles vectors revealed that mean C t values for salivary gland genomic extract were less than those for gut genomic extract in Kalahandi and Bargarh for A. culicifacies. Similarly, mean C t values of A. annularis for salivary gland DNA extract were less than those for gut gland DNA extract in the three districts. However, Cuttack and Bargarh revealed lower C t values than Kalahandi did (Table 2). In screening plasmodial infection via C t values in salivary gland and gut DNA extracts from female A. culicifacies, it was observed that Kalahandi had 14-fold more plasmodial infection (genome copies) in salivary gland extract than Bargarh did, with the infection being nearly 42.2-fold more in Kalahandi and 6.3-fold more in Bargarh in salivary gland extract than in gut extract (Fig. 6). The t-test results showed a significant difference in infection quantity between gut and gland extracts in Kalahandi for A. culicifacies but no similarly significant difference in Bargarh (P < 0.05). Similarly, significant variation in quantity of plasmodial infection was detected between Kalahandi and Bargarh. For A. annularis, only 1.6-fold more plasmodial infection was detected in salivary gland extract than in gut extract from Kalahandi. However, in Cuttack and Bargarh, significant changes (nearly 10-fold and 9.1-fold, respectively) were revealed in infection status between salivary gland extract and gut extract (P < 0.05). Salivary glands were found to have the highest levels of infection compared to guts in all three districts. Similarly, Cuttack samples contained significantly more plasmodial parasite than Bargarh or Kalahandi samples did (P < 0.05).
Area- and organ-specific plasmodial infection quantification of major anopheline vector species through real-time polymerase chain reaction analysis

C t , threshold cycle. Results were analysed based on the C t values of positive and negative control: C t for positive control: 18.2 ± 0.63; C t for negative control: 34.7 ± 0.95.
Real-time polymerase chain reaction quantification of fold change in relation to the difference in starting plasmodial sporozoite DNA material in the three study districts. Fold changes were calculated based on the C t values of each sample. The higher *C t value sample is taken as one-fold unit. Error bars represent standard error of mean.

Discussion and conclusion
Malaria is an infectious parasitic disease caused by Plasmodium spp. and disseminated by the bite of an infected female Anopheles mosquito vector (Cox Reference Cox2010; Wilson et al. Reference Wilson, Kantele and Jokiranta2011). The life cycle of the malaria parasite is complicated because it is able to change its cellular and molecular makeup. During sporogenic development, ookinetes that develop from the fusion of male and female gametes penetrate the midgut wall of the mosquito and form oocysts (Pimenta et al. Reference Pimenta, Touray and Miller1994; Rodriguez and Hernandez-Hernandez Reference Rodriguez and Hernandez-Hernandez2004). The oocyst sporozoites are themselves almost noninfectious to mammalian hosts. However, upon oocyst rupture, the sporozoites are released and migrate towards the salivary glands; only after they enter the salivary glands do sporozoites become highly infectious and transmittable to mammalian hosts (Burkot et al. Reference Burkot, Dye and Graves1989; Garcia et al. Reference Garcia, Puentes and Patarroyo2006). The mosquitoes are, at this stage, “infective” vectors rather than infectious vectors. The proportion of infective mosquitoes is the most relevant indicator in assessing human infectious reservoirs for malaria transmission.
In the present study, we evaluated and analysed the proportions of infective mosquitoes and their degree of infection in three districts of Odisha that have low, moderate, and high malaria transmission intensity. We integrated infectivity and infection quantification data from multiplex and real-time polymerase chain reactions, respectively. Detection and quantification of plasmodial infection in vector mosquitoes are essential to guiding the design of control strategies to reduce parasite survival within the vectors. In the present study, two major vector species were detected in the targeted districts – Anopheles culicifacies, a primary vector, and Anopheles annularis, a secondary vector. Kalahandi, one of the highly malarious districts in southern India, has been reported to be home to two primary vectors, A. culicifacies and A. fluviatilis (Sharma et al. Reference Sharma, Upadhyay, Haque, Singh, Adak and Subbrao2004; Gunasekaran et al. Reference Gunasekaran, Sahu, Jambulingam and Das2005). During our study period, quantitatively fewer A. fluviatilis were collected. Few studies regarding A. culicifacies and its insecticide susceptibility status have been undertaken in Cuttack, and to our knowledge, no such studies regarding vector prevalence, beyond some epidemiological investigations, have been conducted for Bargarh, a mesoendemic district (Raghavendra et al. Reference Raghavendra, Velamuri, Verma, Elamathi, Barik, Bhatt and Dash2017; Pradhan et al. Reference Pradhan, Pradhan, Pati and Hazra2018). Apart from A. culicifacies, mostly A. annularis vectors were collected in all three districts. The vectorial capacity of A. annularis and their role in malaria transmission has been reported in several endemic districts of Odisha (Singh et al. Reference Singh, Haq, Kumar and Dhiman2013; Das et al. Reference Das, Patra, Das, Mahapatra, Tripathy, Kar and Hazra2014).
The present study revealed the presence of positive pools for plasmodial parasite in A. annularis in all three districts, but for A. culicifacies, positive pools were detected only in Kalahandi and Bargarh. This suggests that in these districts, both of these species play significant roles in malaria transmission dynamics, whereas in the low-endemic Cuttack district, the transmission dynamics are solely influenced by A. annularis vectors. The highest pool positive rate in Cuttack was 12 and had a minimum infection rate of 0.6 for Plasmodium falciparum, indicating that A. annularis might play a crucial role in disease transmission in malaria endemic zones here. During the past few years, A. annularis has emerged and been incriminated as a primary vector in various regions of India (Das et al. Reference Das, Patra, Das, Mahapatra, Tripathy, Kar and Hazra2014). The common and recognised malaria vector, A. culicifacies, was not detected with a plasmodial-positive pool in Cuttack, but the highest pool positive rate (26.08) with a minimum infection rate of 1.3 was found in the Kalahandi district. In comparison to Kalahandi and Cuttack, the Bargarh district was identified with a single positive pool for both species. We found that infectiousness was more prevalent in areas with a high malaria transmission intensity than in low-endemic areas.
Besides this, we also evaluated the role of often-overlooked secondary vector species in malaria transmission. The considerations of epidemiological investigation in the analysis of malaria transmission provide a better framework of the association between sporozoite rate and malaria morbidity during different seasonal phases. Malaria transmission dynamics are affected by multiple risk factors. A high sporozoite rate in hyperendemic Kalahandi during the monsoon period might govern high malaria intensity. Rainfall influences the life cycle of female Anopheles mosquitoes by providing suitable breeding sites and, therefore, also influences the viability of plasmodial parasites within the vector species (Pradhan et al. Reference Pradhan, Rath, Mohanty, Pana and Hazra2019). Sometimes, secondary vector species may play a significantly heightened role in the transmission of malaria compared to principal vectors. Even though, in hypoendemic Cuttack, both primary and secondary vectors A. culicifacies and A. annularis were present, the malaria transmission dynamics in some high-endemic pockets might be dominated by A. annularis.
Apart from qualitative analysis, a real-time quantitative estimation of malaria transmission is essential for quantifying the transmission potential of individual mosquitoes infected with the parasite. This quantitative detection can further lead to accurate estimation of the risk of disease transmission. We report here a quantitative real-time polymerase chain reaction assay to determine the extent of infectivity of malaria vectors in relation to organs and geographical regions. However, how the density of plasmodial sporozoite in mosquito vectors modulates and regulates parasites survival and malaria transmission remains less clear. To our knowledge, this is the first quantitative detection of parasite density (via genome numbers) within the guts and salivary glands of female Anopheles vector species in the three different areas of Odisha. The organ-specific plasmodial parasite detection by our normal polymerase chain reaction estimated only their availability in salivary glands and guts of mosquito vectors. In Kalahandi, the percentage of gland-positive mosquitoes was found to be greater than the percentage of gut-positive mosquitoes for A. culicifacies, but no such organ selectivity by plasmodium was detected for A. annularis species. Similarly, in Bargarh, no such organ selectivity was found for either primary or secondary vectors. However, in Cuttack, only the secondary vector A. annularis was incriminated and detected with selectivity for gut plasmodia. The ultimate and appropriate method for a vector-incrimination study can be achieved through sporozoite detection – that is, detection of infective vector mosquitoes – as a few reports have shown that Plasmodium vivax plasmodial parasites in the A. culicifacies B complex grow to the oocyst stage in the gut region but do not develop into sporozoites (Adak et al. Reference Adak, Singh, Nanda, Sharma and Subbarao2006). In order to quantify the Plasmodium falciparum infection in the salivary glands and the guts of anopheline vectors, quantitative polymerase chain reaction was performed. Comparatively, we observed an increase in parasite density in salivary glands as compared to in guts of the vector mosquitoes in all three districts. Overall, our findings demonstrated that plasmodial parasite-infected vectors provided a rationale for preferential binding of sporozoites to salivary gland tissues in all three study areas. The differential expression of infectivity of oocyst sporozoite and salivary gland sporozoite may be due to the cell-surface ligands of the two stages (Wang et al. Reference Wang, Zhang, Zhao, Li, Zhang, Dragovic, Abraham and Fikrig2013; Pimenta et al. Reference Pimenta, Orfano, Bahia, Duarte, Rios-Velasquez and Melo2015). Among the three districts, the parasite density was highest in Kalahandi for A. culicifacies and in Cuttack for A. annularis. In low-endemic Cuttack, although primary vectors were not incriminated with plasmodial parasite, the secondary vector A. annularis was identified to harbour parasite in some highly endemic areas. The relationship between parasite density and infectiousness has not been properly investigated before (Churcher et al. Reference Churcher, Siden, Edwards, Poulton, Rampling and Brock2017), but our findings imply that hyper-infected mosquito vectors were the key players for this endemicity and that parasite density in vector salivary glands might impact disease transmission. Further research is needed to determine whether these findings apply to all vector mosquitoes and in other settings. Our data highlight the actual infection status in these three malariogenically stratified districts of India and will help to inform the development of new interventions that target different mosquito stages and that might help to reduce the prevalence of infective mosquitoes.
Supplementary material
To view supplementary material for this article, please visit https://doi.org/10.4039/tce.2022.1.
Acknowledgements
The authors are grateful to Dr. S. Pati, Director of Regional Medical Research Centre, Bhubaneswar, India for the study. They also extend our thanks to KIIT School of Biotechnology, KIIT University, Bhubaneswar, India.
Funding
This work was supported by a research grant from the Indian Council of Medical Research, New Delhi (6/9-7(107)/2015-ECD-II).
Conflict of interest
The authors have no conflicts of interest.