The observation that “new policies create new politics” has spawned an extensive literature on the political consequences of new policies (Pierson Reference Pierson1993; Schattschneider Reference Schattschneider1935). Empirical work investigating policy feedback effects on mass political behavior, including individual public opinion and participation in politics, is particularly rich (Beland and Schlager Reference Beland and Schlager2019; Campbell Reference Campbell2012; Mettler Reference Mettler2002). Additional research shows how policy feedback is mediated by organizations, such as interest groups, nonprofits, and labor unions (Goss Reference Goss2010; Goss, Barnes, and Rose Reference Goss, Barnes and Rose2019; Patashnik Reference Patashnik2008; Pierson Reference Pierson1993; Skocpol Reference Skocpol1992). Policies can act on organizations by providing or withdrawing resources from groups and by fostering or discouraging group formation and political orientation (Flavin and Hartney Reference Flavin and Hartney2015; Patashnik Reference Patashnik2008).
Yet the policy feedback literature has not deeply explored how the passage of new policies shapes the alignment of groups within political party coalitions. As political parties have polarized, interest groups that previously worked with both parties have more tightly aligned themselves to one party or another (Hacker and Pierson Reference Hacker and Pierson2019). Neither the extent of these shifts nor the causes are well understood, but we might wonder what role policy itself could play. New policies can impact the resources available to interest groups to participate in politics and reveal which party provides the best opportunity to advance group interests. Krimmel (Reference Krimmel2017) argues that group-party relations should be analyzed on a continuum, from low-level partisanship among interest groups to exclusive interest group relationships with one or the other political party. Building on the foundations of party coalition research and policy feedback studies, we examine whether and how the intensity of interest group and political party relationships evolve and vary over time in response to policy adoption at the state level. In other words, do policy changes shape interest group relationships with political parties in state politics?
In order to systematically examine interest group and political party alignments, we develop and test a theory of policy coalition polarization. Policy coalition polarization occurs when interest groups working in the same state and the same issue area (in this case, education) align with opposing political parties in response to new policies. As prior work on political party coalitions has shown, interest groups are key members of party coalitions, but interest groups do not always exclusively align with a single party (Karol Reference Karol2009; Krimmel Reference Krimmel2017; Reuning Reference Reuning2019). Our work explores a mechanism—policy feedback from a particularly partisan policy—that could drive interest groups toward single-party alignment with rival parties. Specifically, we examine whether partisan policy passage, meaning the policy has visible support exclusively from one party, can impact group-party relations and lead to the emergence of policy coalition polarization in state politics.
We examine policy coalition polarization using the case of state education policy. This policy area lends itself well to the study of interest group behavior across states, because it involves very similar interest groups across state lines, allowing us to track how groups with similar goals and structures align themselves with political parties in different contexts. Teachers unions have traditionally been the dominant education interest group, known for their close alignment with the Democratic Party and capacity to fill the coffers of candidates for state office and state political parties (Moe Reference Moe2011). However, new state- and national-level organizations, which we refer to as “education reform groups,” have spread across the states, advocating for school choice and accountability-oriented policies; these groups can be prolific contributors in electoral campaigns (Henig, Jacobsen, and Reckhow Reference Henig, Jacobsen and Reckhow2019). Teachers unions can no longer take their dominance for granted in state education politics.
At the same time, there are new state education policies that may have impacted the partisan positioning of education interest groups across space and time. Since the 1990s, states have adopted various school choice policies, such as charter schools and vouchers, while laws governing the labor rights of teachers have been the subject of fierce debate and legislative activity. The passage of these policies may encourage specific interest groups to align themselves more with one party or another. Indeed, Reuning (Reference Reuning2019) shows that state politics offers fertile ground for understanding the factors that could shape interest group network structures and the interactions between parties and interest groups.
We use campaign contributions from education interest groups to state-level candidates and political party committees to measure the alignment between interest groups and parties. Although campaign contributions are only one potential avenue for tracking interest group political mobilization, this type of data is particularly valuable for assessing the level of support that an interest group provides to each political party. While some interest groups may contribute to campaigns for ideological reasons and others may be motivated by access to lawmakers, we build on prior work that uses aggregate campaign contribution data as a way to assess the extent of alignment between an interest group and political parties based on the level of support the group provides to candidates in each party (Bucci and Reuning Reference Bucci and Reuning2020; Reuning Reference Reuning2019).Footnote 1 We use an original dataset that includes every contribution to candidates for state office and state political party committees from 2000 to 2017 (over 145,000 contributions and over 57,000 elections) to assess the relationship between state education policy change and education interest group alignment with parties. By leveraging variation in the political and policy contexts of the 50 states over nearly two decades, we examine how the interest group coalitions of the two political parties evolve in response to policy change.
We theorize that the interpretive feedback effects of new policies with high-profile partisan identities will lead to policy coalition polarization for education interest groups. We expect policy feedback effects for two key sets of policies: (1) labor retrenchment policies, which enact right-to-work, restrictions on collective bargaining, or limit collection and use of worker dues by unions and (2) private school choice programs, which provide government funds to attend private school, such as vouchers, tax credits, tax deductions, education savings accounts, and so on. For policies that often pass with bipartisan support, like charter schools, we do not predict the same polarization of interest groups. Using a difference-in-difference approach to compare states with the specific policy to those that will later pass the policy, we find that private school choice, but not labor retrenchment or charter laws, coincides with increased policy coalition polarization. Our findings suggest that partisan interpretive effects of new policies can spur policy feedback, and this relationship is a key ingredient for understanding interest group alignment with political parties and policy coalition polarization in state politics.
Policy Feedback and Party Coalitions
Our theory of policy coalition polarization is based on policy feedback and studies of party coalition formation. First, we consider the policy feedback mechanisms that link new policies to interest group mobilization—including resource effects and interpretive effects. Then, we explore how group level consequences of policy change would impact alignments with parties, a process we argue is mainly driven by the interpretive effects of partisan policy change on interest groups.
Based on prior research, policy feedback can impact group mobilization through resource effects (Campbell Reference Campbell2012; Goss, Barnes, and Rose Reference Goss, Barnes and Rose2019; Pierson Reference Pierson1993). Policies that distribute benefits to groups are expected to have positive resource effects, meaning these policies will increase the resources available for collective action by the group. These benefits could include resources for the groups’ constituents, which can increase their level of political participation, or more direct organizational benefits, such as subsidies or contracts that enhance organizational capacity and involvement in policy making (Flavin and Hartney Reference Flavin and Hartney2015; Mettler Reference Mettler2002). There are also policies that take benefits away or impose costs on specific groups. For example, Hertel-Fernandez (Reference Hertel-Fernandez2018) explains that labor rollbacks could be described as policy feedback as a “political weapon,” since they are usually meant to politically weaken public sector unions. Resource effects play an important role in policy feedback processes, and empirically assessing resource effects can help establish a link between a policy change and the political behavior of groups. In our analysis, we test for resource effects; however, we do not expect that resource effects will be the key driver of interest group alignment with parties or policy coalition polarization. We see resource effects as a signal that a particular policy change is impacting group mobilization, although resource effects are not a sufficient condition for changing interest group alignment with political parties.
We expect that changes in the alignment of interest groups and parties in state education politics will be driven by interpretive effects of policy enactment. Interest groups may have good reasons to remain unaligned with a political party; for example, it can be politically costly for a group to be exclusively aligned with a party that ends up in the governing minority. Yet the calculus of group alignment with political parties could change if one party becomes a key champion—or staunch opponent—of the group’s interests. According to Pierson (Reference Pierson1993), policy changes can have powerful interpretive effects. We argue that group alignment with a particular political party depends on the interpretive effects of new policies. After the policy change, does the interest group come to see one political party as a champion of its interests?
The protracted federal debates over civil rights and anti-lynching bills, which culminated in the National Association for the Advancement of Colored People (NAACP) aligning with the Democratic Party by the middle of the 20th century, shed some light on the interpretive effects of new policies for interest groups and party alignment. As Francis (Reference Francis2014) explains, in the 1920s, the NAACP worked closely with congressional allies in the Republican Party to advance anti-lynching legislation in Congress. However, after a victory for the Dyer Anti-Lynching Bill in the House of Representatives in 1922, the Republican leadership in the Senate folded under the pressure of a filibuster from Southern Democrats (Francis Reference Francis2014). The NAACP tried to remain officially nonpartisan through the 1930s and early 1940s, seeing neither party as a loyal ally to African-Americans (Topping Reference Topping2004). From the organization’s standpoint, the interpretive effects of policy changes in this era did not demonstrate that either party was prepared to sacrifice the support of its conservative wing on behalf of civil rights. Yet by the late 1940s, the Democratic Party became increasingly responsive to the issues promoted by the NAACP; the 1948 Democratic Party platform’s civil rights plank and President Truman’s executive order to desegregate the armed forces signalled new substantive commitments by the Democratic Party, even though many promises on civil rights still went unfulfilled (Baylor Reference Baylor2013; Schickler, Pearson, and Feinstein Reference Schickler, Pearson and Feinstein2010). As Topping (Reference Topping2004) observes, by 1948 “strict nonpartisanship was becoming more and more difficult” for the NAACP. Although there are many complex issues involved in the partisan realignment over civil rights, the NAACP example draws attention to the interpretive effects of policy change as a mediating factor between interest groups and political parties.
Thus, we expect that the interpretive effects of policy changes will shape group alignments with party coalitions. When the interpretive effects of a policy change show that one political party was instrumental for supporting group benefits, we expect group-party alignment to grow stronger. Similarly, when a party promotes a policy that takes away resources from a group, we expect the group to respond defensively by increasing their alignment with the opposing party. Finally, we expect that policy coalition polarization will grow as more groups are mobilized by policy changes that have partisan interpretive effects.
What kinds of interpretive effects do we expect from education-related policy changes at the state level? Two sets of policies that distribute resources to and from education interest groups, but vary in the degree to which they are identified with one party or another, are school choice policies (including charter schools and private school choice policies) and labor retrenchment policies, which take away existing labor rights for teachers unions.
Both charter policies and private school choice policies make it possible for families to send their children to schools that are not operated by traditional public school districts. They also distribute resources to nonprofit and for-profit organizations that operate choice schools. Thus, through resource effects, school choice policies could foster mobilization of education reform groups working with or representing such school organizations, increasing their involvement in political campaigns.
At the same time, they might decrease the mobilization of teachers unions. According to Moe (Reference Moe2001), private school vouchers “create problems of gargantuan proportions for the teachers unions, which would lose members, collect less in dues, and find themselves forced to operate in a newly competitive environment that makes their organizing tasks far more difficult.” Charter school policies could also reduce union resources, because they can “draw money and kids away from the regular public schools where union members teach, and their teachers need not be part of the district collective-bargaining contract” (Moe Reference Moe and Hill2002).
However, we expect different interpretive effects for charter school policies and private school choice policies. Private school choice policies are more closely associated with the Republican Party (Hackett and King Reference Hackett and King2019). Ideology is a strong predictor of vote choice on voucher initiatives, and conservatives are more supportive (Bali Reference Bali2008). In half of the 14 states that adopted their first private school choice policies from 2000 to 2017 and for which we were able to gather roll call data, private school choice bills passed with less than 5% support from Democrats in the legislature. Meanwhile, the average level of support from Republicans, based on roll call votes, was 89%; four bills passed with unanimous Republican support. Therefore, we anticipate that where such policies pass, partisan interpretive effects will be activated: many education reform groups will interpret that Republicans are their partisan allies, while teachers unions will interpret them as their enemies, leading them to support Democrats more than they were before. With both types of groups increasingly supporting opposing parties, the passage of such policies would lead to policy coalition polarization.
By comparison, charter school policies tend to draw a greater level of bipartisan support (Mintrom Reference Mintrom1997; Wolbrecht and Hartney Reference Wolbrecht and Hartney2014). We could not gather data on nearly as many roll call votes for state charter school legislation, because so many bills were adopted before 2005, making the roll call vote data more challenging to find. We did find data on roll call votes for charter bills in four states, and two of the states (Maine and Maryland) passed charter policies with considerable bipartisan support; the other two (Alabama and Kentucky) passed with mostly Republican support. Yet the history of charter school policies in the states points to high levels of bipartisanship in promoting charter schools. The first charter school policy, passed in Minnesota in 1991, was drafted by a Democrat and relied on compromise between school choice advocates and unions (Schroeder Reference Schroeder2004). An analysis of state policy adoption of charter legislation from 1991 to 1999 shows that political factors such as Republican control of the state legislature and the partisanship of the governor are not significant in predicting which states adopted charter school policies (Renzulli and Roscigno Reference Renzulli and Roscigno2005). Thus, Renzulli and Roscigno (Reference Renzulli and Roscigno2005) explain that charter policies “have often taken on a bipartisan character” (358). Therefore, we do not expect a partisan interpretive effect for charter school policies.
Another policy that could impact education interest groups and generate policy coalition polarization is labor retrenchment. Following the Republican gains in many state legislatures in the last decade, policies to limit public sector collective bargaining and union power began to spread (Freeman and Han Reference Freeman and Han2012; Hertel-Fernandez Reference Hertel-Fernandez2018). For example, supporters of right-to-work legislation in Michigan hoped to use the policy to weaken the powerful state teachers union—the Michigan Education Association (MEA) (Kaminski Reference Kaminski2015). Thus, we expect partisan interpretive effects from labor retrenchment policy changes; teachers unions’ historical alignment with the Democratic Party, which does not support such policies, may become even stronger as legislatures adopt labor retrenchment policies. This would be a defensive shift intended to punish Republicans, who support labor retrenchment policies. This increased focus on Democrats would lead to increased policy coalition polarization, even if retrenchment does not impact reform groups’ alliances, since teachers unions would be shifting away from the Republicans they may have previously supported.
To summarize, we expect policy feedback effects will increase interest group alignment with a single party and increase policy coalition polarization when the interpretive effects of policy change are partisan. First, we expect partisan interpretive effects to occur for private school choice policies (but not for charter school policies)—driving reform groups toward Republicans and unions toward Democrats. Second, we expect labor retrenchment policies to have partisan interpretive effects—driving unions to be even more closely aligned with Democrats. Thus, we should see policy coalition polarization where states pass private school choice or labor retrenchment.
Campaign Contribution Data
In order to explore how new policies shape the involvement and alignment of education interest groups with political parties across states, we undertake two analyses. First, we use campaign contribution data from the National Institute on Money in Politics (followthemoney.org) to descriptively track policy coalitions over time. Second, in order to explain these trends, we use a difference-in-difference approach to test whether increased education interest group campaign spending and policy coalition polarization, both measured with campaign contributions, can be attributed to school choice or labor retrenchment policies.
As campaign contribution data have become easily accessible through online sources, such data are increasingly being used to map party networks (Grossmann and Dominguez Reference Grossmann and Casey2009; Reuning Reference Reuning2019). Additionally, they are a good measure of an interest group’s support for a political party since interest groups contribute to sympathetic allies (Hall and Wayman Reference Hall and Wayman1990), and there is evidence that they reward allies for votes and withhold contributions from allies that defect (Engel and Jackson Reference Engel and Jackson1998). Campaign contribution data provide detailed information on the timing and amount of funds provided by organizations to candidates for state office as well as state party organizations (which in turn, support candidates). Unions largely rely on dues that come from their membership to provide resources for funding political campaigns, although they also rely on separate political action committee (PAC) donations from members, while education reform organizations often lack dues paying members, so their funding comes from other sources. Donations to these organizations are sometimes not visible, particularly for those with 501(c)(4) status, but prior research indicates that wealthy education philanthropists such as Eli Broad, Reed Hastings, Michael Bloomberg, and Laurene Powell Jobs are key contributors to education reform organizations that are involved in politics (Henig, Jacobsen, and Reckhow Reference Henig, Jacobsen and Reckhow2019).
The campaign contribution data contain each donation from an organization to a campaign or committee, including information about the partisan affiliation of the recipient. With these data, we can examine the extent of policy coalition polarization across states from 2000 to 2017, with particular attention to the different trajectories of education interest groups.
Policy Coalitions Across States Over Time
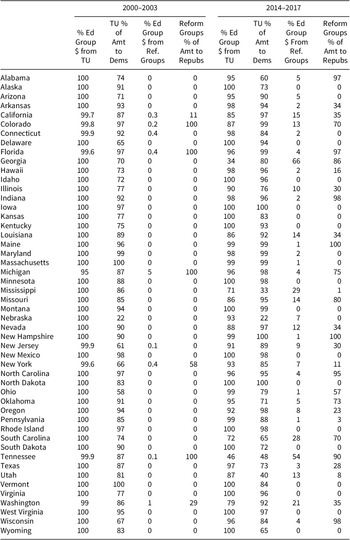
We first track how contributions from education interest groups have changed over time in terms of both magnitude and partisan polarization. We aggregate contribution data from 2000 to 2003 and from 2014 to 2017 to show how the breakdown of education interest group contributions has shifted. Table 1 displays these trends. The first column in each time period lists the percent of all education interest group donations that came from teachers unions. At the start of the 2000s, the vast majority of dollars came from teachers unions; only eight states had any reform group involvement at all, and for those states, the vast majority of funds from education interest groups came from teachers unions. By 2014–2017, however, there was a notable shift, with reform groups contributing to state-level campaigns in 34 states.Footnote 2
Change in the origin of education interest group contributions and their partisan destinations

Which parties benefited from these contributions?Footnote 3 Democrats received the bulk of teachers union funds in both periods, and unions increased their support for Democrats dramatically in some states (Wisconsin, Washington, Virginia, Ohio, New Jersey, Kentucky, and Idaho). Meanwhile, other unions bucked the general trend and began giving the majority of their funds to Republicans (Utah, Tennessee, Mississippi, and Georgia). The rest remained relatively stable. Reform groups were hardly present in electoral politics at the start of the 2000s. By 2014–2017, however, reform groups varied dramatically in the degree to which they supported the two parties. Of the 34 states where they made contributions, 15 states saw the majority of reform group donations go to Republicans.
In order to dig deeper into these trends and begin considering the potential role of policy, we next create networks of campaign contributions in 2000 and 2016 from education interest groups in Tennessee and Wisconsin. These two years provide bookends for the time frame of our dataset, and these two states provide snapshots of the changes that have emerged in the levels of support that different types of education interest groups provide to Democratic and Republican political campaigns and party organizations. Each of the states offers a different context for policy changes involving school choice and labor retrenchment.Footnote 4
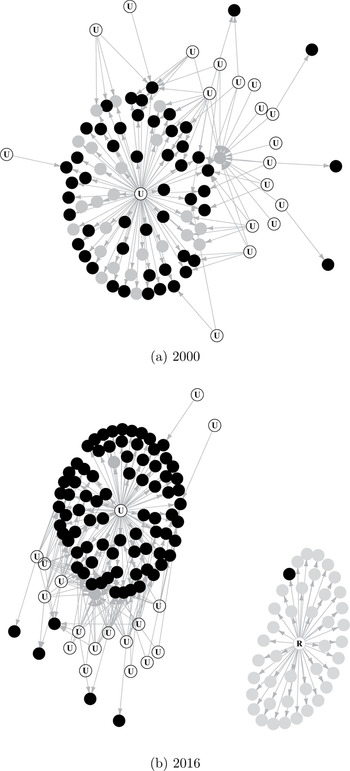
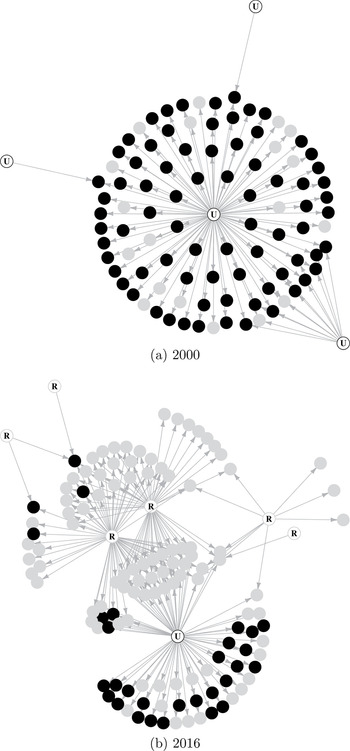
The networks are displayed in Figures 1 and 2. The contributing organizations (unions and education reform groups) are represented with white circles (nodes); unions are labeled “U” and have a black circle outline, and reform organizations are labeled “R” and have a gray outline. The lines and arrows show a contribution from a union or reform organization to a candidate or party committee that received funds from that organization in that election year. The recipient candidates and committees are represented with black nodes (Democrats), light gray nodes (Republicans), and dark gray nodes (Third-Party and Independents).Footnote 5
Wisconsin contribution networks.
Note. Black circles represent Democrats. The lightest gray circles represent Republicans. Darker gray circles are third-party and nonpartisan candidates. “U” are teachers unions and “R” are reformers.

Tennessee contribution networks.
Note. Black circles represent Democrats. The lightest gray circles represent Republicans. Darker gray circles are third-party and nonpartisan candidates. “U” are teachers unions and “R” are reformers.

The networks show both similarities and differences in the levels of support from interest groups for opposing political parties across these states, consistent with the variation displayed in Table 1. Figure 1 displays interest group contributions in Wisconsin, a state that rolled back labor rights in 2011 and passed private school choice in 2013. If resource effects from these two policies are occurring, we should see an increase in reform group contributions and a decrease in teachers union contributions, meaning the number of arrows coming from U or R circles. While there are not fewer teachers union contributions, we do see an increase in reform group contributions; there were no reform group contributions in 2000, and by 2016, the American Federation for Children, a group which advocates heavily for private school choice, was very involved in the state.
If interpretive feedback effects are kicking in, with private school choice pushing reformers toward Republicans and both policies pushing teachers unions toward Democrats, we should see fewer bipartisan contributions from both types of groups. Indeed, while the teachers unions had a bipartisan contribution profile in 2000, by 2016, Wisconsin education unions supported no Republicans. Overall, teachers unions in Wisconsin went from supporting 37 Republican candidates from 2000 to 2010 to funding only 1 Republican from 2011 onward. Meanwhile, reform organizations in Wisconsin threw nearly all of their support to Republicans. The American Federation for Children, the main reform group in the state, shows a clear shift. From 2010 to 2012 (years not displayed in our networks), the group funded similar numbers of Democrats and Republicans, supporting eight Democratic candidates, seven Republicans, and one third-party candidate. Starting in 2013, the year the state passed a private school choice law, their independent expenditures primarily benefited Republicans. The 2016 network in Figure 1 represents this policy coalition polarization visually: there is no overlap in the overwhelmingly Republican candidates supported by the main reform organization involved in Wisconsin and the overwhelmingly Democratic candidates funded by the unions.
Figure 2 displays the networks for Tennessee. The Tennessee legislature passed a charter law in 2002 and restricted teachers’ labor rights in 2011. If these policies had resources effects on the groups, there would be more reform group and fewer teachers union contributions. As with Wisconsin, while we see an increase in reform group contributions, we do not see a decrease in teachers union contributions, contrary to our expectations. However, we do find support for interpretive feedback, with increasing coalition polarization over time. Reform organizations and unions both supported a mix of candidates from each party in 2016, but unions supported more Democrats and reformers mostly supported Republicans. In Tennessee, like in Wisconsin, this involved a shift in the beneficiaries of reform groups’ contributions; the reform group Stand for Children, for example, gave 60% of its contributions to Republicans prior to 2011, but from that year on, 79% went to Republicans.Footnote 6 Teachers unions, interestingly, shifted to supporting more Republicans over time, giving the majority of their contributions to Republicans starting in 2014.
These data make clear, first, that teachers unions have long supported Democrats, although there are exceptions. Second, resource effects from school choice policies may be encouraging higher levels of reform group involvement in elections during this time period. Third, some states have experienced the emergence of intense policy coalition polarization in education, with reform groups allying with Republicans while teachers unions stuck by Democrats. However, these are only suggestive cases; we now turn to a more systematic examination of these possibilities.
How Policies Drive Policy Coalition Polarization
In this section, we look at whether private school choice, charter school laws, and labor retrenchment policies impact education groups’ electoral involvement and whether that involvement is focused on one party or another. We then assess whether those two types of policies are related to policy coalition polarization.
We have three dependent variables. To capture resource effects, we look at the electoral mobilization of each type of group, which we operationalize with the share of all candidates for state offices that received funding from each group type. To capture interpretive effects, we examine the degree of partisan alignment of each type of group and a single measure of overall policy coalition polarization. We operationalize alignment with the share of teachers union or reform group contributions that went to Democrats (for teachers unions) and Republicans (for reform groups).Footnote 7 To measure policy coalition polarization, we use the following formula:
 $$ {\displaystyle \begin{array}{c}\mathrm{Policy}\ \mathrm{Coalition}\ \mathrm{Polarization}\hskip0.5em =\\ {}\hskip0.5em \mid \mathrm{Proportion}\ \mathrm{of}\ \mathrm{reform}\ \mathrm{group}\ \mathrm{donations}\ \mathrm{to}\ \mathrm{Republicans}\\ {}-\mathrm{Proportion}\ \mathrm{of}\ \mathrm{teachers}\ \mathrm{union}\ \mathrm{donations}\ \mathrm{to}\ \mathrm{Republicans}\mid \end{array}} $$
In other words, our policy coalition polarization variable is a measure of the degree of overlap in the share of each side’s funding that goes to Republicans. No overlap (polarization = 1) means complete polarization with the two sides in different party coalitions and vice versa (polarization = 0). We calculate polarization in terms of the number of candidates funded, rather than number of dollars provided.Footnote
8 To account for off-year elections across states, we calculate all three dependent variables pooling data from year
 $ t $
as well as
 $ t-1 $
. In all cases, we use campaign contributions, not independent expenditures.Footnote
9
The challenge with identifying the effect of policy adoption on electoral involvement is that there may be factors associated with policy change that also predict increases in the number of candidates supported by education interest groups. For example, if a state was particularly free market-oriented in its political culture and policies, reformers might target the state, knowing it may be amenable to market-oriented education reforms. In such a context, we might expect school choice policies to pass and reform groups to increase their contributions, but the former would not necessarily have caused the latter. In order to get around this challenge, we use a generalized difference-in-difference approach leveraging variation in the timing of policy passage across states. As we focus on the specific timing of policy change for our empirical models, we use the term “policy passage” to denote the moment or timing when a relevant bill is passed at the state level. We examine the impact of policies passed from 1999 to 2015 in all 50 states. This approach uses the states that never passed the policy, as well as the state-years prior to passage for those states that will eventually pass it, as the comparison group for states with the policy, while taking into account both fixed state factors (like political culture) and year-specific factors.Footnote 10 More formally, we use the following equation:
 $$ {Y}_{s,y}=\alpha +\beta {Policy}_{s,y-1}+\theta {\mathbf{X}}_{s,y-1}+{\delta}_y+{\gamma}_s+{\varepsilon}_{s,y}. $$
The dependent variables (
 $ {Y}_{s,y} $
) are two-year rolling averages of policy coalition polarization, partisan alignment, and electoral mobilization, starting with contributions during 2000–2001Footnote
11 and going to 2016–2017.
 $ {Policy}_{s,y-1} $
indicates whether the state,
 $ s $
, is in the treatment group, meaning it has passed the particular policy of interest. This variable is lagged one year (
 $ y-1 $
), meaning we examine the impact of a policy passed in 1999 on contributions spent in 2000–2001 and so on. The coefficient
 $ \beta $
gives an estimate of the effect of passing the indicated policy. Our policies of interest are whether the state passes private school choice, a law allowing charter schools, or a law restricting labor rights for teachers unions. The private school choice variable captures the existence of any type of public funding to attend private school, including vouchers, tax credits, tax deductions, education savings accounts, and so on.Footnote
12
 $ {\mathbf{X}}_{s,y-1} $
are lagged controls for Republican legislative controlFootnote
13 and teachers union membership ratesFootnote
14 to account for the strength of teachers unions.Footnote
15 Lastly,
 $ {\delta}_y $
and
 $ {\gamma}_s $
are year and state fixed effects.Footnote
16
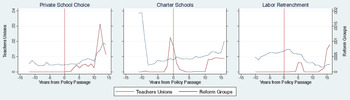
Figure 3 displays the median share of each education interest group type’s four-year average campaign contributions in the years before and after the passage of the three policies.Footnote 17 If private school choice policies and charter school laws have resource effects that increase the funds that education reform groups spend on politics, we would see the median share of campaign contributions increase following the passage of each law. And if the same policies decrease the resources available to teachers unions, we would see a decrease in campaign contributions. We only see evidence of resource effects for one of the two school choice policies—private school choice. The figures suggest a sustained increase in reform group contributions where private school choice laws pass. For reform groups and charter laws, we do not find evidence for our expectations; the groups were giving more prior to law passage than in the years immediately afterward. Teachers unions do not experience the predicted negative resource effects for either charter school laws or private school choice, if anything increasing spending slightly over time. For labor retrenchment, we find evidence of negative resource effects for teachers unions, as expected. Figure 3 indeed shows a long-term dip in contributions from teachers unions where states pass labor retrenchment. The figure shows some initial support for our resource effect expectations for reform groups where private school choice passes and for teachers unions where retrenchment passes. This suggests that policy feedback may be occurring.
Median share of campaign contribution dollars from time of policy passage.

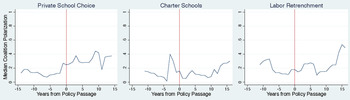
We examine interpretive effects in Figure 4, which displays the median policy coalition polarization measure leading up to and after policy passage for states that passed the indicated policy from 1999 to 2015.Footnote 18 We expect private school choice to cause reform groups to devote a higher share of their campaign contributions to Republican candidates while teachers unions spend more on Democrats. For labor retrenchment, this polarization would be driven primarily through the actions of teachers unions. If this is in fact occurring for private school choice and retrenchment, we should see our measure of polarization increase after policy passage. Figure 4 provides suggestive visual evidence that this may be occurring for these two policies. For charters, we do not expect interpretive feedback to be activated, since it has been a more bipartisan policy, and, indeed, our measure of polarization does not clearly increase in the figure in the years following policy passage, though there may be an increase in the longterm.
Median policy coalition polarization from time of policy passage.

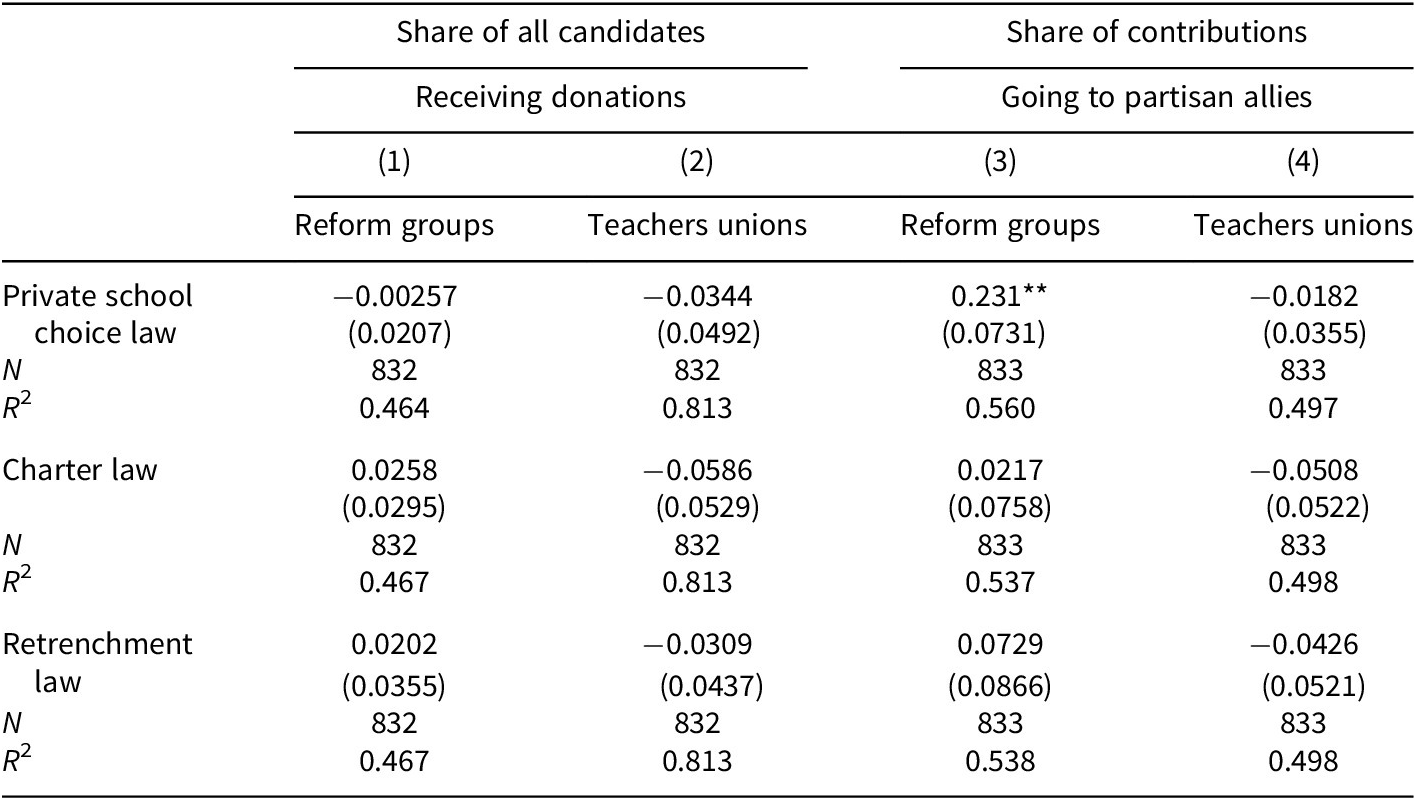
Table 2 displays the results when we examine the causal effect of each policy on education interest group electoral mobilization and partisan alignment. The first row in each panel displays the estimated effect of each policy. Across the three policies, the only one for which we find a statistically significant result is private school choice and reform group contributions to Republicans; states with private school choice policies see reform groups support a larger share of Republicans (23.1 percentage points more), relative to those states that will later pass such policies. This result is robust to using the share of dollars going to Republicans, rather than the share of candidates funded that are Republicans (See Supplementary Appendix Table A5), as well as specifications that include independent expenditures (See Supplementary Appendix Table A6). The results are also robust to specifications that instead use first differences, where the dependent variable is the change in the outcome variables and the explanatory variable is policy passage.Footnote 19 Interestingly, the results in columns 1 and 2 do not support a resource effect for private school choice policies, against our prediction.
Impact of policy passage on share of all candidates funded and share going to partisan allies

Standard errors clustered by state in parentheses. In columns 3 and 4, the dependent variables are the percent of candidates supported that are Republicans, for reformers, and percent that are Democrats, for teacher’s unions. All models include state and year fixed effects and control for National Education Association (NEA) membership rates and Republican-controlled legislatures. All covariates are lagged one year.
† p < 0.1.
∗ p < 0.05.
∗∗ p < 0.01.
∗∗∗ p < 0.001.
The second panel provides the results for charter laws. The positive sign for reform group contributions (column 1) and the negative sign for teachers union contributions (column 2) are consistent with our theory that these policies may have a positive resource effect on reform groups and a negative effect on teachers unions. However, the coefficients are not statistically significant, and we cannot reject that charter laws are unrelated to increases in mobilization for both types of education interest groups. That said, many charter laws passed in the 1990s. It may be that because the nine states passing charter laws from 1999 on were relative latecomers, the effect was less pronounced than for the first group of states. In contrast, for labor retrenchment and private school choice, the bulk of the modern initiatives occurred since 1999.Footnote 20 We also fail to find an effect of charter school laws on partisan alignment (columns 3 and 4). This is consistent with our theory that charter laws fail to activate interpretive effects because of the more bipartisan nature of these bills. However, it may be that our time period is simply too late for a charter effect.
We also do not find effects for retrenchment. That said, it may be that the effect is delayed. This is suggested by Figure 3, which shows that teachers union campaign contribution dollars initially increase and then fall over time. When we increase the policy passage lag to test for this, there is no effect when the dependent variable is the share of candidates funded. However, when the dependent variable is the share of all campaign contributions coming from teachers unions, the effect of retrenchment becomes statistically significant at the 0.1 level after four years and the strength of the effect increases over time. These results are displayed in Supplementary Table A8. This is suggestive of a lagged resource effect of retrenchment on teachers union campaign contributions.
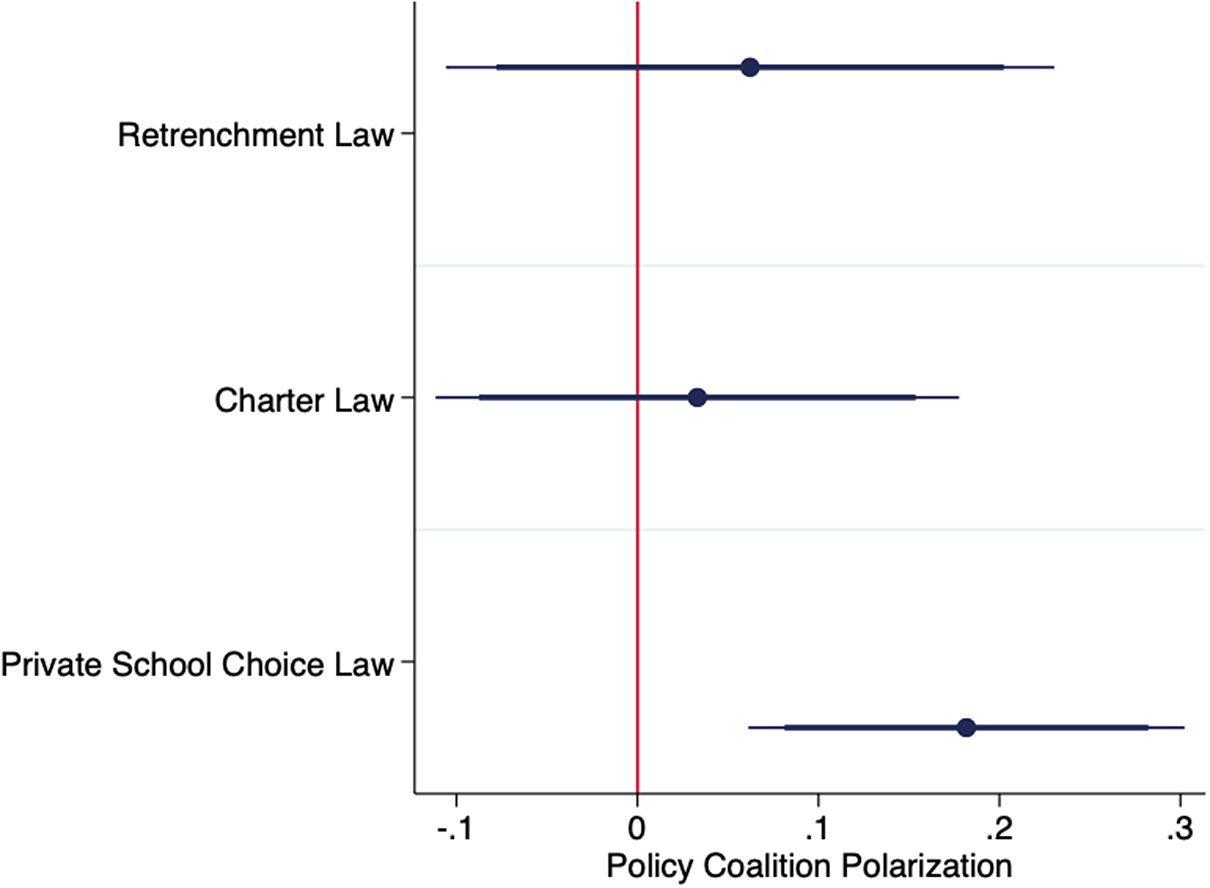
We also examine how these policies impact the growth of policy coalition polarization, using the measure defined above. Figure 5 displays the results.Footnote 21 It shows that the passage of private school choice policies leads to greater increases in policy coalition polarization relative to states without private school choice policies. Where such policies have passed, policy coalition polarization increases by 18.2 percentage points. This, combined with the results in Table 2, suggests that private school choice increases the growth of polarization by increased reformer support for Republicans. Neither of the other policies is related to higher levels of policy coalition polarization.
Impact of policy passage on policy coalition polarization in candidates funded.
Note. Each coefficient is from a separate model. Coefficients displayed with 95% and 90% confidence intervals. All models control for National Education Association (NEA) membership rates and Republican-controlled legislatures.

As an extension of our private school choice results, we also explore whether education interest group mobilization, partisan alignment, and policy coalition polarization are related to increases in the number of school choice policies. If policy feedback is being activated and our policy coalition polarization theory is correct, where there are more private school choice programs, teachers unions would give more to Democrats and would also give to fewer candidates generally, due to having fewer resources to participate in politics. For reform groups, the opposite would occur; the groups would give more to Republicans and would give more to more candidates since they would have additional resources from newly enacted programs. These effects would increase with each additional program. To test whether this is the case, we carry out specifications using the following formula:
 $$ {Y}_{s,y}=\alpha +{\beta}_1 Numberof\mathit{\Pr}{ograms}_{s,y-1}+\theta {\mathbf{X}}_{s,y-1}+{\delta}_y+{\gamma}_s+{\varepsilon}_{s,y} $$
Number of Programs is an ordinal variable for whether the state has 0, 1, 2, or 3 or more private school choice programs.Footnote 22 The dependent variables and other covariates are the same as above.
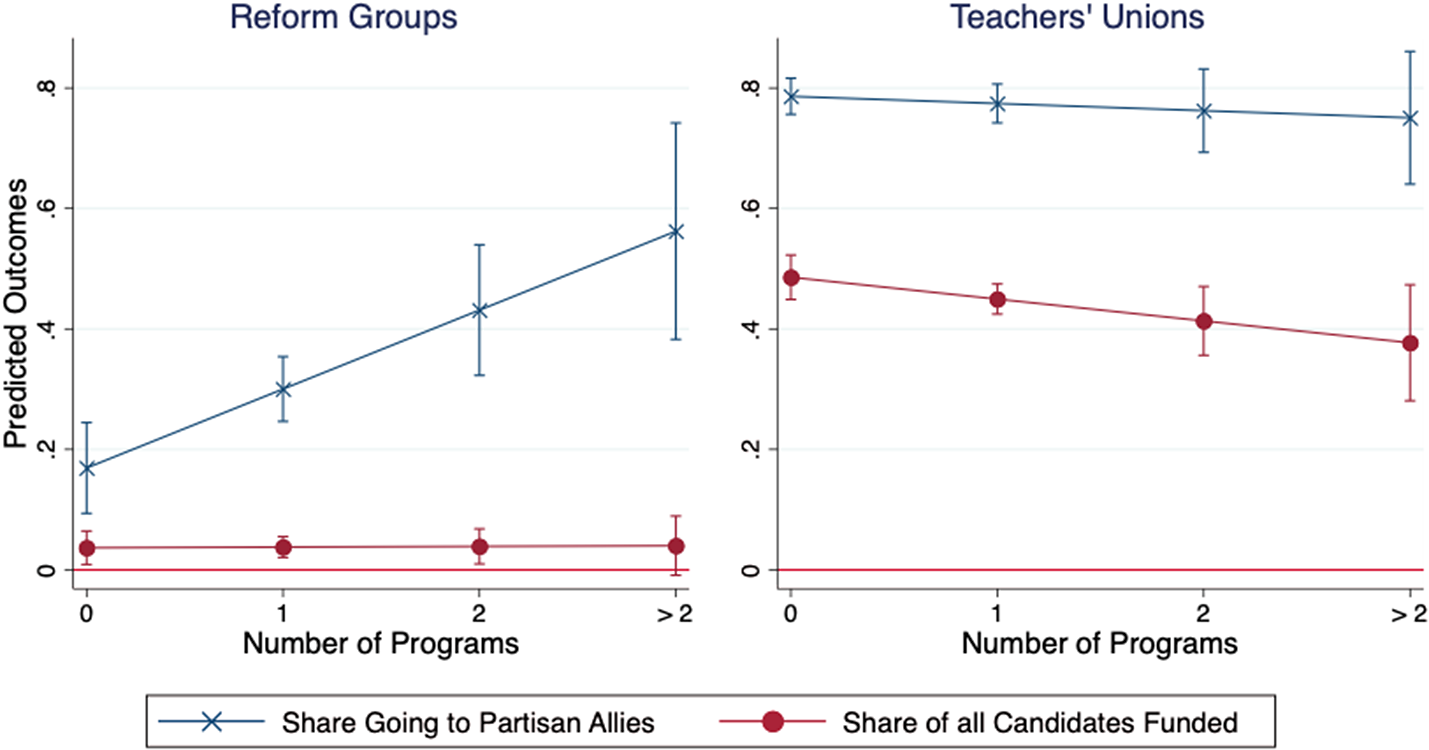
Figure 6 displays the relationship between interest group involvement in funding campaigns, as well as partisan alignment, and the number of private school choice programs in the state. The panels show how the outcome changes as the number of programs increases. The lefthand side shows a positive, statistically significant relationship between the number of programs and the share of reform group contributions going to Republican candidates. Each additional program is associated with reform groups increasing the share of Republican candidates they fund by 13.1 percentage points. However, there is no relationship between the share of all candidates funded by reform groups and the number of programs in a state. This is consistent with our main results; the number of private school choice policies is related to partisan alignment, but not the share of candidates funded.
Relationship between the number of private school choice programs on various interest group outcomes.
Note. Linear predictions taken holding Republican-controlled legislature at 1, with all other controls at their means. Coefficients with the same marker are from the same model. Coefficients displayed with 95% confidence intervals.

The right side of Figure 6 displays the results for teachers unions. Here, there is no relationship between the share of contributions going to Democrats and the number of school choice programs—teachers unions are funding a high number of Democrats regardless of the number of private school choice programs. However, there is a slight negative relationship between the share of all candidates funded by teachers unions and the number of private school choice programs, although this coefficient is statistically significant only at the 10% level. An additional school choice program is associated with teachers unions decreasing their funding for state candidates by 3.6 percentage points. This supports our expectation that private school choice programs may have an adverse resource effect on teachers unions.
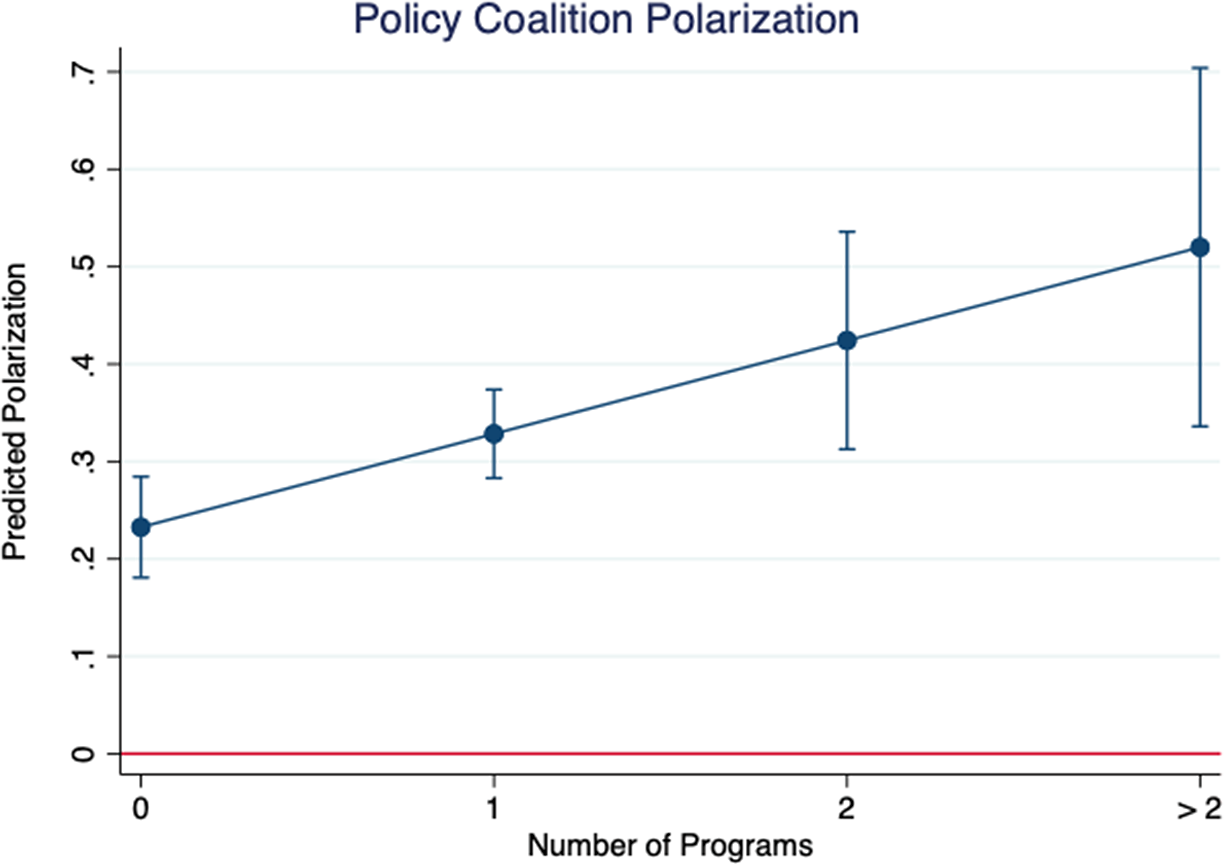
Figure 7 displays the results for policy coalition polarization. It shows that as the number of private school choice programs increase, polarization also increases. An additional program is associated with a 9.6 percentage point increase in our policy coalition polarization measure. The results in the prior figure suggest that this is being driven by changes in the partisanship of reform group donation recipients toward more Republican support. This, again, is supportive of an interpretive effect of private school choice.
Impact of the number of private school choice programs on policy coalition polarization.
Note. Linear predictions taken holding Republican-controlled legislature at 1, with all other controls at their means. Coefficients with the same marker are from the same model. Coefficients displayed with 95% confidence intervals.

Conclusion
Our findings build on and extend policy feedback research by showing that policy change can impact the polarization of interest groups. The United States is experiencing increasing partisan polarization in all facets of society. Yet the extent to which these trends have spread to interest groups has received less attention. We might ask whether politicized, partisan policy changes are related to these developments. We provide evidence that they are, at least within education policy.
We show that state policy passage impacts the alignment of education interest groups. Although teachers unions maintain a large role in state campaigns, unions no longer monopolize state-level campaign funding from education groups as they did in 2000. While education reform organizations in some states are central and significant supporters of Republicans and teachers unions align heavily with Democrats, other states feature far more muddled and bipartisan alignments of unions, reform organizations, or both. We show that some of these variations are associated with new state-level policies. Policy feedback—which impacts the resources and mobilization of organizations in politics—can also reshape the alignment and involvement of interest groups within party networks. We find that policy feedback from private school choice policies results in greater policy coalition polarization of education interest groups. Within the states that passed private school choice policies, education reform groups significantly increased their campaign funding for Republicans, and the policy coalition polarization between reform groups (aligning with Republicans) and unions (aligning with Democrats) grew. Interestingly, we did not find support for resource effects. This does not mean that policy feedback is not occurring. It simply may be that private school choice is not increasing the funds spent on political participation, even if it has a polarizing effect on their allocation.
We predict that this coalition polarization will endure as private school choice policies build larger constituencies of families, providers, and advocates over time, and these policies maintain a highly partisan identification (especially after the high profile advocacy of former Secretary of Education Betsy DeVos). More broadly, where polarization-producing policies maintain their partisan identification over time and expand their constituencies, we expect that policy coalition polarization will continue and perhaps become stronger. That said, if long-term implementation normalizes and removes the partisan affiliation of policies, perhaps because it is no longer a policy focus for either political party, interest groups may not feel the need to devote resources exclusively to one party as a way to protect or combat the policy, decreasing coalition polarization. Put differently, we predict that the endurance of policy coalition polarization will hinge on the nature of the interpretive policy feedback generated by the policy over time.
As to the other partisan policy we examine, labor retrenchment, we do not find that it is associated with either reduced mobilization of teachers unions or coalition polarization. That said, we find suggestive evidence that teachers unions decrease their contributions over time. It may be that teachers unions increase their contributions in anticipation of such policies, keep them high immediately following the policies to combat them, and then reduce mobilization over time as they lose resources. This would explain why we do not find a resource effect in our main analysis, but do find a lagged effect. As to interpretive effects, it may be that we fail to find an effect because, although they tended to support some Republicans at the start of the time period, teachers unions were already quite allied with Democrats, leaving little room for increases in alignment. Grumbach (Reference Grumbach2018) shows that there is variation in the extent that Republican and Democrat-controlled states have polarized in terms of their policies (e.g., the severity of abortion restrictions, the decriminalization of drugs, etc.), with most policies becoming polarized across states over time, while a couple, including education, have not. However, Grumbach finds that labor policy is highly polarized, with considerable divergence in policy adoption between Republican-controlled and Democratic-controlled states. Based on Grumbach’s findings, it could be the case that a greater level of policy coalition polarization already existed for labor policy, making it less likely that we would observe significant increases in polarization during the time frame in our study.
Furthermore, in 2018 the Supreme Court ruled in Janus v. AFSCME that union fees in the public sector violate the right to free speech. As a result, public employee unions in 22 states that still allowed agency fees are not guaranteed this source of revenue from nonmembers anymore. Thus, Janus makes “right to work” applicable to all public sector workers, including public school teachers who are represented by unions. Public sector unions are anticipating losses in membership and revenues. It is too early to empirically assess the consequences of this change for teachers unions in state politics, but we can consider some potential implications based on recent research. Finger and Hartney (Reference Finger and Hartney2021) show that the National Education Association (NEA) has traditionally subsidized campaign spending in states with labor retrenchment policies, since union affiliates in those states had fewer resources available for campaign spending. In other words, the NEA redistributes funds from strong labor states to weak labor states. Based on this finding, Finger and Hartney argue that “Janus will make it much more difficult to support those affiliates that have always struggled, even if they do not experience a policy change as a result of Janus, thus leading to weaker organizations as a whole” (13). If teachers unions become weaker overall, this may accelerate the decline of teacher union dominance in campaign contributions in even more states.
Our findings also suggest opportunities for further research on the relationship between policy feedback and policy coalition polarization in other policy issue areas. Existing research has examined how the passage of policies spur beneficiaries to mobilize (Campbell Reference Campbell2012) or increase their civic engagement (Mettler Reference Mettler2002). This study suggests that policies can also influence interest group alignments with political parties. Reuning (Reference Reuning2019) has shown that partisan polarization and interest group positions are important aspects of party networks based on campaign contributions, and these networks vary by state and over time. There is also variation in policies across states within the same policy issues (Grumbach Reference Grumbach2018), and this could explain increasing coalition polarization in the party networks of states where partisan policies are enacted. Key state-level issue areas such as environmental policy, criminal justice, and social welfare could also offer ways to explore the relationship between state policy passage and the partisan alignment of interest groups.
Interestingly, Grumbach (Reference Grumbach2018) specifically highlights two policy areas where outcomes were less polarized: education and criminal justice. Based on our findings for education, we anticipate that criminal justice would be a useful issue area for extending our work to examine future developments. Recent events in the area of police reform may prove illuminating. Following the murder of George Floyd by police officer Derek Chauvin in May 2020 and the expanding Black Lives Matter protest movement, several states passed new bills restricting police use of chokeholds, requiring more transparency when there is use of force, or providing more sensitivity training. These bills were passed with high profile support from both Republicans and Democrats on the national stage. States passing bipartisan police reform during the summer of 2020 include Colorado, Delaware, Iowa, Pennsylvania, and New York. Police unions, who oppose these changes in many of these states, tend to support both Democrats and Republicans, but they support more Republicans than other public sector unions (Wade Reference Wade2018). If the recent bills had a less bipartisan identification, we might have anticipated interpretive effects on the part of police unions, who might have further allied with Republicans. With bipartisan support, however, there is not a clear party to target for the policy.
That said, future police reform could create policy coalition polarization. The movement against police brutality has continued, and there are demands for more systematic reforms, such as redirecting funding away from police toward mental health and social workers. While Democrats are not in full agreement on proposals to “Defund the Police,” such calls have nevertheless been associated with Democrats (Aleem Reference Aleem2020). If these more partisan reforms pass, such policies could send police unions further into the arms of Republicans, as police unions come to see Republicans as their primary champions. Moreover, if such changes defund police enough to make a dent in police union membership, this could lead to resource effects too, weakening the ability of police unions to mobilize politically. In this scenario, the criminal justice movement, which has been quite bipartisan in recent years (Dagan and Teles Reference Dagan and Teles2016), may also become more partisan, if the conservatives in the reform coalition abandon efforts perceived to be too extreme and reformers rally around Democrats as their primary champions. Together, these trends would generate policy coalition polarization.
Overall, our research highlights the importance of digging deeper into the variations that emerge across the political contexts of the 50 states as a way to understand interest group alignment with political parties. The story we uncover reveals increasing heterogeneity over time in the state party coalitions among education interest groups. Historically, the political parties varied a great deal at the state level, but national politics in recent decades has largely overshadowed those variations. Nonetheless, our findings show that party coalitions in a specific issue area can diverge in response to distinct policy trajectories. As a consequence, the landscape of state-level education politics comes in many flavors, with the possibility of more combinations on the horizon if states continue to adopt and develop new policies impacting the resources and mobilization of state education constituencies.
Supplementary Materials
To view supplementary material for this article, please visit http://dx.doi.org/10.1017/S1532440021000256.
Data Availability Statement
Replication materials are available on SPPQ Dataverse at https://doi.org/10.15139/S3/ZAMRST.
Funding Statement
The authors received no financial support for the research, authorship, and/or publication of this article.
Conflict of Interest
The authors declared no potential conflicts of interest with respect to the research, authorship, and/or publication of this article.
Author Biographies
Sarah Reckhow is Associate Professor of Political Science at Michigan State University. Her most recent book, coauthored with Jeffrey Henig and Rebecca Jacobsen, is Outside Money in School Board Elections: The Nationalization of Education Politics (Harvard Education Press, Reference Henig, Jacobsen and Reckhow2019).
Leslie K. Finger is an Assistant Professor of Political Science at the University of North Texas. Her work has been published in Perspectives on Politics, Governance, Policy Studies Journal, and elsewhere.