Introduction
Determination of localized residual stresses in metallic specimens is important in predicting fatigue lifetime after shot peening. The impact of the peening process on the material’s performance is highly dependent on the compressive residual stresses and strain hardening. Excessive residual stresses after peening process can have a destructive influence, and they can reduce the fatigue lifetime substantially [Reference König1]. Residual stresses can currently be measured experimentally using X-ray diffraction-based techniques, hole-drilling, and layer removal [Reference Seifi and Majd2, Reference Mahmoodi, Sedighi and Tanner3], but these techniques are limited to millimeter-scale resolution in lateral dimensions, making relationships to grain-level materials structure challenging and limiting the ability to correlate with crystal plasticity models. Commercially available depth-sensing indentation techniques (commonly called nanoindentation) are able to measure hardness (proportional to flow strength), elastic modulus, and other mechanical properties on the micrometer scale, and several techniques have been developed to concurrently assess residual stresses by nanoindentation [Reference Suresh and Giannakapulos4, Reference Tsui, Oliver and Pharr5].
Nanoindentation relies on interpreting the load–depth record during the penetration of a tip into a sample. Residual stresses can change load–depth curves by altering the amount of material in the “pileup” around the indenter probe, subsequently changing the real contact area relative to the depth of penetration [Reference Suresh and Giannakapulos4, Reference Meng, Wen, Hu, Wang, Zhang, Lian and Zheng6]. At a given penetration depth, the load–depth curve for a sample with a biaxial compressive residual stress is steeper than the stress-free sample and shallower for the tensile residual stresses [Reference Bolshakov, Oliver and Pharr7, Reference Li8]. Similar behavior occurs for unloading curves; compressive residual stresses shift the unloading curve to shallower penetration depths, and oppositely, tensile residual stresses shift to higher penetration depths [Reference Khan, Fitzpatrick, Hanisworth and Edwards9, Reference Zhu, Xu, Wang and Wang10]. There is a linear relationship between residual stresses and changes in the real contact area [Reference Mann, Miao, Garepy, Levesque and Chromik11]. Many of the models addressing residual stresses are based on self-similar indenters, such as a Vickers or Berkovich tip [Reference Suresh and Giannakapulos4]. Equibiaxial stress can be accounted for as a hydrostatic stress which induces an indentation force. Carlsson and Larson have also presented a model to recognize the residual stresses based on the pileup area changing contact area [Reference Carlsson and Larsson12]. Based on extensive investigations, compressive residual stress increases the contact area due to more pileup, and tensile residual stresses decrease the contact area as a consequence of the sinking-in area or less pileup [Reference Mann, Miao, Garepy, Levesque and Chromik11, Reference Carlsson and Larsson12].
Swadener proposed a method to extract the residual stresses from the relationship between hardness and yield stress using spherical indentation probes. However, the model requires a priori knowledge of the yield strength, and spherical indentation often requires larger tips or flatter samples than self-similar indenter geometries [Reference Swadener, Taljat and Pharr13].
In this current study, a simple approach will be developed to evaluate the localized residual stresses after shot peening using instrumented indentation. Instead of basing the technique on changes in the contact area induced by residual stresses, the indentation energy between a stressed sample and a stress-free sample will be compared. The proposed method can be used directly without the contact area calculation, but of course tip area calibration would be needed to concurrently determine hardness. Wang et al. [Reference Wang, Ozaki, Ishikavawa, Nakano and Ogiso14] proposed a residual stress measurement by the energy method using a sharp indenter; however, their formulation used indentation angle as a constant parameter, and during the unloading step, due to the elastic recovery, there would be some overestimation. Also, Wang et al. assumed that elastic response during unloading is independent of the magnitude of pre-existing residual stresses since the substrate remains purely elastic. However, for elastoplastic materials, particularly after severe deformation such as shot peening, the localized indentation response will be affected due to strain hardening [Reference Suresh and Giannakapulos4]. Therefore, in this current paper, to eliminate overestimation during residual stress calculation, instead of the indentation angle, numerical fitting of the load–depth curves will be used, and also instead of plastic energy, elastoplastic energy (total energy) will be considered for residual stress measurement. The indentation residual stress results will be compared to those determined using X-ray diffraction.
Theoretical analysis
Energy model
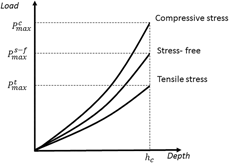
The true, or Meyer, hardness (i.e., the mean pressure, defined by the applied load divided by the true contact area during loading) is assumed to be unaffected by any pre-existing elastic residual stresses present in the material; this assumption is common in prior investigations [Reference Carlsson and Larsson12, Reference Oliver and Pharr15, Reference Zhu, Xu, Wng and Wang16]. Similar to the Suresh model [Reference Suresh and Giannakapulos4], differences between a sample with residual stresses and a stress-free sample will impact the subsequent loading curves, as shown schematically in Fig. 1. An indentation into a material with a compressive residual stress requires a larger contact force to reach the same depth of penetration than a similar indentation in a stress-free sample and vice versa for the tensile residual stresses [Reference Suresh and Giannakapulos4, Reference Bolshakov, Oliver and Pharr7, Reference Zhu, Xu, Wang and Wang10, Reference Wang, Ozaki, Ishikavawa, Nakano and Ogiso14].
Schematic load–depth curves for indentation loading, comparing stressed sample and stress-free sample.

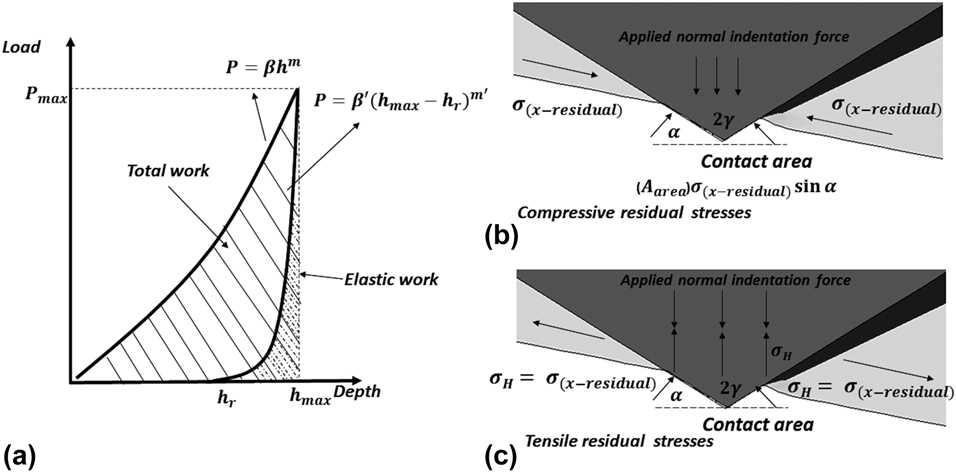
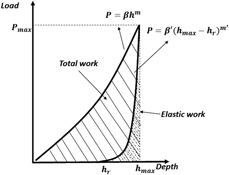
The elastoplastic energy involved in the indentation can be measured using the load (P)–depth (h) curve, and elastoplastic loading is followed by an elastic unloading curve, as shown schematically in Fig. 2(a). In general, the indentation loading and unloading curves can be described phenomenologically by [Reference Pharr and Bolshakov17]:
 $$P = \beta {h^m}\quad \left( {{\rm{loading}}\;{\rm{part}},\;{\rm{elastoplastic}}} \right)\quad ,$$
 $$P = \beta '{\left( {{h_{\max }} - {h_{\rm{r}}}} \right)^{m'}}\quad \left( {{\rm{unloading}},\;{\rm{elastic}}} \right)\quad ,$$
where h r is the measured depth, h max is the maximum depth of the indentation, β and β′ are material constants related to the elastoplastic and elastic properties of the material [Reference Oliver and Pharr15], and m and m′ are constants connected to the indenter shape and contact nature (for an ideal conical indenter m = 2) [Reference Bolshakov, Oliver and Pharr7].
Load displacement curve and residual stress state, (a) comparing elastoplastic energy area under loading unloading curve, (b) schematic compressive residual stress state at the indentation surface, (c) schematic tensile residual stress state at the indentation surface.

Applying a load P to the indenter over a displacement h expresses work done on the system due to the elastoplastic strain, and the unloading part returns the work done by the system as the material elastically recovers [Reference Shrshorov, Bulychev and Alekhin18, Reference Hainsworth, Chandler and Page19]. Therefore, the total work (u el+pl) and elastic work of indentation (u el) are the area enclosed by the loading and unloading section, respectively. The corresponding equations are
 $${u_{{\rm{el + pl}}}} = \int_0^{{h_{\max }}} {\beta {h^m}{\rm{d}}h} \quad ,$$
 $${u_{{\rm{el}}}} = \int_{{h_{\rm{r}}}}^{{h_{\max }}} {\beta '{{\left( {{h_{\max }} - {h_{\rm{r}}}} \right)}^{m'}}{\rm{d}}h} \quad .$$
Based on prior studies [Reference Shrshorov, Bulychev and Alekhin18] very small elastic strains in compare with plastic strains have been considered during nanoindentation with sharp indentation. For a material that strain hardens, prior residual plastic strains can change the localized yield stress. Therefore, for this situation, elastoplastic loading and elastic unloading are not invariant, and they are changed by the prior plastic deformation [Reference Suresh and Giannakapulos4, Reference Chaudhri20, Reference Tabor21]. After severe plastic deformation, such as shot peening, both elastoplastic and elastic responses during indentation are affected by the residual stresses. Since the total energy (elastoplastic) can be measured by comparing the stressed sample and stress-free sample with a given energy level, the indentation can provide the magnitude of the residual stresses. Based on the Suresh model for compressive equibiaxial residual stresses on the indentation surface, hydrostatic stress will be similar to the equibiaxial compressive stresses and uniaxial tensile stresses along the indentation direction  $- \sigma _x^{{\rm{res}}} = - \sigma _y^{{\rm{res}}} = - \sigma _z^{{\rm{res}}} = - {\sigma ^{{\rm{hyd}}}}$ [Reference Suresh and Giannakapulos4]. Due to the tensile and compressive stresses, as shown in Fig. 2(b), there is a (sin α) coefficient that is related to the contact lost between the indenter and contact perimeter [Reference Suresh and Giannakapulos4]. Consequently, the upper bound estimation for the maximum load to achieve a given indentation penetration depth between the stress-free sample and stressed sample can be written as
 $$P_{{\rm{max}}}^{\rm{c}} = P_{\max }^{{\rm{s ‐ f}}} + {\sigma _{{\rm{res}}}}{A_1}\sin \alpha \quad ,$$
where  $\alpha = \left( {{\pi \over 2} - \gamma } \right)$ with γ being the angle of indenter tip, for Berkovich tip α=24.7°, A 1 is a real contact area for stressed sample, and
 $P_{{\rm{max}}}^{\rm{c}}$ and
 $P_{\max }^{{\rm{s ‐ f}}}$ are shown in Fig. 1. Also for tensile residual stresses in Fig. 2(c), the same equation can be used for residual stresses
 $\sigma _x^{{\rm{res}}} = \sigma _y^{{\rm{res}}} = \sigma _z^{{\rm{res}}} = {\sigma ^{{\rm{hyd}}}}$, without considering the contact loss due to the tensile equibiaxial stresses on the surface and the uniaxial tensile stress along the indentation axis:
 $$P_{\max }^{\rm{t}} = P_{\max }^{{\rm{s ‐ f}}} - {\sigma _{{\rm{res}}}}{A_1}\quad .$$
The total energy at the maximum load P = P max can be calculated by using Eqs. (5) and (6). As a result, the work done by compressive and tensile residual stresses on the substrate respectively is
 $$U_{{\rm{el + pl}}}^{{\rm{Stressed}}\;{\rm{sample}}} - U_{{\rm{el}} + {\rm{pl}}}^{{\rm{Stress ‐ free}}} = \left( {P_{\max }^{{\rm{s ‐ f}}} + {\sigma _{{\rm{res}}}}{A_1}\sin \alpha - P_{\max }^{{\rm{s ‐ f}}}} \right){h_{\max }}\quad \left( {{\rm{Work}}\;{\rm{done}}\;{\rm{by}}\;{\rm{compressive}}\;{\rm{stress}}} \right)\quad ,$$
 $$U_{{\rm{el + pl}}}^{{\rm{Stressed}}\;{\rm{sample}}} - U_{{\rm{el}} + {\rm{pl}}}^{{\rm{Stress ‐ free}}} = \left( {P_{\max }^{{\rm{s ‐ f}}} - {\sigma _{{\rm{res}}}}{A_1} - P_{\max }^{{\rm{s ‐ f}}}} \right){h_{\max }}\quad \left( {{\rm{Work}}\;{\rm{done}}\;{\rm{by}}\;{\rm{tensile}}\;{\rm{stress}}} \right)\quad .$$
After shot peening and cold working, the elastic unloading part during nanoindentation process is also dependent upon residual stresses [Reference Suresh and Giannakapulos4]. Therefore, the energy contribution of residual stresses can be calculated by integrating Eq. (5) with respect to the maximum depth for both stressed sample and stress-free sample
 $${\rm{Total}}\;{\rm{work}}\;{\rm{for}}\;{\rm{stressed}}\;{\rm{sample}} = \int_0^{{h_{\max }}} {\left( {{\beta _1}{h^{{m_1}}}} \right){\rm{d}}h} = {{{\beta _1}{h^{\left( {{m_1} + 1} \right)}}} \over {\left( {{m_1} + 1} \right)}} = {{P_m^{\rm{s}}{h_m}} \over {\left( {{m_1} + 1} \right)}}\quad ,$$
 $${\rm{Total}}\;{\rm{work}}\;{\rm{for}}\;{\rm{stress ‐ free}}\;{\rm{sample}} = \int_0^{{h_{\max }}} {\left( {{\beta _0}{h^{{m_0}}}} \right){\rm{d}}h <$$><$$>= {{{\beta _0}{h^{\left( {{m_0} + 1} \right)}}} \over {\left( {{m_0} + 1} \right)}} = {{P_m^{{\rm{s ‐ f}}}{h_m}} \over {\left( {{m_0} + 1} \right)}}} \quad ,$$
where  $P_{{\rm{max}}}^{\rm{s}}$ and
 $P_{{\rm{max}}}^{{\rm{s ‐ f}}}$ are the maximum load of indentation for stressed sample and stress-free sample, β and m are the fitting parameters where subscripts 1 and 0 represent the stressed sample and stress-free sample, respectively. Substituting Eqs. (9) and (10) into Eqs. (7) and (8), the residual stress can be related to parameters from the indentation load–depth curves as
 $${\rm{Compressive}}\;{\rm{residual}}\;{\rm{stresses}}\;\left( {{{P_{{\rm{max}}}^{\rm{s}}{h_{\max }}} \over {({m_1} + 1)}} - {{P_{{\rm{max}}}^{{\rm{s ‐ f}}}{h_{\max }}} \over {({m_0} + 1)}}} \right) = \left( {{\sigma _{{\rm{res}}}}{A_1}\sin \alpha } \right){h_{\max }}\quad ,$$
 $${\rm{Tensile}}\;{\rm{residual}}\;{\rm{stresses}}\;\left( {{{P_{{\rm{max}}}^{\rm{s}}{h_{\max }}} \over {({m_1} + 1)}} - {{P_{{\rm{max}}}^{{\rm{s ‐ f}}}{h_{\max }}} \over {({m_0} + 1)}}} \right) = \left( { - {\sigma _{{\rm{res}}}}{A_1}} \right){h_{\max }}\quad .$$
Determination of appropriate indentation depth for small-scale indentation and residual stress assessment
Indentations can be performed under three different conditions: elastic, elastic–plastic, and fully plastic conditions, as described in detail by Tabor [Reference Tabor21]. These conditions are separate from any indentation size effect [Reference Nix and Gao22] which may be mechanistically related to non-uniform deformation. Indenters always have some spherical asperity at the tip, and so at the lowest loads, they may exhibit elastic contact with a substrate (i.e., the Hertzian loading condition of a sphere in contact with a flat). As a spherical asperity on an otherwise self-similar indenter continues to penetrate the surface, the material response is elastic–plastic, and once there is a transition from elastic–plastic behavior to the fully plastic behavior (through either a combination of material properties or reaching a self-similar position of the indenter probe), the mean pressure (hardness) becomes constant. In the fully plastic regime with a self-similar indenter, the flow strength of the solid is often estimated as one-third of the hardness [Reference Tabor21, Reference Wolf and Richter23, Reference Wolf, Richter and Gunther24].
For self-similar indenters in the fully plastic region, pileup or sinking-in area at contact periphery can develop based on the included angle of the indenter and the strain hardening behavior of the material [Reference Oliver and Pharr15, Reference Wolf and Richter23]. While the true hardness is independent of residual stresses in the fully plastic region [Reference Carlsson and Larsson12], the projected contact area and pileup area are dependent upon residual stresses [Reference Suresh and Giannakapulos4, Reference Carlsson and Larsson12, Reference Pharr and Bolshakov17]. Numerous studies have shown that the pileup ratio is maximum when the fully plastic region is developed, which is often where residual stresses can be extracted [Reference Carlsson and Larsson12, Reference Rydin and Larsson25, Reference Oliver and Pharr26]. Consequently, for evaluating residual stresses using indentation methods, it is best if the indentation is in the fully plastic region so as to develop a constant ratio of pileup or sinking-in relative to the depth of penetration. Additionally, the indentation should be large enough to eliminate the indentation size effect [Reference Nix and Gao22]. For this purpose, the relation between contact depth and penetration depth is key to finding the transitions from elastic–plastic to fully plastic regimes of the indentation process [Reference Wolf and Richter23, Reference Wolf, Richter and Gunther24]. Wolf et al. showed by normalizing contact depth over the indentation depth and plotting against the total penetration depth, the ratio plateaus at the value at which the hardness is constant and a fully plastic region is developed [Reference Wolf and Richter23, Reference Wolf, Richter and Gunther24]. Of course, if one aims to produce a technique applicable to measuring the localized variation in properties, it would be beneficial to measure properties at as small a scale as possible.
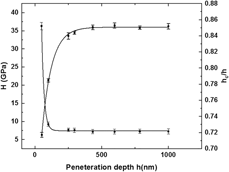
For a given position, a cyclic loading and unloading (the “partial load–unload” method) can be used to generate the ratio of  ${{{h_{\rm{c}}}} \over h}$ as a function of h (depth of the penetration) [Reference Wolf, Richter and Gunther24]. Indentations into the as-received 52100 steel were performed, and the resulting hardness and depth ratio are shown in Fig. 3. At a depth of indentation exceeding 500 nm, the indentation appears to be fully plastic. To obtain the most accurate residual stresses, the maximum depth of the nanoindentation should be in fully plastic zone, but to be able to map localized properties, one would desire the smallest indentation possible in these conditions. The indentation size effect can be calculated by depth-dependent hardness which is shown in Fig. 3, which shows that the hardness decreases with increasing depth of the indentation, but plateaus around 250 nm for the material used in this study. Therefore, two maximum depths of indentation, 350 and 1000 nm, were chosen for measuring residual stresses with the nanoindentation method, and the results were compared with those of the X-ray method to examine the validity of the maximum indentation depth choices.
Experimental determination of size effect (hardness as a function of depth) and contact depth to penetration depth ratio obtained from multiple cycles of single indentations. Error bars represent standard deviation of 5 indentations, points represent the mean of 5 measurements.

Results and discussion
Residual stress measurement on the shot-peened surface
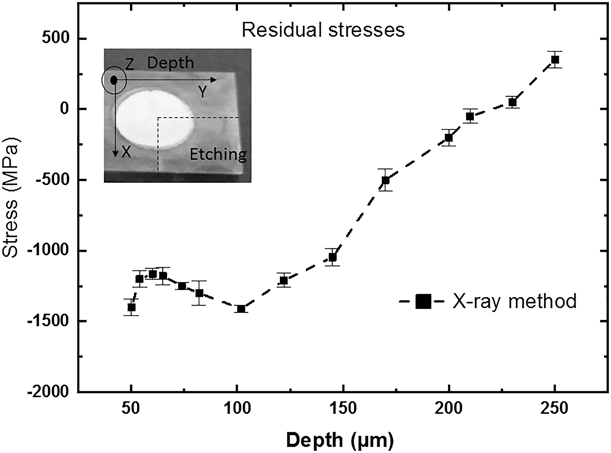
X-ray diffraction was performed on the as shot-peened surface, the mechanically polished surface, and the electro-etched surface, resulting in a compressive residual stress of −1490 MPa on the shot-peened surface, as shown in Fig. 4. The depth-dependent compressive and tensile residual stresses are in the following range: −1250 up to 300–400 MPa in the interior of the strip.
X-ray residual stress measurement on the corresponding depth with electro-etching method. Error bars the represent instrument precision.

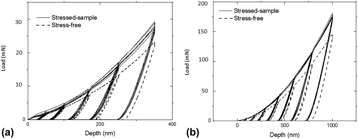
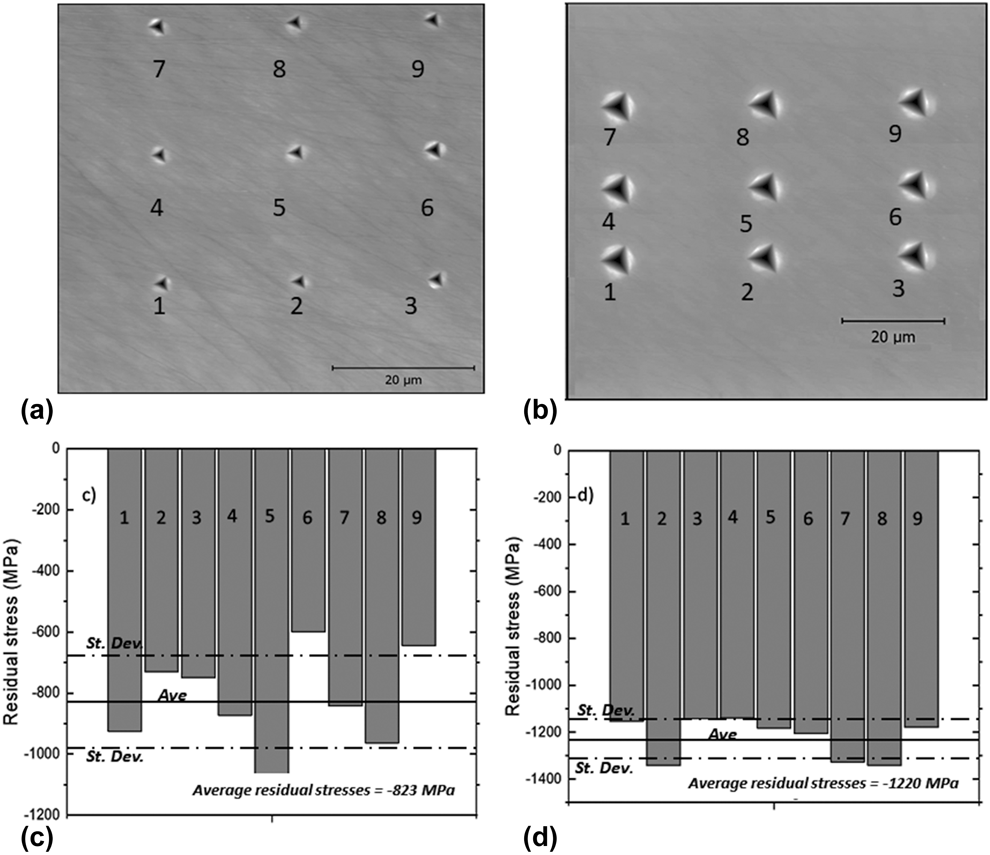
Typical load–displacement curves for 10 indents on the mechanically polished shot-peened sample and stress-free sample are shown in Fig. 5 with maximum indentation depths of 350 and 1000 nm, respectively. Fitting curves were applied for each load–depth curve whose power law coefficients in Eqs. (1) and (2) are shown in Table I. The loading curves of the shot-peened samples (which have a compressive residual stress on the surface) are significantly higher than those of the stress-free sample. By using Eq. (11). the residual stresses can be estimated corresponding to each indentation impression, shown in Fig. 6. Based on the maximum depth of indentation, the average residual stresses on the shot-peened surface was −823 MPa and −1220 MPa for maximum indentation depths of 350 and 1000 nm, respectively. The X-ray result is slightly different from the individual indentation results, especially at the lower indentation depth h max = 350 nm, which has more scattered results in comparison with h max = 1000 nm. The main reason for these scatter results for individual indentation is the X-ray resolution and metallurgical parameters. The X-ray system collects information from an illuminated area on the surface on the order of 1–2 mm2. Each indent can be impacted by local metallurgical parameters such as grain boundaries, grain orientation, and non-uniform distributions of defects. The alloy used for validation in this study had an average grain size of ≈20 µm, and therefore, each indentation will likely be sampling a different grain but be within one grain (at most two). The higher load (larger volume sampled) will increase homogenization; the change in residual stresses in each indentation position for the maximum depth of indentation h max = 1000 was less than 5%, as shown in Fig. 6. In general, the residual stresses within h max = 1000 and 350 nm are in good agreement with X-ray results.
Load–displacement curves for 9 indents on the shot-peened sample (solid lines) and the corresponding single indentation on a sample prior to peening (dashed line) to (a) maximum indentation depth 350 nm, (b) maximum indentation depth 1000 nm. Note the stress relaxation during the hold overlaps on the 9 indentations; the magnitude of stress relaxation for any single indent is similar between the stressed and stress-free cases.

Load–depth parameters [Eq. (1)] extracted from fitting loading curves.

Residual stresses corresponding to the indentation on the shot-peened surface obtained by energy model, (a and c) maximum indentation depth 350 nm, (b and d) maximum indentation depth 1000 nm.

To measure residual stresses by nanoindentation accurately, the maximum depth of the indentation should be large enough to eliminate the indentation size effect and it must be in a fully plastic zone, which is mentioned in Sec. 3.3. Indentations in the fully plastic regime will improve accuracy due to the self-similarity of pileup or sinking-in area when plasticity dominates the indentation probe. These results are consistent with other investigations [Reference Suresh and Giannakapulos4, Reference Bolshakov, Oliver and Pharr7, Reference Carlsson and Larsson12, Reference Pharr and Bolshakov17].
Depth-dependent residual stresses measured on a cross section
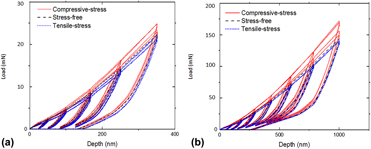
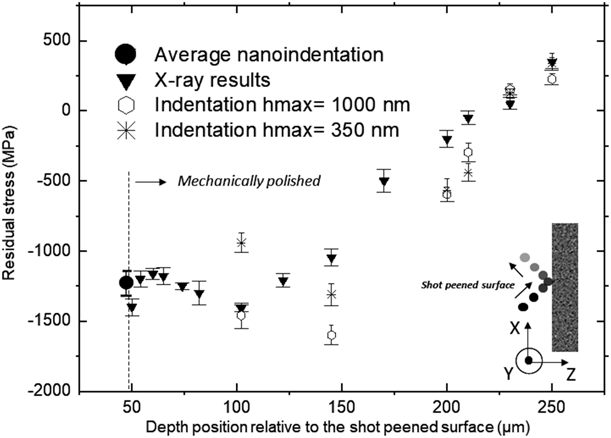
The loading and unloading curves on the cross section pattern for the shot-peened sample are shown in Fig. 7. Close to the surface, due to the compressive residual stresses, the loading curves were higher than those of the stress-free sample. Since tensile residual stresses are present in the middle of the sample, the load depth curves are lower than those of the stress-free sample. Figure 8 shows the variation of residual stresses for each indent beneath the surface by using Eqs. (11) and (12). This figure shows that for two different depths of indentation, h max = 350 and 1000 nm, residual stresses are close to the X-ray results. The resulting residual stresses correspond to the maximum indentation depth of 1000 nm and have a uniform distribution and less scattered results. The residual stresses’ value calculated in the deeper area from the edge showed tensile residual stresses at Z = 170 µm beneath the shot-peened surface.
Loading and unloading curves for stressed and stress-free samples on the cross section, (a) indentation depth 350 nm, (b) indentation depth 1000 nm.

Residual stress profile measured in the cross section. The stresses extracted from the indentation are generally in agreement with the stresses measured via X-ray diffraction. Since the roughness due to peening was removed via mechanical polishing, the depth at which that surface was evaluated is noted to be equivalent to ≈50 µm from the original surface. Error bars in the figure represent instrument precision for the X-ray results, and points represent the average of two indentations, with high and low noted as “error bars.”

Indentations on the cross section surface were made at least 50 µm from the edge to avoid any issues of sample preparation or influence from the free surface. In addition, polishing may alter the residual stresses on the surface. However, in the current energy method, this change in stress level from the indentations should be minimized since the comparison is between two polished surfaces for the stress-free sample and peened sample with the same polishing condition. As a consequence, the X-ray result close to the surface on the cross section in Fig. 8 shows a slightly higher residual stress than in the nanoindentation method. In general, the stresses measured by indentation on the cross section follow the residual stress trend extracted from the X-ray results, and individual point-to-point variation is likely due to the local differences in the microstructure (i.e., lack of homogenization) with the indentation when compared to the ≈mm2 region sampled by the X-rays.
Conclusion
The localized residual stresses of a shot-peened austempered 52100 steel were evaluated using nanoindentation and X-ray methods. A new approach based on the energy of the indentation has been developed to measure residual stresses after peening process. It is found that unloading response during indentation depends on pre-existing residual stresses for material with strain hardening. The average residual stresses determined using the indentation method on the surface are in good agreement with the X-ray results. It is likely that the wider distribution results for each single indentation, when compared to the X-ray results, is due to localized metallurgical parameters, suggesting that residual stresses on the micrometer scale may vary significantly more than would be evident with larger volume sampling methods. The ability to make localized measurements of residual stresses should be useful for future inclusion into crystal plasticity models. The residual stresses obtained by the nanoindentation technique on the cross section also showed promising agreement with the X-ray measurement.
Materials and experimental section
Materials
Flat strip samples of a 52100 steel alloy used for austempering, with a nominal thickness of 6 mm and a width section 18 mm and length 20 mm, were used in this study. The shot peening was carried out by a commercial supplier using steel balls with an average diameter on the order of 1 mm. The shot peening nozzle was a V-type model, the accelerating air pressure was 75 PSI, and a 3/8-inch nozzle size was used (English units used based on industrial convention in these processes). After peening, there is some residual roughness on the peened surface; this roughness can lead to uncertainties in assessing properties using instrumented indentation. The surface and cross section were ground through 1200 grit paper, followed by polishing with 6 and 3 µm diamond paste, removing approximately 50–75 μm of material. Both the top surface of the shot-peened sample (shot-peened surface) and a cross section were examined, in addition to the surface of a sample prior to peening.
Nanoindentation was carried out using a Hysitron TI950 system (Hysitron Inc., Minneapolis, Minnesota) with a high load head and a Berkovich tip. The tests were conducted in depth control mode with a maximum depth of 350 and 1000 nm, using 50 nm/s loading and unloading rates and a 20-s dwell time at maximum depth. The indents were spaced in a rectangular pattern with 40 × 50 µm distances from edge to edge and in a line pattern in the cross section. The indentation tip area function was calibrated with fused quartz.
X-ray measurement of residual stresses
Residual stresses were measured by using the entire Debye–Scherrer ring with a single incident X-ray beam [Reference Youkendou27, Reference Yoshioka, Ohya and Shinkai28]. The residual stresses on the surface changes the diffraction Debye–Scherrer ring on the central angle. The magnitude of the strain can be found from the detected position of the Debye–Scherrer ring, and consequently the residual stress can be found by [Reference Sasaki and Hirose29]:
 $${\varepsilon _\delta } = {1 \over 2}\left[ {\left( {{\varepsilon _\delta } - {\varepsilon _{\left( {\pi + \delta } \right)}}} \right) + \left( {{\varepsilon _{ - \delta }} - {\varepsilon _{\left( {\pi - \delta } \right)}}} \right)} \right]\quad ,$$
 $${\sigma _x} = {E \over {\left( {1 + \nu } \right)}} \times {1 \over {\sin 2\varphi }} \times {1 \over {\sin 2{\varphi _0}}} \times \left( {{{\partial {\varepsilon _\delta }} \over {\partial \cos \delta }}} \right)\quad ,$$
where E and ν are the elastic modulus and the Poisson ratio, respectively, α is the azimuth angle of the Debye–Scherrer ring, φ0 is the incident angle from the Z-axis, and φ is the complementary angle of the Bragg angle [Reference Taira and Tanaka30]. A Pultstec µ-X360s system X-ray residual stress analyzer (Pulstec USA, Torrance, California) was used to measure the residual stresses before and after peening. The source of the system was chromium Cr, with a radiation wavelength of 2.29 Å (Cr Kα). This system is capable of millimeter-scale lateral resolution and a depth resolution on the order of a few micrometers. The residual stresses were measured on the polished samples prior to indentation and were compared with the average of 9 indents over the same general area. To measure residual stresses as a function of depth, the specimen was electro-etched in a 3.5% NaCl solution at room temperature (25 °C) with a DC current of 0.45 A. The sample was etched, the stress was measured, the amount of material removed was measured using a dial gauge micrometer with a resolution of 2 µm, and then this process was repeated to generate a stress–depth profile.
Acknowledgment
We wish to thank EI Incorporated, Cummins Fuel Systems, and the Indiana Manufacturing Consortium through the Center for Surface Enhancement Engineering for financial support to this project. We also wish to thank Metal Improvement, Indianapolis IN, for shot peening the samples.