


Whereas partisan attachments are quite stable, individuals do respond to the external environment. Further, evidence indicates that the presence of an election is a source of such variation—in particular, it has been argued that elections make underlying partisan predispositions more prominent. Building from these insights, we take advantage of the timing of the post-election surveys included in the Comparative Study of Electoral Systems (CSES 2003; 2007; 2013) to explore the causal role that election salience has on individuals’ attachments to political parties.
As time passes, any effects that elections might have should diminish. And, within each survey of the CSES, the dates on which survey respondents are interviewed are assigned, we assume, independent of factors known to affect partisanship. We exploit this assignment process to identify the effects of election salience on partisan attachments. In doing so, we account for the ways in which survey timing might systematically differ across countries with our statistical models. We also present explorations of our identifying assumption of as if random interview assignment within election surveys, the results of which bolster its validity.
We expect that as the distance between the timing of a survey interview and the election increases, and the election thereby becomes less salient, individuals will be less likely to identify with a party; individuals who identify with a party will do so less strongly; and the relationship between partisanship and evaluations of political actors will weaken. We find support for all three expectations. This reinforces extant findings that elections activate partisanship, and it substantiates their causal role.
BACKGROUND AND EXPECTATIONS
Although partisanship has declined in some advanced democracies (Dalton and Wattenberg Reference Dalton and Wattenberg2002; Dassonneville and Hooghe Reference Dassonneville and Hooghe2018; Schmitt and Holmberg Reference Schmitt and Holmberg1995), it nevertheless remains a powerful force. This is the case even in countries where aggregate partisanship is low (Bankert, Huddy, and Rosema Reference Bankert, Huddy and Rosema2017). And, although partisanship is among the most stable of political attitudes, substantial evidence indicates that it does respond to external context. For example, elite polarization (e.g., Adams, Green, and Milazzo Reference Adams, Green and Milazzo2012; Hetherington Reference Hetherington2001; Lupu Reference Lupu2015; Thornton Reference Thornton2013), the number of parties (e.g., Bowler, Lanoue, and Savoie Reference Bowler, Lanoue and Savoie1994; Holmberg Reference Holmberg, Dalton and Klingemann2007; Huber, Kernell, and Leoni Reference Huber, Kernell and Leoni2005; Karp and Banducci Reference Karp and Banducci2008; Katz Reference Katz1980; Sartori Reference Sartori1976), and institutional features (e.g., Gerring, Thacker, and Moreno Reference Gerring, Thacker and Moreno2009; Schmitt Reference Schmitt, Bartles and Bellucci2009; Singh and Thornton Reference Singh and Thornton2013) have all been shown to influence partisanship or partisan strength.
Our focus is on the effects of elections on patterns of partisanship. From the earliest studies of voting behavior and campaigns (Berelson, Lazarsfeld, and McPhee Reference Berelson, Lazarsfeld and McPhee1954; Lazarsfeld, Berelson, and Gaudet Reference Lazarsfeld, Berelson and Gaudet1944), it has been argued that elections activate existing predispositions, and this argument is consistent with more recent evidence (e.g., Gopoian and Hadjiharalambous Reference Gopoian and Hadjiharalambous1994; Holbrook Reference Holbrook1996; Stimson Reference Stimson2004). As Campbell (Reference Campbell2000) argues, election campaigns “restore” partisanship, and evidence from the US indicates that campaigns make partisan attitudes more pronounced (e.g., Grant, Mockabee, and Monson Reference Grant, Mockabee and Monson2010). Further, US panel data indicate that ambivalence, a dimension of attitude strength (Miller and Peterson Reference Miller and Peterson2004), declines over the course of the election (Rudolph Reference Rudolph2011). Similarly, as election day nears, uncertainty toward parties declines (Peterson Reference Peterson2014), perceptions of the candidates polarize (Miller and Shanks Reference Miller and Shanks1982), and the relationship between partisanship and vote intentions strengthens (Bartels Reference Bartels, Brady and Johnston2006). Evidence also suggests that partisan intensity responds to the presence of an election (Allsop and Weisberg Reference Allsop and Weisberg1988; Brody and Rothenberg Reference Brody and Rothenberg1988; Huckfeldt, Sprague, and Levine Reference Huckfeldt, Sprague and Levine2000). As per Iyengar and Simon (Reference Iyengar and Simon2000, 159), nearly six decades of evidence shows that “the principal impact of the campaign will be to push partisans into their respective corners.”
In line with this literature, as an election—and by extension political parties—becomes less salient, so should party identification. This leads to three testable hypotheses. First, we hypothesize that as an election becomes less salient, one should be less likely to identify with a party. Similarly, as parties become less salient in the minds of the public, partisan strength should decline for many of those who continue to identify with a party. Therefore, our second hypothesis is that the strength of one’s attachment decreases as an election becomes less salient.
As a corollary, we expect that, because partisanship becomes less prominent as elections become less salient, it should have a smaller influence on subsequent political evaluations. Consequently, our third hypothesis is that the link between partisanship and political evaluations will weaken as elections become less salient.
DATA AND METHODS
Our data come from the Comparative Study of Electoral Systems. The CSES questionnaire is embedded in national post-election surveys in dozens of countries, and it asks cross-nationally comparable questions about partisan attachments and evaluations of political actors.
To examine whether elections affect partisanship, researchers benefit from a measure of the degree to which an election is salient in an individual’s mind. Many survey projects ask respondents whether or not they witnessed or participated in a variety of activities associated with an election, such as campaigning for a candidate or voting, and it is possible to create an indicator of election salience from responses to such questions. However, correlations between such self-reported indicators and partisanship could be spurious. For example, they may surface solely because individuals who engage with political campaigns and vote are more educated, and education is itself linked to partisanship. Further, such correlations do not provide evidence of the direction of a relationship; perhaps partisans are more likely to campaign for candidates and to vote.
To overcome such limitations, we leverage the fact that the dates on which CSES respondents are interviewed within each post-election survey are likely unrelated to partisanship and its correlates, and we use the number of days between the day of the election and the date on which a respondent was interviewed to capture election salience. To account for the fact that increases in this delay will matter soon after the election than several months after, we take the natural logarithm. We call the resulting variable time since election. Under the assumption that respondents in each survey are as if randomly treated (Dunning Reference Dunning2008) with an interview date, we can interpret the effects of time since election within a given survey as causal.Footnote 1
Because we pool the CSES data, it is critical that we account for the fact that survey firms operate under varying constraints and schedules across countries. For example, all interviews in one country may occur within a few weeks following the election, whereas in another country, the interviews might take several months to complete. Perhaps citizens in countries that get surveys into the field relatively quickly tend to be more partisan—a possibility because such countries may also have, on average, longer experiences with electoral democracy. Left unaddressed, this would hamper our ability to identify the effects of time since election.Footnote 2 Thus, we analyze the data in a multilevel framework. In particular, in addition to estimating a random intercept for each CSES election survey in each country, we allow the effect of time since election to vary randomly across surveys.Footnote 3
We include in our sample all CSES election surveys for which the data needed to measure our key variables are available. These 86 surveys are listed in Appendix A, along with information on the minimum, average, and maximum time from the election to an interview for each survey. We show the predicted random effects for each survey in Appendix B.
RESULTS
Here, we present all of our results graphically. Model details, information on estimation procedures, and numerical results are provided in Appendix C, where we also demonstrate robustness to various estimation methods.
Our first hypothesis puts forth that, as election salience decreases, one should be less likely to have a partisan identification. The CSES asks respondents whether or not they identify with a political party, and we use answers to this question to create a dichotomous variable that distinguishes identifiers from non-identifiers.Footnote 4 As shown in Figure 1, and in support of our first hypothesis, one’s probability of having a partisan attachment is higher soon after an election than it is after some time passes. One who is interviewed the day after the election, for example, holds a partisan attachment with a predicted probability of 0.57, whereas for someone who is interviewed 150 days after the election, the predicted probability is 0.43.
Partisan Attachments and Time From the Election to the Interview
Note: The figure is created from the main estimation in Table C.1, which is shown in Appendix C. Dashed lines represent 95% confidence interval.

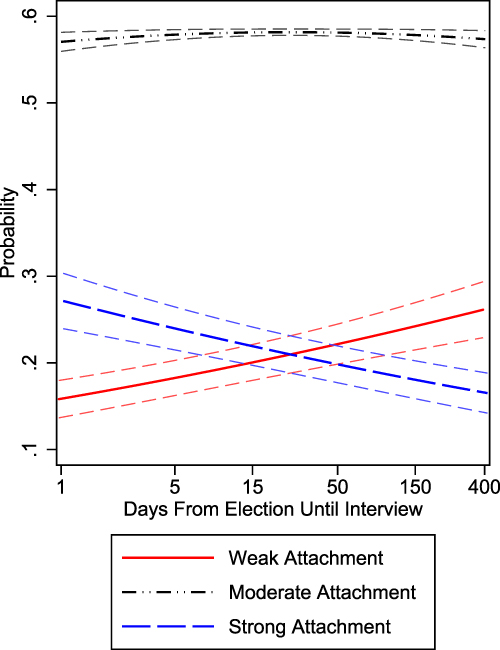
Our second hypothesis is that the strength of one’s attachment decreases along with election salience. The CSES asks respondents with a partisan attachment to state a degree of closeness to “their” party.Footnote 5 We create an ordinal variable that contains the following three categories: weak attachment, moderate attachment, and strong attachment. In Figure 2, we chart how the predicted strength of partisan attachments varies with time since election. Whereas the probability of having a moderate attachment is largely constant over the range of time since election, the probability of having a strong attachment is markedly higher than the probability of having a weak attachment soon after the election concludes. And, one is significantly more likely to have a weak attachment than a strong attachment once the election is temporally distant. This provides support for our second hypothesis.
Partisan Attachment Strength and Time From the Election to the Interview
Note: The figure is created from the main estimation in Table C.2, which is shown in Appendix C. Dashed lines represent 95% confidence interval.

To put our findings in context, we note that our substantive effects are in line with other known sources of partisan acquisition and strength, including compulsory voting (Singh and Thornton Reference Singh and Thornton2013), socialization (Claggett Reference Claggett1981), and party polarization (Lupu Reference Lupu2015). In a field experiment, Gerber, Huber, and Washington (Reference Gerber, Huber and Washington2010) find that reminding citizens to register to vote increases the likelihood that they identify with their “latent” party by about eight percentage points.
Our third hypothesis states that the relationship between partisanship and political evaluations will weaken as elections become less salient. To test this, we take as our dependent variable CSES respondents’ evaluations of the incumbent party in the recent election. This variable ranges from zero to 10, with higher values indicating rosier evaluations of the incumbent party.Footnote 6 We predict these evaluations as a function of whether or not one identifies with the incumbent party, which we capture with a dichotomous copartisanship variable that takes a value of one for those who identify with the incumbent party and a value of zero for those who do not. Following from the hypothesis, we expect that copartisanship will become a weaker predictor of incumbent evaluations as the time between the election and one’s interview date increases. We test this by interacting copartisanship with time since election. As demonstrated in Figure 3, copartisanship leads to more positive evaluations of the incumbent party. And, in line with our expectation, this relationship weakens as the election recedes into the past.
The Impact of Copartisanship on Incumbent Evaluations and Time From the Election to the Interview
Note: The figure is created from the main estimation in Table C.3, which is shown in Appendix C. Dashed lines represent 95% confidence interval.

PLAUSIBILITY OF THE IDENTIFYING ASSUMPTION
When leveraging naturally occurring treatments—in our case, interview timing—it is important to examine whether the treatment process worked in a manner that precludes the need to control for potential confounders (cf. Sekhon and Titiunik Reference Sekhon and Titiunik2012). In particular, we recognize the possibility that survey agencies could roll out their interviews in a way that makes our assumption of as if random interview date assignment implausible. For example, people in cities may tend to be interviewed sooner than people in rural areas. If city dwellers are also more partisan, on average, this could account for our findings. To examine the plausibility of our assumption of as if random assignment of interview dates within surveys, we check whether several potential confounders predict the time between the election and the date of interview.
As shown in Appendix D, within each survey, we find only trivial relationships between individual characteristics and the date on which one was interviewed. There, we also scrutinize the potential links between the degree of democracy and country-level wealth and interview timing across countries, finding null relationships. Thus, we are confident that the relationships shown in Figures 1–3 are truly due to the time from the election to the interview. To further demonstrate this, we show that our results are robust to models that include a slate of control variables in Appendix D.
Additionally, about 84 percent of the respondents in our sample were interviewed solely by telephone or in person. For the other 16 percent, interviews were either done entirely by mail or conducted by mail in conjunction with a telephone or face-to-face interview. Allowing respondents to mail back their questionnaires on their own time potentially harms our assumption of as if random interview timing—perhaps those with partisan ties tend to mail back questionnaires more quickly than those without. To account for this, we re-estimate our models with those who were not surveyed solely by telephone or solely in person removed from the sample. Results, which are shown in Appendix E, are very similar to those of our main models.
TIME SINCE AN ELECTION AS A MEASURE OF ELECTION SALIENCE
Although the time passed since an election is perhaps an uncontroversial gauge of election salience, it is worth probing the validity of our key causal variable. To do so, we rely on the fact that individuals are more likely to provide ideological placements of themselves and political parties when elections are salient—and therefore the information environment is rich (e.g., Aldrich et al. Reference Aldrich, Schober, Ley and Fernandez2018). If the time since election is inversely related to election salience, it should also be inversely related to the likelihood that survey respondents will provide self-placements and placements of political parties along an ideological scale. We show that this is indeed the case in Appendix F.
CONCLUSION
It has long been argued that elections heighten partisanship. However, extant observational research on this topic is limited by the lack of an exogenous measure of election salience. Overcoming this limitation, we exploit the timing of surveys conducted by the CSES to identify the causal effect of election salience on individuals’ attachments to political parties. We find that, as time passes from an election, the likelihood of identifying with a party decreases, levels of partisan strength decline, and the impact of partisanship on evaluations of governing parties diminishes. Our research design, together with the empirical verification of our identifying assumption of as if random interview timing within election surveys, allows us to be confident that we have not merely uncovered an artifact of survey design and that our results are not plagued by endogeneity.
Our results provide evidence of the potential underlying mechanism for several existing findings. For example, it is known that election polls tend to be fairly volatile, whereas elections themselves are often quite predictable (Gelman et al. Reference Gelman, Goel, Rivers and Rothschild2016; Gelman and King Reference Gelman and King1993). Similarly, our results are suggestive of a process that reconciles evidence demonstrating that although individuals exhibit intra-election change (e.g., Brody and Rothenberg Reference Brody and Rothenberg1988), partisanship remains stable for many over longer periods of time (Bartels et al. Reference Bartels, Box-Steffensmeier, Smidt and Smith2011). Our results are also consistent with a growing body of evidence indicating that although partisanship is very stable, it nevertheless responds to the external environment. Finally, beyond our substantive conclusions, we believe we have highlighted an important methodological issue: the timing of election surveys can impact the pattern of responses (see also Banducci and Stevens Reference Banducci and Stevens2015).
SUPPLEMENTARY MATERIAL
To view supplementary material for this article, please visit https://doi.org/10.1017/S0003055418000722.
Replication materials can be found on Dataverse at: https://doi.org/10.7910/DVN/03CDTK.





Comments
No Comments have been published for this article.