Many applications for transition metal oxides, and particularly for VO2, have been proposed. Among them are field effect transistors,[Reference Newns, Misewich, Tsuei, Gupta, Scott and Schrott1] energy-efficient window coatings[Reference Babulanam, Eriksson, Niklasson and Granqvist2, Reference Granqvist3] and gas sensors.[Reference Strelcov, Lilach and Kolmakov4] However, to extend the field of applications, a deeper fundamental understanding of the occurring phase transformations and the related mechanical and electronic properties of VO2 is required. Pure strain-free VO2 is subjected to a phase transformation at 341 K from the high-temperature tetragonal metallic R phase to the monoclinic insulating M1 phase, accompanied by a change in resistance of several orders of magnitude.[Reference Berglund and Guggenheim5–Reference Morin7] The presence of an additional insulating M2 phase has been determined to appear under uniaxial stress or from doping of VO2.[Reference Brückner, Oppermann, Reichelt, Terukow, Tschudnowski and Wolf6, Reference Eyert8–Reference Pouget and Launois10] Pouget et al.[Reference Pouget, Launois, Dhaenens, Merenda and Rice11] demonstrated that the M2 phase could be stabilized by uniaxial stress and postulate this metastable M2 phase to be a Mott insulator, where electronic properties are significantly influenced by external forces.
For the understanding and the application of correlated electron materials (CEM), the electrical response to temperature and mechanical load is important. In particular, the coupling between the mechanical load, phase transformations and electronic properties can be difficult to determine in bulk materials. Recently, the synthesis of nanoscale one-dimensional single-crystalline structures strongly improved the opportunities to investigate and understand CEMs. When these are produced without preexisting defects, they can be subjected to extreme mechanical stresses without fracture, considerably exceeding the strengths of their bulk counterparts.[Reference Cao, Ertekin, Srinivasan, Fan, Huang, Zheng, Yim, Khanal, Ogletree, Grossmanan and Wu12–Reference Richter, Hillerich, Gianola, Monig, Kraft and Volkert15]
Most investigations to date have addressed the metal–insulator phase transition between M1 and R.[Reference Cao, Ertekin, Srinivasan, Fan, Huang, Zheng, Yim, Khanal, Ogletree, Grossmanan and Wu12, Reference Cao, Gu, Fan, Chen, Ogletree, Chen, Tamura, Kunz, Barrett, Seidel and Wu13] Only little work has been done on investigating the insulator–insulator transition between M1 and M2 and characterizing M2. However, the recent fabrication of nanostructured single crystals has spurred the detailed investigation of the M1–M2 transition.[Reference Jones, Berweger, Wei, Cobden and Raschke16–Reference Zhang, Chou and Lauhon18] The coexistence of tensile and compressive strain in bending experiments leads to the formation of M1, M2 and R phase at the same time,[Reference Cao, Gu, Fan, Chen, Ogletree, Chen, Tamura, Kunz, Barrett, Seidel and Wu13] and thereby severely complicating interpretation. In the literature, uniaxial stress–strain states are generally coupled with clamping and subsequent heating[Reference Zhang, Chou and Lauhon18, Reference Wei, Wang, Chen and Cobden19] or are already existent after growth.[Reference Jones, Berweger, Wei, Cobden and Raschke16] Just recently, Guo et al. reported on in situ transmission electron microscopy and x-ray diffraction tensile testing of VO2 nanowires using an indenter coupled to an MEMS-based push-to-pull device.[Reference Guo, Chen, Oh, Wang, Dejoie, Asif, Warren, Shan, Wu and Minor14] Mechanical and electrical data of the M1–M2 transition at constant temperatures are hereby essential for investigating the M2 phase itself and for a more comprehensive understanding of the phase transformations in VO2.[Reference Pouget, Launois, Dhaenens, Merenda and Rice11] Only with such studies will VO2 be viable as a CEM in new electronic devices.
Single-crystalline nanowires were grown in a tube furnace (see Supplementary material). Detailed information on the growth and the associated mechanisms can be found elsewhere.[Reference Cheng, Wong, Ho and Wang20, Reference Kim, Lee, Lee, Larson, Baik, Yavuz, Seifert, Vajda, Winans, Moskovits, Stucky and Wodtke21] Characterization by scanning electron microscopy (SEM) showed square or rectangular cross sections with the highest edge ratio observed to be 2:1. Edge lengths ranged from 50 to 600 nm and the overall length of the nanowires was between 5 and 50 µm. Figure S1 shows an SEM micrograph with several wires reaching over the edges of the sample. In contrast to the observations of others, growth was limited to regions close to the edges of the substrate. The inset of Fig. S1 shows a high-resolution SEM micrograph of the faceted surface of an individual wire, illustrating the high crystalline quality of the specimens. Energy-dispersive x-ray spectroscopy analysis confirmed the nanowires to be free of impurities within the detection limit. In electron backscatter diffraction all wires were found to be single crystalline and to be in the monoclinic M1 phase, all with the same [001] axial growth direction. A specific crystal orientation with respect to the substrate surface, as reported by Cheng et al.,[Reference Cheng, Wong, Ho and Wang20] was not observed. Instead, the nanowires seemed to be randomly oriented.
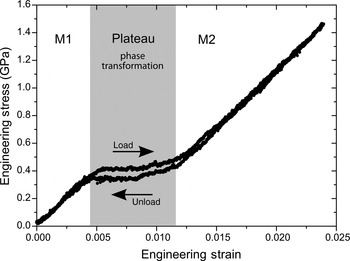
Mechanical tensile testing was carried out in 10 individual nanowires (see Supplementary material). The mechanical tensile setup, equipment and testing route are further described by Gianola et al.[Reference Gianola, Sedlmayr, Monig, Volkert, Major, Cyrankowski, Asif, Warren and Kraft22] Figure 1 shows an exemplary stress–strain curve, where the phase transition is highlighted. During straining, the wire shows linear-elastic behavior until a change in slope and a plateau occurs, which can be attributed to a phase transformation. On further straining the slope changes and, again, the wire shows linear-elastic behavior. On unloading, it can be seen that the transformation is fully reversible, showing only a small hysteresis at the plateau. A variation of the strain rates between 10−4 and 10−2/s did not change the mechanical response.
Stress–strain curve for one cycle of loading and unloading showing the superelasticity of VO2 nanowires. The curve shows the phase transformation from insulating M1 phase to insulating M2 phase upon mechanical straining. If the wire is unloaded the superelastic behavior of the material becomes evident.

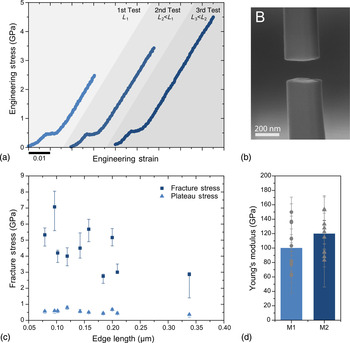
With the dimensions of the tested nanowires, the measured loads and displacements are transformed to engineering stresses and strains [Fig. 2(a)]. It is shown that the range of the plateau is about 0.5%, which has been found as the typical value for all nanowires. In most cases, the wire broke in several pieces not leaving fracture surfaces to be investigated. In cases where a long-enough part of the wire was retained, this part was regripped and pulled again until fracture. For all cases, this resulted in an increase in strength from test to test, as exemplified in Fig. 2(a). It can be seen that the tensile strength increases from 2.5 to 4.5 GPa with decreasing length. Figure 2(b) shows a characteristic fracture surface of a wire that is perpendicular to the wire axis confirming brittle fracture. Nominal fracture stresses of all pristine wires were found to lie between 2.5 and 7.1 GPa, the total strains were between 3.3 and 6.0%.
Stress–strain curves (a) of tensile tests show a plateau at 0.56 ± 0.13 GPa during phase transformation. The plateau strain is 0.52 ± 0.08% and the wire is pulled until brittle fracture. Three consecutive tests were performed on a single nanowire (a). The wire was regripped after the first and second tests. With each test the length of the wire decreased and the wire became stronger, fortifying the weakest-link behavior of this brittle material. In (b) the brittle fracture surface perpendicular to the tensile direction of a tested specimen can be seen. During all tests no signs of plasticity were observed. In (c) the fracture stress and plateau stress of all tested nanowires is plotted the size of their shorter edge. The error bars correspond to the uncertainty in the cross-sectional areas as measured by SEM. (d) Young's modulus of the M1 (100 ± 32 GPa) and M2 (120 ± 25 GPa) phases, as measured before and after the plateau. Besides one case, the modulus before the transformation has been determined to be smaller than after. The columns represent the mean average values for each phase.

If plateau and fracture stresses are plotted versus the edge lengths of the nanowires [Fig. 2(c)], it can be seen that the plateau stress is consistent at 0.56 ± 0.13 GPa and does not depend on size. The fracture strength increases with decreasing edge length, although there is significant scatter. Young's moduli measured before and after the plateau are shown in Fig. 2(d). For this, the linear regimes before and after the phase transformation were fitted. Besides one specimen, the modulus of the M1 phase was found to be lower than that of the M2 phase, the average values are 100 ± 32 and 120 ± 25 GPa, respectively.
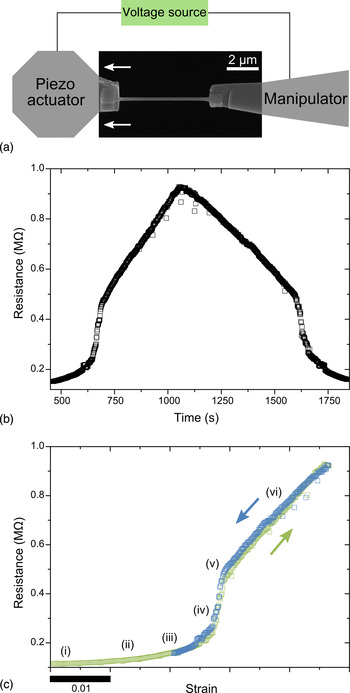
In the electrical measurements single nanowires were strained and the current was measured (see Supplementary material). A schematic of the testing setup is shown in Fig. 3(a). The resistance from the electrical measurements plotted versus time and tensile strain are shown in Figs. 3(b) and 3(c), respectively. A constant strain rate was applied, and micrographs were taken continuously. In the image sequences, it was observed that the wires were usually bent slightly before tensile testing (i). During initial displacement the wires were straightened, also with respect to preexisting misalignment (ii). When the wire was straight, further straining led to an increase in resistance (iii). At a certain point, a strong increase in resistance was observed (iv) and concurrently the wire was slightly oscillating in the images. After about 0.4% of further straining and a total increase of about 255 kΩ, the increase in resistance slowed down, and the oscillations in the image stopped (v). Then, the resistance was increasing linearly, again (vi), but with a steeper slope compared with regime (ii). When the strain was reversed, the resistance decreased in the same fashion as the increase had occurred indicating that the behavior is fully reversible. It can be seen that the strain of about 0.5% related to the phase transformation is consistent with the mechanical measurements.
(a) Setup for the electrical measurements performed on single nanowires. The SEM micrograph shows the nanowire gripped between two probes. The left side is fixed to a piezo actuator which applies displacement. A constant voltage is sourced and currents as small as several nanoamperes are measured. Electrical measurements performed on a single nanowire, which was cycled two times with consistent curves. The resistance over time for one cycle is shown in (b). In (c) the resistance is correlated with the strain obtained by DIC. During the phase transformation a strong increase in resistance can be observed.

The mechanical tensile curves of Figs. 1 and 2(a) suggest a first-order phase transition upon uniaxial tensile straining from the monoclinic M1 to the monoclinic M2 phase, as has been discussed before.[Reference Pouget, Launois, Dhaenens, Merenda and Rice11] In the mechanical data, the transition corresponds to a region in the stress–strain curve where the Young's modulus drops to zero. In this region, the M2 phase nucleates and spreads out until the entire matrix is transformed and the modulus deviates again from zero. As can be seen from Fig. 2(c), there is little or no size dependence of the stress required for this transformation.
Another interesting result is that the fracture strengths of the VO2 nanowires show significant scatter while the stress at which the phase transformation occurs is fairly constant for all wires. This indicates that the stochastic nature of the fracture strength is an intrinsic material effect not caused by experimental uncertainties in the experimental setup or the measurement of the cross-sectional area of the nanowires. Despite the scatter in strength, a trend for an increase in fracture strength with decreasing edge length is observed in Fig. 2(c). This trend could be discussed in the context of assuming that a weakest link, i.e., the largest preexisting defect in the nanowire, determines its strength. Typically, plotting fracture stress versus volume or surface area, or even wire length, can be helpful for identifying the nature of the defects when enough data are available. In our work, the weakest link concept seems to be relevant since consecutive testing of a single specimen shows rising strengths [Fig. 2(a)]. This is due to the fact that fracture always takes place at the weakest link of the wire. Once this defect is eliminated, a higher fracture stress for the remaining part of the wire is reached, which is now determined by the activation stress for the next weakest defect.
Using uniaxial tensile testing and means of digital image correlation for measuring the strain offers the possibility to measure Young's moduli for both VO2 phases. The values that we have determined are lower than 140 GPa as reported in literature for VO2 films, measured by nanoindentation. This could be related to the fact that in indentation an average value for an elastic anisotropic crystal is determined.[Reference Vlassak and Nix23] In contrast, we measure the modulus in [001]-direction, which could be a compliant direction. Also, the modulus measured in bending,[Reference Fan, Huang, Cao, Ertekin, Barrett, Khanal, Grossman and Wu24] with ~156 GPa for the insulating regime, cannot be employed for comparison, since always more than one phase exists. The moduli obtained in tension,[Reference Guo, Chen, Oh, Wang, Dejoie, Asif, Warren, Shan, Wu and Minor14] with 128 and 156 for the M1 and M2 phases, respectively, are still exceeding our values, while the level of plateau stress at which the transformation occurs is similar. This may be related to the different testing geometries and the difficulty to measure dimensions at these length scales with high accuracy.
Resistivity measurements in a VO2 nanowire have been performed for the first time. One concern with respect to the resistivity measurement is Joule heating due to the electrical current that is applied. Using the measured values of thermal conductivity of Berglund and Guggenheim[Reference Berglund and Guggenheim5] and Andreev et al.,[Reference Andreev, Chudnovskii, Petrov and Terukov25] we estimate Joule heating in a nanowire with edge lengths of 200 nm and an overall length of 5 µm to be less than 4 K for the most unfavorable assumptions. This indicates that thermal effects can be largely ignored in the electrical test.
The transformation itself is related to a strong increase in resistivity by a factor of about 3 from the M1 to the M2 phase. These results are very consistent with the findings of Cao et al.[Reference Cao, Gu, Fan, Chen, Ogletree, Chen, Tamura, Kunz, Barrett, Seidel and Wu13] who also saw a similar resistance change between the M1 and M2 phases. In addition, in the electrical measurements, mechanical oscillations of the wire were observed at the phase transformation. This may be explained by the vanishing Young's modulus which leads to resonances in the setup, which was used for applying strain, here. These oscillations do not occur in the stiffer system for the mechanical tests. For the M2 phase, the gauge factor, which relates the relative change in resistance to mechanical strain, was calculated to be 51 for this phase (1% of strain would lead to a relative increase in resistivity of 51%).
In summary, we have demonstrated that it is possible to use stress or strain instead of temperature to switch between phases, and thereby turn piezoresistivity on and off. This peculiar material behavior may lead to new applications, e.g., in mechanical sensors or transistors in NEMS devices.
Acknowledgments
We thank Sven Glatthaar and Holger Gesswein from IAM at KIT for assistance with the growth of the specimens. S.T.B. acknowledges the Alexander-von-Humboldt Foundation for their financial support.
Supplementary materials
For supplementary material for this article, please visit http://dx.doi.org/10.1557/mrc.2012.5