As the field of SLA continues to intersect with psycholinguistics and cognitive science, experimental standards have begun to emerge, highlighting the need for SLA research methods to become increasingly rigorous. Unlike native speakers, foreign- and second-language (L2) learners show tremendous variability in their language learning background and thus in their proficiency in the target language. In the context of the current study, proficiency is construed as an index of the comprehension and production abilities that L2 learners develop across linguistic domains (e.g., lexical competence, grammatical competence, discourse competence) and modalities (spoken and written) to communicate (e.g., Bachman, Reference Bachman, Harley, Allen, Cummins and Swain1990; Harley, Cummins, Swain, & Allen, Reference Harley, Cummins, Swain, Allen, Harley, Allen, Cummins and Swain1990). Factors external to the classroom, such as L2 learners’ age of first exposure to the target language, their length of residence in an environment where that language is spoken, and their percentage of weekly use of the target language, play an important role in determining their L2 proficiency (e.g., Birdsong, Reference Birdsong, Kroll and de Groot2005; Flege, MacKay, & Piske, Reference Flege, MacKay and Piske2002; Flege, Yeni-Komishian, & Liu, Reference Flege, Yeni-Komishian and Liu1999; Genesee, Reference Genesee1985; Johnson & Newport, Reference Johnson and Newport1989; MacKay & Flege, Reference MacKay and Flege2004). Hence, even in an instructed environment, L2 learners show variability in their proficiency due to these factors.
Because proficiency directly influences L2 learners’ performance on experiments, it follows that this variable should be characterized as precisely and accurately as possible in experimental research. However, there is a clear lack of uniformity in the methods that SLA researchers have employed to evaluate proficiency. Furthermore, classroom level and years of instruction in and on the target language (e.g., third-semester French, fifth-semester French—to avoid the often less transparent classroom-level terminology employed by institutions) are the most common estimates of proficiency that have been used in recent SLA research, despite the well-attested lack of homogeneity in proficiency that L2 learners exhibit in these groups. Experimental cross-sectional research that groups L2 learners accordingly may thus miss important developmental effects that could otherwise be captured if proficiency were assessed independently. This inadequate documentation of proficiency in SLA research can also make comparisons between studies difficult.
This study aims to sensitize SLA researchers to the importance of documenting and controlling for proficiency in experimental SLA research that seeks to explain the linguistic knowledge or behavior of L2 learners. It does so by proposing the use of cloze (i.e., fill-in-the-blank) tests as an efficient tool for grouping L2 learners into differing levels of proficiency and by demonstrating the validity, reliability, and practicality of a cloze test that Tremblay and Garrison (Reference Tremblay, Garrison, Prior, Watanabe and Lee2010) created for discriminating among adult L2 learners of French at the University of Illinois. The test was created in part because the first author needed a tool to group L2 learners into proficiency levels in her own cross-sectional research, and none was employed consistently in research on L2 French. As in Tremblay and Garrison, this study presents the benefits of grouping L2 learners by cloze-test level rather than by classroom level, but it also identifies specific cloze-test levels on the basis of a larger sample of L2 learners of French and examines the relationship between these levels and L2 learners’ identification of various language background variables. By showing how the cloze test was created and evaluated and by sharing the tool with scholars working with similar populations of L2 learners of French, it is hoped that this study will provide a methodological contribution to the field of SLA and help establish more robust proficiency assessment standards in SLA research.
SURVEY OF PROFICIENCY ASSESSMENT METHODS IN RECENT SLA RESEARCH
Beyond the initial state of SLA, defined for the purpose of this study as the first year of explicit instruction on the target language, L2 learners in a given classroom level rarely form a homogeneous group.Footnote 1 If these L2 learners were to complete an experimental paradigm for a given researcher, their proficiency would need to be assessed systematically. To determine whether this has become a standard in recent SLA research, a survey of studies published between 2000 and 2008 was conducted. The survey focused on research that sought to explain the linguistic knowledge and behavior of L2 learners. The studies were surveyed in three reputable journals: two SLA journals (Second Language Research and Studies in Second Language Acquisition) and one French language journal (French Language Studies). These studies stemmed from different frameworks (e.g., cognitive, generative) and had different foci (e.g., grammar, processing), but they were all SLA studies. The survey was limited to research reporting experiments with L2 learners over the age of 12 who were beyond their first year of explicit language instruction. It focused on teenage and adult L2 learners to ensure that the same proficiency tests could have been used with all of the nonnative participants. Studies testing L2 learners at the initial state were not included in the survey because these L2 learners’ proficiency may not need to be assessed. In a similar manner, studies using corpus data were excluded because researchers rarely have access to L2 learners in corpora and may therefore not be able to evaluate their proficiency. Additionally, studies focusing on L2 instructional methods were not surveyed, as it could be claimed that the point of these studies is to determine whether a given instructional method is effective irrespective of L2 learners’ proficiency. It should be noted, however, that the effectiveness of a given instructional method may be at least partially dependent on L2 learners’ proficiency, and so assessing proficiency independently would be useful even in these studies.
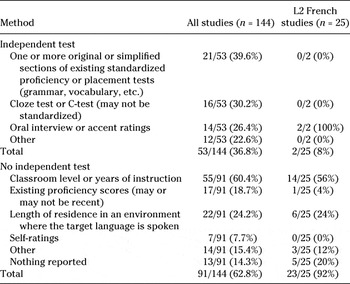
A total of 144 studies were included in the survey (61 from Second Language Research, 76 from Studies in Second Language Acquisition, and 7 from French Language Studies), 25 of which focused on L2 French. The studies were coded according to whether they assessed proficiency independently with a test. If they did, the test was identified; if they did not, the variables that were used to estimate proficiency were identified. The results of the survey are presented in Table 1. Within each assessment category (i.e., independent vs. no independent test), the sum of numerators is superior to the denominator because some studies used more than one method to estimate L2 learners’ proficiency.
Survey of proficiency assessment methods in recent SLA research (2000–2008)

As shown in Table 1, a little more than one third of all the studies—and only two L2 French studies—assessed L2 learners’ proficiency independently with a test. The most commonly used tests in these studies were one or more original or simplified sections of existing standardized proficiency or placement tests (e.g., Greek Language Proficiency Test, Michigan Test, Oxford Proficiency Test, Test of Adolescent and Adult Language, TOEFL—e.g., the reading comprehension section of the practice version—Woodcock Language Proficiency Battery), a cloze test or a C-test, and oral interviews (e.g., following the American Council on the Teaching of Foreign Languages guidelines; ACTFL, 1999) or accent ratings. Of the studies that did not administer a test, the majority estimated L2 proficiency on the basis of classroom level or years of instruction, followed by existing proficiency scores (typically TOEFL scores) and length of residence in an environment where the target language is spoken. A more precise classification of the proficiency assessment methods employed in these studies is difficult because many studies did not provide sufficient details about the proficiency tool or estimate they used (e.g., which sections of the standardized test had been used, whether the cloze or C-tests had been standardized, how the oral interviews had been conducted and rated, how the accent ratings had been collected and computed, whether the existing proficiency scores were recent).
The results of this survey underline the need for more SLA studies to assess proficiency independently with some sort of test. Although language learning variables such as years of instruction in and on the target language and length of residence in an environment where the target language is spoken generally correlate with proficiency in the target language (e.g., Flege et al., Reference Flege, MacKay and Piske2002, Reference Flege, Yeni-Komishian and Liu1999), their ability to predict proficiency may vary, and thus it is not always clear how these variables should be weighted for proficiency to be estimated accurately. Using an independent test to segment or group L2 learners by proficiency levels contributes to solving this problem, as it allows for an examination of the extent to which these variables correlate with test scores.Footnote 2 The survey results also highlight a lack of uniformity among researchers in their choice of proficiency assessment methods, particularly in their characterization of these proficiency tools or estimates and in their justification for using them. Although it may not be reasonable to expect all researchers to use the exact same proficiency assessment method, comparisons between studies—at least those that investigate the same target language—would be more amenable if there were at least some consensus on acceptable procedures that researchers could use to estimate proficiency and more consistency in the characterization of these procedures (for a discussion, see also Marian, Blumenfeld, & Kaushanskaya, Reference Marian, Blumenfeld and Kaushanskaya2007; Norris & Ortega, Reference Norris and Ortega2000). It is evident from these findings that SLA research would benefit from establishing more robust proficiency assessment standards.
CLOZE TESTS: A TOOL FOR SLA RESEARCH
Researchers working with populations of adult L2 learners beyond the initial state of acquisition do not always have access to standardized proficiency scores (such as the TOEFL) collected shortly (i.e., less than 3 months) before the study. To avoid the pitfalls of documenting proficiency inadequately, these researchers should find and administer a proficiency test that is sufficiently global (e.g., one that assesses not only morphosyntactic but also lexical and discourse competence) and meets validity and reliability standards for the targeted population of L2 learners while discriminating among L2 learners in it (for a discussion, see Brown, Reference Brown1996). Furthermore, this test should be completed within the time constraints of the researchers’ experimental paradigms. Even though standardized proficiency measures meet testing requirements, they are often not available to researchers and cannot be completed within a short amount of time. Cloze tests, on the contrary, can meet both testing and research requirements if they are designed carefully and validated against other criteria.
The use of cloze tests as a measure of proficiency is certainly not new. The cloze procedure was introduced by Taylor (Reference Taylor1957) and has been the object of much testing research since the 1970s (e.g., Jonz, Reference Jonz1976; Oller, Reference Oller1972, Reference Oller1973). Some researchers have proposed that cloze tests tap low-level lexical and grammatical competence (e.g., Alderson, Reference Alderson1979; Markham, Reference Markham1985; Shanahan, Kamil, & Tobin, Reference Shanahan, Kamil and Tobin1982), whereas others have argued that cloze tests can also measure higher level discourse competence (e.g., Bachman, Reference Bachman1982; Brown, Reference Brown and Oller1983; Fotos, Reference Fotos1991; Hanania & Shikhani, Reference Hanania and Shikhani1986; Jonz, Reference Jonz1990; Oller, Reference Oller1973). Although no firm consensus has been reached as to what aspects of linguistic competence cloze tests measure, their scores have been found to correlate highly with standardized proficiency scores. For example, in L2 French, Heilenman (Reference Heilenman1983) reported a correlation of .90 between cloze test scores and scores on the Modern Language Association Cooperative Foreign Language test. In a similar manner, in L2 English, Bachman (Reference Bachman1985) reported a correlation of .84 between cloze test and TOEFL scores (for similar findings, see Brown, 1983; Fotos; Hanania & Shikhani; Hinofotis, Reference Hinofotis, Oller and Perkins1980; Oller, Reference Oller1973). These high correlations have led language program administrators to use cloze tests as part of their placement exams, as the two measures provide similar outcomes. For example, the English Language Institute at the University of Hawai‘i uses a cloze test as part of its placement test for newly admitted students whose TOEFL scores are not sufficiently high to be exempted from English-as-a-second-language (ESL) courses. Cloze tests are also part of the placement tests that the University of Wisconsin-Madison administers for its German and Spanish programs. Although many continue to question the nature of the skills that cloze tests measure, their usefulness as part of placement exams does not appear to be controversial.
Testing research has further shown that cloze tests are internally consistent and can discriminate among L2 learners, and their internal consistency and discriminability do not necessarily vary across different cloze test formats. To illustrate, Bachman (Reference Bachman1985) compared L2 learners’ performance on English cloze tests in which words had been deleted as a function of their sequence in the text (i.e., every nth word, referred to as the fixed-ratio deletion method) or as a function of their nature or role in the text (referred to as the rational deletion method).Footnote 3 He found that both tests had an overall internal consistency of .86 (assessed with the Guttman split-half reliability estimate) and were able to discriminate among L2 learners, suggesting that the choice of deletion method had little impact on the reliability and discriminability of the test (for similar results, see Brown, Reference Brown and Oller1983; Chapelle & Abraham, Reference Chapelle and Abraham1990). Additionally, Brown (Reference Brown1980) compared L2 learners’ performance on English cloze tests on the basis of whether the test was scored using exact answers (i.e., the words that had been removed from the text), acceptable answers (i.e., alternative words that were judged to be acceptable in the lexical, morphosyntactic, and discourse context of the deleted words), or multiple-choice answers. He found that all three scoring methods yielded internally consistent cloze test results that could discriminate among L2 learners, with reliability estimates ranging from .82 to .95—assessed with both the split-half reliability estimate and the Kuder Richardson 20 (KR-20) reliability estimate. He also found that the acceptable-answers scoring method yielded the highest reliability estimates (split-half: .89; KR-20: .95) and discrimination indexes (mean item discrimination: .60) (see also Kobayashi, Reference Kobayashi2002). These results suggest that cloze tests with different formats may provide similar results.
The validity, reliability, and discriminability of cloze tests ultimately depend on the extent to which these tests are tailored for the targeted population of L2 learners. As Messick (Reference Messick and Linn1989) suggested, validity is not a property of a test but rather of the inferences made on the basis of the test (for a discussion, see also Chapelle, Reference Chapelle1999). For such inferences to be accurate, the cloze test must be neither too easy nor too difficult for the targeted L2 learners; otherwise, the test may not reveal much about these learners’ proficiency other than whether it meets a particular level. Cloze test scores are also more likely to be internally consistent and discriminate well among L2 learners if the distribution of scores approaches normality rather than if L2 learners score very high or very low on the test (for a discussion, see Brown, Reference Brown, Handscombe, Orem and Taylor1984, Reference Brown1988, Reference Brown2002). Several factors influence the difficulty level of cloze tests, including the reading passage (e.g., Chihara, Sakurai, & Oller, 1989; Jonz, Reference Jonz, Oller and Jonz1994; Sasaki, Reference Sasaki2000), the types of words removed from the text (e.g., Alderson, Reference Alderson1979; Brown, Reference Brown2002; Klein-Bradley, Reference Klein-Braley and Oller1983; Kobayashi, Reference Kobayashi2002), and the response format (e.g., Abraham & Chapelle, Reference Abraham and Chapelle1992; Brown, Reference Brown1980; Chapelle & Abraham, Reference Chapelle and Abraham1990). For instance, Brown (Reference Brown2002) compared L2 learners’ performance on five English cloze tests using the same text but in which different words had been deleted using the fixed-ratio deletion method. He found that not all the same cloze tests were equally reliable for the low- and high-level L2 learners tested, which suggests that deleting different content and function words in the text may alter the difficulty level—and thus the reliability and discriminability—of the test. Brown (Reference Brown1980) and Chapelle and Abraham (see also Abraham & Chapelle) reported that L2 learners of English score higher on cloze tests with multiple-choice answers than on cloze tests with open-ended answers (as might be expected). This indicates that the multiple-choice format may be more appropriate for lower level L2 learners than for higher level ones. As these examples illustrate, validity, reliability, and discriminability are intertwined concepts, each of which becomes affected if the difficulty level of the cloze test is not appropriate for the targeted population of L2 learners.
More than just a useful tool by testing standards, cloze tests are also a practical tool for research purposes: Unlike standardized proficiency tests—which at any rate are not always available to researchers—they can take a relatively short amount of time to complete (e.g., 15–35 min, depending on the difficulty level of the test). Their flexible format (e.g., choice of text, length of text, word-deletion ratio, scoring method) makes it possible to target a particular range of proficiency levels, and they are easy to create and score if clear scoring criteria are established. These advantages are certainly well known to some researchers, as shown by the number of surveyed studies that already employ cloze tests (or their counterpart, C-tests; Raatz & Klein-Bradley, Reference Raatz, Klein-Bradley, Culhane, Klein-Bradley and Stevenson1981) as a proficiency assessment method.Footnote 4 It should be noted that cloze tests can also be an efficient tool for target languages that do not use an alphabetical system (for examples of successful cloze tests in Japanese, see Douglas, Reference Douglas1994; Yamashita, Reference Yamashita1994).
The present study favors cloze tests over C-tests, simply because further research exists on the validity, reliability, and discriminability of cloze tests (for assessments of C-tests, see Chapelle, Reference Chapelle1994; Jafarpur, Reference Jafarpur1995). It also favors cloze tests over oral proficiency interviews following the well-established ACTFL Proficiency Guidelines for Speaking (ACTFL, 1999). Official ACTFL assessments are not always available to researchers, and it is much more difficult and time-consuming to train multiple raters to reliably evaluate oral proficiency than to design and administer a cloze test that may ultimately serve the same purpose—namely, to segment or group L2 learners according to language ability—just as reliably. However, the current study does not advocate the use of cloze tests as the only good proficiency assessment method for SLA research. Cloze tests are not appropriate for some populations of L2 learners (e.g., children, learners with poor literacy skills), and they may not provide a good estimate of oral proficiency. Instead, the current study argues for the necessity of assessing L2 learners’ overall proficiency with an independent test that is sufficiently global in the knowledge (morphosyntactic, lexical, and discourse competence) and abilities (comprehension and production) that it targets and demonstrates one way of doing so reliably and efficiently with college-level L2 learners.
METHOD
Participants
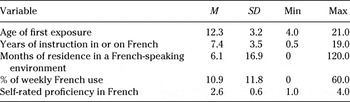
A cloze test was created for a population of L2 learners who have sufficient comprehension and production skills to complete psycholinguistic experiments in French. A total of 169 L2 learners of French (mean age: 21.5; range: 17–61; 51 males, 118 females) at the University of Illinois completed the test. Most of them (n = 151) were native English speakers. The remaining L2 learners were 4 native speakers of Spanish, 2 native speakers of Polish, 1 native speaker of Portuguese and English, 1 native speaker of Spanish and English, and 1 native speaker of each of the following languages: Albanian, Chinese, Czech, German, Indonesian, Korean, Luganda, Romanian, Russian, and Tamil.Footnote 5 The participants filled out a language background questionnaire to provide information such as their age of first exposure to French, the number of years of instruction received in and on French, the number of months spent in a French-speaking environment, their percentage of weekly French use, and their self-rated proficiency in French. Although proficiency self-ratings are a dependent rather than independent variable, they were considered together with the remaining language background variables because they are usually elicited in a similar fashion to biographical information and they are often used by SLA researchers as an independent variable. The language background information, summarized in Table 2, was collected to examine the relationship between these variables and L2 learners’ cloze test scores. It is important to note that the L2 learners were not required to complete a standardized proficiency test in French to be able to take French courses. Standardized proficiency scores were thus not available for them.
Participants’ language background information

Note
Self-rated proficiency in French: 1 = beginner, 2 = intermediate, 3 = advanced, and 4 = near-native.
As shown in Table 2, the sample of L2 learners examined in this study is very heterogeneous: L2 learners vary not only in the native language they speak but also in each of the numerical variables that characterize their learning of French. In typical experimental SLA research, treating such a sample as a single group would be quite problematic. In this study, however, to determine the extent to which the cloze test scores can successfully predict the variability in proficiency due to any language learning variables, it is very important that the sample of L2 learners surveyed be heterogeneous. Without such a sample, it would not be possible to determine whether cloze test scores can capture variability in proficiency.
To establish the extent to which the language background variables in Table 2 were related to one another and tapped into a single unitary construct—that of proficiency—a Cronbach’s alpha reliability analysis was conducted on these variables. A coefficient of .39 was found for the five variables, but if age of first exposure to French (the weakest loading variable in the factor analysis) is removed, the coefficient increases to .48. These results suggest that even though the language background variables are related to one another, they also show dissimilarities, which suggests that each variable may uniquely contribute to estimating L2 learners’ proficiency rather than all of the variables tapping into a single unitary construct.Footnote 6 A factor analysis conducted on the language background data further confirmed this: Of the single underlying factor that was found to account for 52.9% of all the variance in the language background information, years of instruction in French yielded the strongest positive loading coefficient (.903), followed by self-ratings of proficiency (.804), percent weekly use of French (.752), and months spent in a French-speaking environment (.637); age of first exposure to French yielded the weakest loading coefficient (–.460), one that is also negative given the inverse relationship between age of first exposure and proficiency in the L2 (e.g., Birdsong, Reference Birdsong, Kroll and de Groot2005; Flege et al., Reference Flege, Yeni-Komishian and Liu1999, Reference Flege, MacKay and Piske2002).Footnote 7 These results outline the unique contribution of each of these variables for estimating L2 learners’ proficiency. Using a regression analysis, z-scores were derived from this single underlying factor for each of the participants. This estimate of general language proficiency, which reflects the unique contribution of each of the language background variables, will be compared to two other estimates of language proficiency: classroom level (often used in L2 studies as a measure of proficiency) and cloze test scores.
Eighty-four of the participants were recruited specifically for assessing the benefits of grouping L2 learners by cloze test scores rather than by classroom level (Tremblay & Garrison, Reference Tremblay, Garrison, Prior, Watanabe and Lee2010).Footnote 8 They were recruited from four undergraduate-level courses: 17 from French 103 (Intermediate French I), 20 from French 207 (Grammar and Composition), 17 from French 414 (Advanced Grammar and Style), and 12 from French 421 (Techniques in Translation II). These courses were selected because each is a prerequisite for the one that follows, thus allowing for a wide range of proficiency levels to be observed. Additionally, 18 participants from graduate students and faculty members were recruited. The French 103 learners were included to assess the lower limits of the cloze test, whereas graduate students and faculty were recruited to ensure that the higher end of the proficiency spectrum would also be tested. The L2 learners in this subgroup (mean age: 22.1; range: 18–61; 34 males and 50 females) were 68 native speakers of English, 3 native speakers of Spanish, 2 native speakers of Polish, 1 native speaker of Portuguese and English, and 1 native speaker of each of the following languages: Albanian, Chinese, Czech, English, German, Indonesian, Korean, Luganda, Romanian, Russian, and Tamil. Their language background information and the broad proficiency estimates that were derived from this information in the larger sample of participants (in z-scores) are provided for each classroom level in Table 3.
Participants’ language background information by classroom level

Note
Self-rated proficiency in French: 1 = beginner, 2 = intermediate, 3 = advanced, and 4 = near-native.
As shown in Table 3, although the different classroom levels vary in the expected direction in terms of the individual language background variables, graduate students and faculty have a lower broad proficiency estimate than predicted at the onset of this study. An ANOVA conducted on these proficiency estimates reveals a main effect of classroom level, F(4, 74) = 33.196, p < .001,Footnote 9 with the post hoc Tukey reaching significance between all of the groups (p < .002) except between French 103 and French 207 (p = .643), between French 207 and French 414 (p = .106), and between French 414 and graduate students and faculty (p = .120). These results indicate that many adjacent groups do not vary significantly from each other on the broad proficiency estimates that were derived from the language background variables.
Materials
Tremblay and Garrison’s (Reference Tremblay, Garrison, Prior, Watanabe and Lee2010) cloze test was modeled after Brown’s (Reference Brown1980) cloze test.Footnote 10 It was created for a target population of adult L2 learners of French ranging from high beginner to near-native levels of proficiency. It was hoped that the test would discriminate among lower and higher level L2 learners who have the necessary comprehension and production skills to complete psycholinguistic experiments in French.
For the base text, a brief (314-word) nontechnical article about global warming was selected from the newspaper Le Monde (2007). Because the text was written for a general (rather than specialized) audience, it was judged by the author to be accessible in content to a population of college-level students. Words were deleted from the text using the rational deletion method so that a balanced proportion of content and function words could be elicited from L2 learners. The test had open-ended answers because this format provided a closer approximation to production skills than the multiple-choice format did. The test was piloted with five native speakers of French (two from Québec and three from France) and was revised once after the native speakers from Québec completed it and again after each native speaker from France completed it. The final version, provided in Appendix A, had 45 (approximately 1/7) words deleted, of which 23 were content (i.e., open-class) words (nouns, adjectives, main verbs, adverbs, etc.) and 22 were function (i.e., closed-class) words (determiners, pronouns, prepositions, auxiliaries, etc.).Footnote 11
A bank of acceptable answers was created on the basis of the participants’ responses, which was used for scoring the test. Despite the occasional difficulty involved in determining what is and is not an acceptable answer, scoring cloze tests on the basis of acceptable answers has more face validity, in that it is rarely the case that only one word is permissible in any given lexical, morphosyntactic, and discourse context. This scoring method was also found to yield a higher internal consistency and higher discriminability indexes in Brown’s (Reference Brown1980) study.Footnote 12 Responses were considered acceptable if they were judged by a native speaker of French (the author) as possible in the context of the missing words. For unclear cases, word usages and collocations were consulted in dictionaries. A descriptive approach to acceptability was adopted, and words that might have been considered incorrect on the basis of prescriptive rules were not necessarily rejected. For example, some L2 learners provided the word globale in économie globale “global economy” rather than the target word mondiale “world.” Although this borrowing from English could be considered improper French, économie globale was found on several nontranslated French Web sites and was therefore accepted. In a similar manner, because it is not uncommon for native speakers of French to make spelling and agreement errors in writing, such errors did not affect the acceptability of the word as long as they did not alter its pronunciation (e.g., missing plural –s and missing feminine –e after a vowel). The bank of exact and lexically acceptable answers is provided in Appendix B. It should be noted that many more acceptable answers exist when spelling and silent agreement errors are included.
Procedure
The participants who were recruited for assessing the benefits of grouping L2 learners by proficiency rather than by classroom level completed the cloze test in their respective classrooms during normal instruction time (undergraduate students) or in the investigator’s office (graduate students and faculty). The remaining participants completed the cloze test after completing other experiments in the Second Language Acquisition and Bilingualism Lab at the University of Illinois.Footnote 13 All of the participants completed the cloze test under similar conditions: in a quiet room and without any disruptions during the test. The participants were instructed to read the entire text before writing their answers. They were told they should write only one word in each blank. Although no time limit was imposed, the participants usually required between 15 and 35 min to complete the test. They were not allowed to use dictionaries or ask the meaning of any word that appeared in the text.
Data Analysis
One point was given for each acceptable response, and no points were given for unacceptable responses. The scores (i.e., the number of acceptable responses out of 45 deleted words) were then converted into percent accuracy rates to facilitate the interpretation of the results. All of the statistical analyses were performed with the Statistical Package for the Social Sciences (SPSS) software.
The results will be organized as follows. First, the distribution of cloze test scores will be presented for the entire sample of L2 learners and the validity of the scores will be assessed by examining the relationship between these scores and the broad proficiency estimates that were derived from the language background variables. Second, the results from an item analysis will be presented to demonstrate the internal consistency of the test and the difficulty and discriminability of the test items.Footnote 14 Third, the cloze test scores will be presented for the subset of L2 learners who were recruited in different classroom levels to show the extent of variability that characterizes such groups, and the item analysis will be repeated by classroom level to establish whether the test can also be used with L2 learners in smaller ranges of proficiency. Fourth, a k means cluster analysis will be performed on all the cloze test scores to identify subgroups in the distribution. The ideal number of cloze test levels will then be specified, and the number of levels will be validated against the broad proficiency estimates that were computed on the basis of the L2 learners’ language background variables.
RESULTS
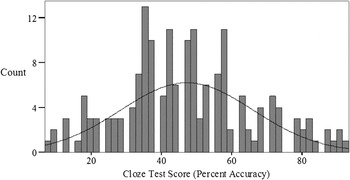
Figure 1 shows the frequencies of the cloze test scores (percent accuracy) obtained from all of the participants. As seen in Figure 1, the distribution of cloze test scores is reasonably centered: M = 47.2; standard error (SE) = 1.5—although somewhat skewed to the left (skewness = 0.29; SE = 0.19)—and it approaches normality in its spread (kurtosis = −0.25; SE = 0.37). These results indicate that L2 learners obtain a wide range of scores on the test, with more L2 learners obtaining scores in the bottom half of the range.
Distribution of cloze test scores.

In the absence of standardized proficiency scores for the present L2 learners, the broad proficiency estimates (z-scores) were entered into a linear regression analysis as a predictor of the cloze test scores. The results reveal a significant relationship between the two (constant: B = 47.86, SE = 1.04; factor: B = 13.71, SE = 1.05, β = .728, p < .001), with the model accounting for 52.7% of all the variation in the cloze test scores. The cloze test scores thus vary in the same direction as the broad proficiency estimates computed from the language background information, which suggests that the cloze test scores have at least some validity.
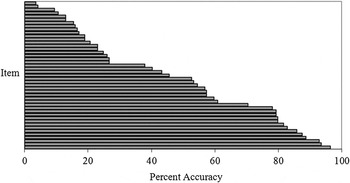
Moving on to the item analysis, Figure 2 shows the percent accuracy rates that each test item received across participants, with the most difficult items at the top of the graph and the easiest ones at the bottom. These values are presented next to their corresponding test item in Appendix C. As illustrated in Figure 2, the test items display a wide range of difficulty levels, which contributes to explaining why L2 learners obtained a wide range of scores on the test. A closer examination of the test items in Appendix C indicates that the participants obtained higher accuracy rates on function words (M = 57.6%; SE = 1.5) than on content words (M = 37.2%; SE = 1.5). A KR-20 reliability analysis conducted on all the results (45 items, 169 participants) revealed a coefficient of .92, which is very high by testing standards.Footnote 15 This indicates that the cloze test is internally consistent.
Difficulty level of the 45 test items.

To confirm that the cloze test indeed discriminates among L2 learners—because it should, given the wide range of levels targeted—item discrimination indexes were computed as follows: For each test item, the mean percent accuracy obtained by the lowest scoring third of all L2 learners (n = 56) was subtracted from the mean percent accuracy obtained by the highest scoring third of all L2 learners (n = 56) (for details, see Brown, Reference Brown2003). The mean, standard error, and range of the percent accuracy rates and of the discrimination indexes are summarized in Table 4 and listed for each test item in Appendix D. Although the discrimination indexes vary considerably, the mean discrimination index is comparable to that of other studies (see, e.g., Brown, Reference Brown1980, for cloze tests scored with the exact scoring method and multiple-choice answers; Brown, Reference Brown1988), and all of the individual values provided in Appendix D are positive. A closer inspection of the individual test items indicates that only six cloze test items have discrimination indexes below .20. This means that most of the test items discriminate well between lower and higher level test takers.
Item discrimination analysis

These analyses revealed a wide distribution of cloze test scores and a significant relationship between these scores and the broad proficiency estimates derived from the language background information, confirming that the cloze test scores have at least some validity. Moreover, the item analyses showed that the cloze test is internally consistent and discriminates well among low- and high-level test takers, suggesting that it is a reliable tool.
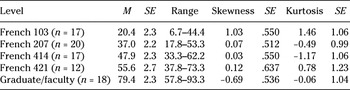
Moving on to the subset of L2 learners who were recruited specifically for assessing the benefits of grouping L2 learners by cloze test scores, rather than by classroom level, Table 5 presents the mean, standard error, and range of percent accuracy rates obtained on the cloze test as well as the skewness and kurtosis and their standard errors for each classroom level. The percent accuracy results in Table 5 show considerable variability within each classroom level and substantial overlap between classroom levels. The skewness analyses indicate that the L2 learners in the lowest classroom level generally score in the bottom half of their distribution, whereas those in the highest classroom level tend to score in the top half of their distribution. In contrast, the middle three classroom levels have fairly centered distributions. The kurtosis analyses show that the L2 learners in French 103, and to some extent those in French 421, have narrower distributions of scores, whereas those in French 414 have a widespread distribution of scores. In contrast, the L2 learners in French 207 and graduate students and faculty have distributions of scores that approach normality. An ANOVA performed on the scores with classroom level as a between-subject variable revealed a main effect of classroom level, F(4, 79) = 92.231, p < .001, with a post hoc Tukey test revealing significant differences between all of the groups (p < .008) except French 414 and French 421 (p = .195). Although most classroom levels differ significantly from one another in their cloze test scores, it is evident that grouping L2 learners by classroom level results in much within-group variability in the mean scores and some between-group variability in the way in which these scores are distributed.
Cloze test scores by classroom level

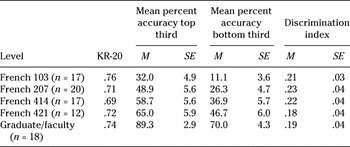
A second item analysis was conducted, this time with the subset of L2 learners grouped by classroom level, to determine whether the internal consistency and discriminability of the cloze test is sufficiently high for researchers to use it with L2 learners in a single classroom level. For each classroom level, a KR-20 reliability analysis was performed on the test items, and item discrimination indexes were established by subtracting the mean percent accuracy of the lowest scoring third of L2 learners from the mean percent accuracy of the highest scoring third of L2 learners.Footnote 16 The KR-20 coefficients as well as the mean and standard error values of the highest and lowest scoring third of L2 learners and of the discrimination indexes are provided in Table 6. As these results show, the internal consistency of the cloze test is lower when classroom levels are considered separately. This is partly due to the smaller range of variability that each classroom level shows. The reliability coefficients are, nonetheless, comparable to those provided in other studies (e.g., Brown, Reference Brown and Oller1983, Reference Brown1988; Jonz, Reference Jonz1976) and, with the exception of French 414, they meet the minimal requirement (.7) for items in a test to be considered internally consistent with one another (e.g., Miller, Reference Miller1995).Footnote 17 In a similar manner, the mean discrimination index is much lower for each classroom level than for the entire sample, hovering at around .20. These last results suggest that the cloze test does not discriminate very well among L2 learners within classroom levels. The test is thus more appropriate for discriminating among coarsely grained proficiency levels, but it could also be used for ensuring that participants within a single classroom form a homogeneous group with respect to their proficiency in French.
Reliability and item discrimination analysis by classroom level

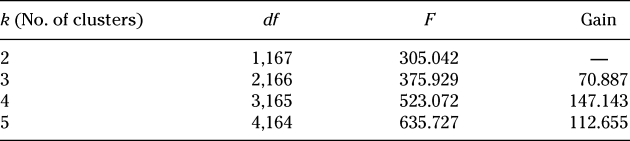
Given the large within-group variability in these results, in the absence of standardized proficiency scores it would be beneficial for research purposes to group these L2 learners by cloze test scores rather than by classroom level. One way to do so objectively and systematically is to use a k means cluster analysis—a procedure that has been employed by other SLA researchers (e.g., Ionin, Zubizarreta, & Maldonado, Reference Ionin, Zubizarreta and Maldonado2008). The k means cluster analysis identifies natural subgroups within the larger distribution of data. The task of the researcher is to find the ideal number (k) of clusters in the data—one that maximizes between-group variance and minimizes within-group variance. The analysis can be run in conjunction with an ANOVA in which cluster membership is the between-subject variable: Two clusters are specified in the initial analysis and one cluster is added to each subsequent analysis until the increase in the proportion of variance accounted for by the ANOVA begins to decrease (e.g., Calinski & Harabasz, Reference Calinski and Harabasz1974). It may be difficult to identify the number of clusters when the data do not contain well-defined subgroups. In this study, a conservative approach was adopted, which assumes that the selected number of clusters should depart as little as possible from the null hypothesis (i.e., that the data do not contain any subgroups). This conservative approach is appropriate, given the previous finding that the cloze test does not discriminate very well among L2 learners within the same classroom level.
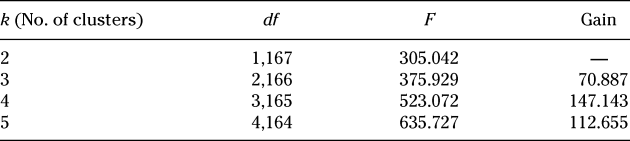
For the larger sample of participants, which is more representative of the targeted population of L2 learners, k means cluster analyses were conducted on all the cloze test scores to identify existing subgroups in the distribution. This was done with the goal of specifying cutoff points between cloze test levels that would be suitable for the present population of L2 learners of French. Table 7 presents the degree of freedom and quasi-F-value obtained for each number of clusters specified in the analyses as well as the gain in quasi-F-value obtained with each additional cluster. As can be seen in Table 7, four clusters represent the ideal number of cloze test levels in the data because it has the highest gains in quasi-F-value from the number of clusters preceding it, and its gain in quasi-F-value begins to decrease thereafter.
k Means cluster analysis on cloze test scores
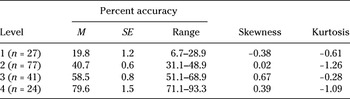
The distribution of the cloze test scores for each group identified by the cluster analysis (labeled as levels 1–4) is thus presented in Table 8. As shown in Table 8, the lowest and highest proficiency groups exhibit 24.4% ranges, whereas the two middle groups exhibit 20% ranges. The skewness analyses reveal a distribution of cloze test scores skewed to the right in level 1, centered in level 2, and somewhat skewed to the left in levels 3 and 4, paralleling the overall distribution (which is slightly skewed to the left). The scores in each level are widely distributed, but more so in levels 2 and 4 than in levels 1 and 3.
Cloze test scores by level

Following the identification of cloze test levels, the L2 learners’ language background information and the broad proficiency estimates that were derived from this information were reanalyzed. The results are provided for each of the newly formed groups in Table 9. As shown in Table 9, the broad proficiency estimates vary in the same direction as the cloze test levels. An ANOVA on these broad proficiency estimates reveals a significant effect of cloze test level, F(3,150) = 53.291, p < .001,Footnote 18 with a post hoc Tukey test revealing significant differences between all of the groups (p < .001). Assuming that the language background variables are at least to some extent representative of the L2 learners’ proficiency, these results clearly show that forming proficiency groups on the basis of cloze test scores has more validity than forming proficiency groups on the basis of classroom levels.
Language background information by cloze test level

Note
Self-rated proficiency in French: 1 = beginner, 2 = intermediate, 3 = advanced, and 4 = near-native.
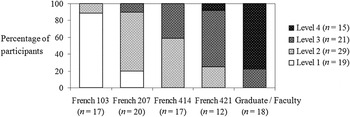
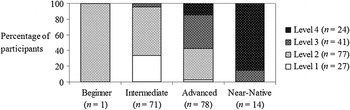
An examination of the L2 learners’ cloze test level as a function of their classroom level and self-rated proficiency further illustrates the extent of variability that characterizes such groups. Figure 3 presents the distribution of participants in each cloze test level as a function of their classroom level (for the subset of L2 learners who were recruited from different French courses), and Figure 4 illustrates the distribution of participants in each cloze test level as a function of their self-rated proficiency (for the entire sample of participants). In Figure 3, each classroom level contains L2 learners in at least two and sometimes three cloze test levels, indicating again that even though their cloze test scores increase with classroom level, they also vary within such levels. In a similar manner, the advanced self-rated proficiency category in Figure 4 contains L2 learners in as many as four cloze test levels. These last results are not surprising: Many studies have shown that although self-ratings generally correlate with proficiency as measured by independent tests, they do not always provide a precise estimate of proficiency (e.g., Delgado, Guerrero, Goggin, & Ellis, Reference Delgado, Guerrero, Goggin and Ellis1999; Flege et al., Reference Flege, MacKay and Piske2002; Jia, Aaronson, & Wu, Reference Jia, Aaronson and Wu2002; for a more reliable self-assessment questionnaire that also includes language background information, see Marian et al., Reference Marian, Blumenfeld and Kaushanskaya2007). All of these findings suggest that grouping L2 learners by cloze test scores is, overall, a better alternative.
Cloze test level assignments within classroom levels.

Cloze test level assignments within self-rated categories.

DISCUSSION
These results indicate that the cloze test that Tremblay and Garrison (Reference Tremblay, Garrison, Prior, Watanabe and Lee2010) have developed for assessing the proficiency of adult L2 learners of French meets both testing and SLA research standards. First, the cloze test scores appear valid, in that a significant relationship was found between them and the participants’ broad proficiency estimates derived from their language background information. Second, the cloze test is reliable, as shown by its overall internal consistency, and it has the ability to discriminate among L2 learners in different proficiency levels, which yields a wide distribution of scores both by participant and by item. Because this ability decreases substantially for L2 learners within a single classroom level, the cloze test will be more suitable for discriminating among lower and higher level L2 learners or for ensuring that the participants within a given classroom level are homogeneous in their proficiency. For example, if researchers at two different institutions wished to collaborate in a study on the acquisition of French and recruit fifth-semester French students for it, the cloze test would provide a means to validate that the classroom levels are indeed equivalent and exclude outliers accordingly. Third, the cloze test is practical; L2 learners take less than 35 min to complete it. It can therefore easily be incorporated into existing experimental paradigms. All in all, the present cloze test is an excellent tool for segmenting or grouping L2 learners of French into proficiency levels for the purpose of experimental research. Using such a test can help reduce the within-group variability that would otherwise be observed if the L2 learners were grouped by classroom level, and it can circumvent the difficulty involved in grouping L2 learners solely on the basis of individual language background variables.
To identify subgroups in the distribution of cloze test scores, k means cluster analyses were used. The analysis yielded four cloze test levels, which were found to be significantly different from one another on the broad proficiency estimates computed from the language background information. The resulting levels were conveniently labeled as levels 1–4, but following the ACTFL guidelines (ACTFL, 1999, 2001), it would be useful to bookmark these levels to scale descriptors such as novice high, intermediate low, intermediate high, and advanced. At the lower end of the proficiency spectrum, many L2 learners categorized as novice high were recruited from French 103, which is third-semester French. Their proficiency in French may therefore be considered as somewhat more advanced than that of true novice learners. As they have already learned survival skills in French, these L2 learners were able to provide some of the basic function words on the cloze test (e.g., the auxiliary a “has” in a provoqué “has provoked,” which, here, means provoked), and they were able to supply predictable content words (e.g., ans “years” in après trente ans de progrès “after thirty years of progress”). At the higher end of the proficiency spectrum, many of the L2 learners categorized as advanced were graduate students and faculty who accepted to complete the cloze test for the purpose of this research. These learners provided a large number of accurate responses, many of which required them to have knowledge of less frequent grammatical collocations, such as the prepositions selected by given nouns in French (e.g., capacité à or capacité de “capacity to,” not capacité pour “capacity for”). Some of these learners may well be at a near-native proficiency, but labeling them as such would require further testing, including in the spoken modality. The category advanced makes fewer assumptions for this group and encompasses those L2 learners whose proficiency may not quite reach the near-native level. These labels ultimately have little importance, in that L2 learners’ proficiency is often considered in relation to the environment in which they are tested (a given L2 learner may be considered advanced in a foreign language setting in which the target language is not spoken but intermediate in a L2 setting in which the target language is spoken). What matters is that L2 learners in distinct levels be categorized differently to capture developmental effects.Footnote 19
As shown by the survey of proficiency assessment methods in recent SLA research, it is quite common for researchers to estimate L2 learners’ proficiency on the basis of language background variables such as classroom level, years of instruction in or on the target language, and length of residence in an environment where the target language is spoken. Although these variables generally correlate with proficiency, the extent to which they can predict it very much depends on the context in which the target language is learned. For example, years of instruction in or on French appears to be an excellent predictor of cloze test scores for the targeted population of L2 learners in this study. This is in part due to the fact that these L2 learners are college-level students who learned French as a foreign language in the United States and received most of their French input from the classroom. Given this population of L2 learners, it would be unrealistic to expect little or no relationship between years of instruction in or on French—or even classroom level—and cloze test scores. In a context in which L2 learners begin learning French at the same age and receive more or less the same amount of instruction until they finish high school (e.g., in Canada), years of instruction in or on French will not be a good predictor of cloze test scores, as L2 learners will show much less variability on this factor. In such a context, other variables, such as length of residence in an environment in which the target language is spoken and percent weekly use of the target language, may be better predictors of proficiency if L2 learners show sufficient variability on these variables (for such results with L2 English in Canada, see Tremblay, Reference Tremblay2007). In other contexts, different L2 learners may show variability on distinct language learning variables, in which case it has to be determined how much weight each variable should contribute to the overall proficiency estimate. A potential solution to this problem is to compute broad proficiency estimates in a factor analysis conducted on the basis of all of the language learning variables, but using this as the main measure of proficiency may raise other questions, as it is based on self-reported data. Assessing proficiency with a cloze test solves these problems and allows for an examination of the relationship between these variables and the cloze test scores.
The present study is, of course, not without limitations. It should be acknowledged that a comparison of the cloze test scores to standardized proficiency scores would have strengthened the validity of the cloze test, but such scores were not available for the population of L2 learners targeted in this study. Even if such scores had been available, it might have been difficult to obtain them for research purposes other than from the participants themselves, who may not have known the scores or remembered them. This is a typical situation with which researchers are faced—but one that should not prevent them from assessing their participants’ proficiency. As Chaudron (Reference Chaudron, Doughty and Long2003) emphasized, triangulation should be a requirement of L2 research methods, including proficiency assessment and especially for cloze tests. Given the validity issues that surround the use of these tests as proficiency assessment tools, cloze test scores should be validated against other criteria, such as language background variables, native-speaker judgments (e.g., oral proficiency assessments), overall response times on experiments (higher level L2 learners should be faster than lower level L2 learners), and so forth. Because this research focused on a single population of L2 learners of French, triangulation is also recommended for researchers who use the present cloze test with a different population of L2 learners of French. The present study used a simple custom-made language background questionnaire, but other useful and more detailed tools to collect such information include the Language Contact Profile questionnaire (Freed, Dewey, Segalowitz, & Halter, Reference Freed, Dewey, Segalowitz and Halter2004) and the Language Experience and Proficiency Questionnaire (Marian et al., Reference Marian, Blumenfeld and Kaushanskaya2007).
A second potential concern with the use of cloze tests as a proficiency assessment tool in SLA research is that they do not measure language skills in the spoken modality. For studies that investigate this modality, this can be a serious limitation. A possible solution to this problem—one that can potentially also strengthen the validity of cloze tests—is to use a cloze test alongside an aural or oral task, such as a listening comprehension or a perception task, or a read-aloud task in which L2 learners’ foreign accents are judged by native speakers. For example, Tremblay (Reference Tremblay2007, Reference Tremblay2008, Reference Tremblay2009), who investigated the perception and processing of word stress in L2 English, measured the L2 learners’ proficiency on the basis of cloze test scores and native speakers’ judgments of the L2 learners’ foreign accents in an audio-recorded read-aloud task (for a similar judgment task, see Colantoni & Steele, Reference Colantoni and Steele2007). The accent ratings moderately correlated with the cloze test scores (r = .43, p < .001). Using the two measures conjointly allowed for a rather global characterization of L2 proficiency and proved to be better than using one measure alone. The advantage of using these two tasks over an oral proficiency interview is that these two tasks are easier to administer and do not require special training on the part of native speakers. Using cloze tests alongside aural or oral tasks can also help avoid the potential circularity involved in limiting proficiency assessment to aural or oral skills in studies investigating L2 learners’ development of particular aural and oral abilities.
A third potential concern that might arise from this study is the fact that some of the low-level L2 learners—in particular, those recruited from French 103—scored poorly on the cloze test. It may be questioned whether administering the present cloze test to such L2 learners is ethical, as the participants will not gain anything from it, and for that matter, nor will the researchers (for discussion of related issues, see Shohamy, Reference Shohamy1997). The present cloze test was designed for L2 learners who have sufficient comprehension and production skills to complete psycholinguistic experiments in French. It became obvious, after the administration of the test, that some students in French 103 barely met these minimal requirements. Although the test was not created specifically for L2 learners at such a level and thus cannot be used to discriminate among them, it can be used as a screening tool to determine whether L2 learners have sufficient knowledge of French to participate in a given study. It is also a good idea to warn the participants that the cloze test is meant to be difficult and that they should not be discouraged by it.
CONCLUSION
Documenting and controlling for L2 learners’ proficiency in the target language should no longer be optional in experimental SLA research that seeks to explain the linguistic knowledge and behavior of L2 learners. The present study showed one way to create and evaluate a test designed for such purposes. It demonstrated how the validity, reliability, and discriminability of a cloze test can be assessed and it made the tool available for researchers who would like to use it with a similar population of L2 learners of French. Providing adequate proficiency estimates that meet both testing and research standards can not only enhance the interpretation of experimental results but also decrease the disparity between the proficiency assessment methods used in SLA research and thus facilitate comparisons between studies. Such standards are fortunately within reach.
APPENDIX A
CLOZE TEST
Le taux de CO2 dans l’atmosphère augmente plus vite que prévu
La croissance économique mondiale ___(1)___ provoqué un accroissement de ___(2)___ teneur en dioxyde de ___(3)___ (CO2) dans l’atmosphère beaucoup ___(4)___ rapidement que prévu, selon une étude ___(5)___ lundi dans les comptes rendus de l’Académie ___(6)___ des sciences des États-Unis.
Cette étude ___(7)___ que la concentration des émissions ___(8)___ gaz carbonique dans l’atmosphère a ___(9)___ de 35% en 2006, entre le début ___(10)___ années 1990 et les ___(11)___ 2000-2006, passant de 7 à 10 milliards de tonnes ___(12)___ an, alors que le protocole de Kyoto prévoyait ___(13)___ en 2012, ces émissions responsables ___(14)___ réchauffement climatique devaient ___(15)___ baissé de 5% par ___(16)___ à 1990. “Les améliorations dans l’intensité carbonique de l’économie ___(17)___ stagnent depuis 2000, après trente ___(18)___ de progrès, ce qui a provoqué cette ___(19)___ inattendue de la concentration de CO2 ___(20)___ l’atmosphère”, indique dans ___(21)___ communiqué le British Antarctic Survey, ___(22)___ a participé à cette étude.
___(23)___ les chercheurs, les carburants polluants ___(24)___ responsables de 17% de cette augmentation, ___(25)___ que les 18 % restant sont ___(26)___ à un déclin de la capacité des “puits” naturels comme ___(27)___ forêts ou les océans ___(28)___ absorber le gaz carbonique. “ ___(29)___ y a cinquante ans, pour chaque tonne de CO2 émise, 600 kg ___(30)___ absorbés par les puits naturels. ___(31)___ 2006, seulement 550 kg par tonne ont été ___(32)___, et cette quantité continue à baisser”, explique ___(33)___auteur principal de l’étude, Pep Canadell, du Global Carbon Project. “La baisse de l’efficacité ___(34)___ puits mondiaux laisse ___(35)___ que la stabilisation de cette ___(36)___ sera encore plus ___(37)___ à obtenir que ce que l’on pensait jusqu’à ___(38)___”, indique pour sa ___(39)___ le British Antarctic Survey.
Ces ___(40)___ obligent à une révision à la hausse ___(41)___ prévisions du Groupe intergouvernemental d’experts ___(42)___ l’évolution du climat qui, dans son ___(43)___ de février, tablait sur l’augmentation de la température ___(44)___ de la terre de 1,8°C à 4°C ___(45)___ l’horizon 2100.
ENGLISH TRANSLATION
The Level of CO2 in the Atmosphere Increases More Rapidly than Forecasted
The world economic growth ___(1)___ created an increase in ___(2)___ level of ___(3)___ dioxide (CO2) in the atmosphere much ___(4)___ rapidly than anticipated, according to a study ___(5)___ on Monday in the reports of the United States ___(6)___ Academy of Sciences.
This study ___(7)___ that the amount of emissions ___(8)___ carbon dioxide in the atmosphere has ___(9)___ by 35% in 2006, between the beginning ___(10)___ the 1990’s and of ___(11)___ 2000-2006’s, going from 7 to 10 billions of tons ___(12)___ year, whereas the Kyoto protocol had anticipated ___(13)___ in 2012, the emissions responsible ___(14)___ global warming should ___(15)___ decreased by 5% as ___(16)___ to 1990. “The improvements in the intensity of carbon dioxide for the ___(17)___ economy have stagnated since 2000, after thirty ___(18)___ of progress, which has triggered this unexpected ___(19)___ in the amount of CO2 ___(20)___ the atmosphere” , indicates in ___(21)___ press release the British Antarctic Survey, ___(22)___ participated in this study.
___(23)___ to researchers, polluting carbon emissions ___(24)___ responsible for 17% of this increase, ___(25)___ the remaining 18% are ___(26)___ to a decline in the capacity of natural “wells” such ___(27)___ forests or oceans ___(28)___ absorb carbon dioxide. “Fifty years ___(29)___ , for each ton of CO2 released, 600 kg ___(30)___ absorbed by the natural wells. ___(31)___ 2006, 550 kg per ton were ___(32)___ , and this amount continues to decrease,” explains ___(33)___ main author of the study, Pep Canadell, of the Global Carbon Project. “The decrease in the efficiency ___(34)___ the world wells suggests ___(35)___ the stabilization of this ___(36)___ will be even more ___(37)___ to obtain than what we thought up until ___(38)___ ,” indicates, on the other ___(39)___ , the British Antarctic Survey.
These ___(40)___ force a revision at a higher level of ___(41)___ forecast of the Intergovernmental ___(42)___ Group on climate change which, in their February ___(43)___ , estimated an increase of the ___(44)___ earth temperature from 1,8°C to 4°C ___(45)___ the 2100 horizon.
APPENDIX B
BANK OF EXACT AND LEXICALLY ACCEPTABLE ANSWERS

APPENDIX C
DIFFICULTY LEVEL OF THE 45 TEST ITEMS (N = 168)

APPENDIX D
DISCRIMINATION INDEXES OF THE 45 TEST ITEMS (N = 112)

Note
DI = discrimination index.