

While formation is generally recognized as an essential component for making archaeological inferences, it is not given as much attention as other areas of archaeological interpretation [Davies Reference Davies, Matsumoto and Uleberg2018:483–484].
Most archaeologists acknowledge formation theory's value in the abstract. Yet it remains underused long after its origin, often avoided as mere “artifact physics” or spoiler of beautiful theories (Davies Reference Davies, Matsumoto and Uleberg2018:484). Formation theory nevertheless is vital to grounded archaeological inference. In turn, ethnoarchaeology is essential to formation theory, providing much of the data required for its testing. Nowhere are formation theory and ethnoarchaeology more important than in pottery analysis.
Pottery carries a heavy burden of archaeological inference. Common uses include seriation to measure past time or, among evolutionary archaeologists, transmission processes and interactions among past cultures. Pottery quantity registers the size of resident populations or settlement occupation spans. Assemblages reveal patterns of activity, such as how important food storage was. Owing to its abundance and imperishability, archaeologists analyze pottery for these and other good reasons.
Yet inferences are indirect because the archaeological record complexly refracts, not directly reflects, structure and process of ancient cultures. Pottery assemblages vary in size and composition in ways that reflect time and transmission, activity variation, and population. But assemblages are not simple products of these factors. Their size and type proportions influence seriation, quantity, and activity inference but are not direct reflections of proportions in use. Sizes of discarded assemblages are joint products of number of users but also of vessel use life, their type proportions of rate of use but also use life.
Whatever we know about how pottery was made, distributed, and used, every vessel in the record experienced a final stage after use: discard. As Gamble (Reference Gamble1986:275) states, the “general problem of what exactly leads to discard . . . although it might seem an obvious and fundamental question in archaeology has largely been ducked.” Decades later, use life remains “essential to establish” yet “is rarely discussed in archaeological context” (Vieugué Reference Vieugué2014:625); still we duck the question. We must know use life to make many “justified inferences” (Arnold Reference Arnold1988:357) from ceramic and other assemblages.
This article concerns use life as abstract concept and measurable quantity. It derives from a broader longitudinal ethnoarchaeological study conducted in highland Michoacán, Mexico (Shott Reference Shott2018). Its purposes are (1) to characterize use life more fully than previously attempted, (2) to justify use life's importance in detail, (3) to demonstrate briefly uncommon methods of analyzing use-life distributions, and (4) to argue for distributions’ qualified accessibility from the record.
Defining Use Life
Schiffer's definition of use life—“the average length of time that elements of a type are in use” (Reference Schiffer1976:60)—is accurate but incomplete. Strictly, the definition pertains to types, but use life commonly indicates also the longevity of individual objects, which may not equal their type means. Whatever archaeologists know about ancient pottery production, design, and use, we know less about how long it lasted and why it was discarded. Thus, use life is among “the more important of the factors governing the relationship between the ceramics in use and that recovered from archaeological contexts” (Orton et al. Reference Orton, Tyers and Vince1993:207). Yet discard can be provisional—sherds from the same vessels entering the record at different times and places by different paths (e.g., Deal Reference Deal1998; Hayden and Cannon Reference Hayden and Cannon1983). The range and complexity of discard processes require detailed study (Beck Reference Beck2006); acknowledging them, this study follows Philip Arnold (Reference Arnold1988) in measuring use life from introduction to failure of the original vessel in quotidian utilitarian pottery. The current stage of theory development justifies the vessel focus of ethnoarchaeological research, and it may encourage similar refocusing among analysts. Ceramic formation theory must explain vessel use life before attending to the even greater complexities of sherd reuse.
Vessel “use life” is a deceptively complex concept, begging questions of measurement and characterization. For comparison between types and between pottery and other artifact categories, use life should be measured in time, as Schiffer suggested, not other currencies. (Number of discrete uses may be relevant to some stone tools and perhaps to cooking vessels, but what constitutes a single use for storage vessels is unclear.) Use life is described, in part, by central-tendency measures such as average failure age calculated over sets of vessels (henceforth, use-life scale). But mean or median use life alone obscures variation between individual vessels and types, and dispersion around scale. Some vessels of a type may have short use lives, whereas others have long ones; use life is a probabilistic quantity that averages capture imperfectly. In some types, specimens typically fail gradually by attrition; in others, abruptly by chance.
Therefore, adequate characterization and measurement of use life involves scale but also a little-appreciated property: distribution of age at failure among specimens. The shapes of use-life distributions describe the relative frequency of individual vessels’ failure around the mean. Shape of age-at-death distributions is as important as scale; paleodemographers, for instance, do not consider mean life expectancy at birth adequate to characterize burial populations. Similarly, whatever a vessel type's mean use life, variation around it should be characterized as distributions of age at failure. Median attained age (not use life) of Shipibo ollas ranged from 0.88 to 1.38 years, but distribution of values around the median more fully characterized longevity (DeBoer and Lathrap Reference DeBoer, Lathrap and Kramer1979:Table 4.5, Figure 4.5). Distributions can be plotted and compared but not analyzed as integral wholes. They can be fitted to models that describe them efficiently in few parameters, contain theoretical content by which to identify causes of vessel failure, and facilitate comparison of parameters between assemblages (Hatch et al. Reference Hatch, Stephen, Whittington and Dyke1982:337).
Human death-age distributions must be inferred from age-related osteological changes. Stone tool use-life distributions can be inferred from degree or pattern of reduction (Douglass et al. Reference Douglass, Lin, Braun and Plummer2018; Morales Reference Morales2016; Shott and Seeman Reference Shott and Seeman2017). Until the relationship between vessel age and wear develops beyond its promising start (Skibo Reference Skibo1992), ceramic use-life distributions remain elusive except in ethnoarchaeological context. Yet inferential paths to archaeological distributions are considered below.
Why Use-Life Mean and Distribution Matter
Any interpretation of the past based on ceramic frequencies must consider . . . the potential affects [sic] of vessel longevity . . . on the archaeological record [Arnold Reference Arnold1988:377].
Affecting both the size and composition of assemblages, use life must be studied in the context of formation theory. Use life is observed directly only in ethnoarchaeological context, where “both cause and effect can be monitored” (Arnold Reference Arnold, VanPool and VanPool2003:57). Ethnoarchaeology, no mere catalog of cautionary tales, is integral to formation theory, establishing “causal relationships between behavior” (Arnold Reference Arnold, VanPool and VanPool2003:63) and material evidence.
Models of assemblage formation identify causes and clarify their complex effects, establishing the broader context of use-life analysis. For ceramic assemblages, Shott (Reference Shott2018:12–15) surveyed relevant literature, starting with Schiffer's (Reference Schiffer1976:60) discard equation. This expression, like much archaeological formation theory, may seem old today. Its application scarcely is “routine” (Ortman Reference Ortman2019:5), but the discard equation has experienced some use.
Schiffer distinguished between “systemic” and archaeological contexts. The first, artifacts in use in their characteristic frequencies and patterns of association, is DeBoer's (Reference DeBoer, Moore and Keene1983:Figure 2.1) “behavioral” and Orton's (Reference Orton1993:178) “life” assemblages; the second is Cowgill's (Reference Cowgill1970) “physical-consequences population,” DeBoer's “discard,” and Orton's “death” assemblages. Schiffer's goals were to trace connections between systemic and archaeological contexts and to explain their differences in, for instance, proportions of artifact types. The discard equation is

where TD is the total quantity of an artifact type discarded over time t, S is the systemic number (the number of specimens of the type ordinarily in use), and L is mean use life. (Henceforth, L denotes use life in the abstract or individual objects’ completed lives, whereas L $\bar{x}$ denotes mean use life of failed vessels [Table 1].) David's (Reference David1972:142; see also Mills Reference Mills1989:136) more involved equation used median (LMED), not L $\bar{x}$
 , to estimate the progressive divergence of in-use and discard vessel-type proportions.
Text Notation for Analytical Quantities.

The discard model's simple algebra masks two deceptively profound implications captured in the epigram above. First, a type's archaeological frequency TD is not a simple function of its frequency of use S, but a compound function of S, L, and accumulation span t. Second, types that differ in L also differ in TD unless S differs in inverse degree. Undeniably, donor and curate behavior complicate the discard equation (Varien and Mills Reference Varien and Mills1997:161); its virtue is its deliberately simplified model of the relationship between key quantities.
Hildebrand and Hagstrum (Reference Hildebrand and Hagstrum1999:29–30) advocated L $\bar{x}$ over L MED, demonstrating systematic differences between measures that varied with the factors—chance versus attrition, chiefly—that determined discard of different vessel types. (Yet L distributions can be skewed, possibly favoring medians as central-tendency measures.) Their view emphasized the importance of L distributions and the factors governing them. Peña (Reference Peña2007:Figure 11.2) and Lawall (Reference Lawall, Lawall and Lund2011:Figure 4; see also Needham and Spence Reference Needham and Spence1997:Figure 1) refined Schiffer's (Reference Schiffer1976:Figure 4.1) flowchart model by detailing the kind and strength of recycling and other processes that play out between first use and discard. Lawall's model scaled Schiffer's time axis, incorporated production failures, specified a range of vessel uses and final destinations, and roughly quantified the proportional effect of the various use and reuse processes. Thus, it integrated Schiffer's quantitative discard and qualitative flow models.
Ammerman and Feldman's (Reference Ammerman and Feldman1974) matrix model was devised for stone tools but encompasses all artifact types (Shott Reference Shott2018:14), expanding the discard equation's scope from single types to the sets of them that form assemblages. The model demonstrates algebraically that the archaeological abundance of sets of types owes not to each one's frequency of use alone but also to its L (rendered as discard rate d) and to what archaeologists later would call “technological organization”—that is, how tools “mapped onto” tasks. It explained why assemblage composition is more than a simple function of activity frequency.
The discard equation makes clear the logic that underlies formation theory's role in calibrating ceramics to population: more pottery equals more people or time only if pottery is consumed and discarded at constant rates. The matrix model clarifies the logic of activity inference from ceramic assemblages: use rates and L together, not the former alone, determine vessel-type discard rates and the size and composition of resulting assemblages. L also affects rate of pottery production, which in turn influences technology and organization of production (Arnold Reference Arnold1985) and rates of trait transmission (Porčić Reference Porčić2015:1075).
Combined, the models specify L's effects on seriation independent of time (David Reference David1972; Hatch et al. Reference Hatch, Stephen, Whittington and Dyke1982:347; Shott Reference Shott2018:17–21; Varien and Mills Reference Varien and Mills1997). DeBoer (Reference DeBoer1974) doubted such effects because L $\bar{x}$ often is short and occupation spans longer, but those are ideal conditions not always found. Seriation is valid only when types are equal in L $\bar{x}$
 and/or when assemblages are equal in occupation span and/or when types’ L are considerably shorter than assemblages’ occupation spans. As valid as such assumptions sometimes are, archaeologists should attend to—not ignore—L's complicating effects on seriation (Hatch et al. Reference Hatch, Stephen, Whittington and Dyke1982:336). These may be especially strong when occupation spans vary, including short ones that may be more common than often believed (e.g., Mills Reference Mills1989:142; Thompson Reference Thompson2012). (Alternatives [Kohler and Blinman Reference Kohler and Blinman1987:2–3], like seriation, assume equality of types’ L $\bar{x}$
 .) Overall, seriation results capture not just past time but also the complicating effects of L, occupation span, and vessel size (ceteris paribus, larger vessels generate more sherds than do smaller ones, independent of time). Knowing the values of all complicating factors only improves seriation results.
No less is true of estimating population or occupation span from assemblage size and composition. Occupation span registers in the discard equation as t, population size indirectly by its relationship to S. If L and either of these terms is known, the equation can be solved for the other, given TD. L is not irrelevant (cf. Sullivan Reference Sullivan2008:129) to “accumulation studies” that estimate span and/or population (Nelson et al. Reference Nelson, Kohler, Kintigh, Gumerman and Gell-Mann1994; Varien and Potter Reference Varien and Potter1997) from sherd quantity. These project to other contexts the discard quantities that highly relevant L and other equation terms generate in “strong” cases. If L's value is qualified by factors such as supply (e.g., Deal Reference Deal1998:150), no less is true of “strong cases,” if they vary in TD independently of other discard-equation terms. Obviously, differences in TD between settlements or periods may register differences in population or span. Although resident populations and occupation spans may vary more than L, until we know the typical range of L's variation among types, we cannot know how much it affects estimates of other terms.
Further inferences from vessel assemblages include composition by functional class in single assemblages and similarity or difference in composition between assemblages (Orton Reference Orton1993:178–179). Both engage the concepts of systemic or life and discard or death assemblages noted above. Archaeologists sample the latter directly but infer the former (Cowgill Reference Cowgill1970; DeBoer Reference DeBoer, Moore and Keene1983:Figure 2.1). Life and discard assemblages are identical only if all types’ L are identical. Yet “dramatic differences” (Arnold Reference Arnold1988:377) between life and discard assemblages (e.g., Arnold Reference Arnold1988:Table 5; David Reference David1972; DeBoer Reference DeBoer1974:Table 1; Straight Reference Straight2017:110) can intervene between proportions in use and in discarded assemblages, from L differences between types (different “relativities” [Orton Reference Orton1993:179]). Accordingly, “if we cannot say anything about the relative life-spans, then we cannot say anything about the life assemblage” (Orton Reference Orton1993:178). To infer composition of life assemblages from discard ones and to compare composition among sets of the latter, at least L “relativities” must be known.
Ethnoarchaeological Approach
In ethnoarchaeological context, L $\bar{x}$ is given by informants or comes from census data. In the Anglophone tradition, ethnoarchaeology arose from ethnographic observations that informed archaeological inference. The concern for valid inference arose as archaeology began its mid-century transformation, although ethnoarchaeology predates it (Marciniak and Yalman Reference Marciniak, Yalman, Marciniak and Yalman2013:6–9). Here, it suffices to note that ethnoarchaeology was conceived partly as a methodology to serve formation theory, which sought causal relationships between material culture and behavior not bound by context or cultural tradition.
Contemporary archaeology's splintered intellectual landscape mirrors views of ethnoarchaeology. If some identify “general epistemological consensus on . . . the necessity to call upon” generalizations (Roux Reference Roux2007:153; see also Roux Reference Roux, Marciniak and Yalman2013:21; Williams Reference Williams2014:125–129) that link behavior to material culture, others disagree. To them, “the time of the law-like propositions has passed and . . . correlates are not universal” (Politis Reference Politis2015:64). Correlates need not be universal, merely common. Otherwise, much ethnoarchaeology today is interpretive, even anti-positivist. This development invites contemplation of ethnoarchaeology's epistemological merits and formation theory's ontological status.
Accordingly, this article emulates DeBoer's (Reference DeBoer and Nelson1985:355) tactical reductionism—the appreciation for context while acknowledging that “readily recordable aspects of objects provide . . . powerful insights into their behavioral experiences.” Like others, this research seeks cross-cultural (i.e., general, bounded [Shott Reference Shott2018:7–8, 172]) cause–effect relationships between behavior and material culture. This does not treat people as automatons or context as irrelevant, assuming only that behavior often is patterned in ways and from causes that can be identified. Generalizations—not refuted by cautionary tales—must be explicit, relate causes to effects, acknowledge relevant conditions that generate the relationship, and identify archaeological correlates. They are strongest in describing “closed” (David Reference David1992:336)—that is, materially or functionally determined—domains of cultures. The factors that determine their character—including L and its material correlates—may be common across cultures, producing cross-cultural patterns. Roux (Reference Roux2007:155, 167) described material correlates of behavior, both static and dynamic, ahistorical and contextualized. Like hers, this research tests an area of formation theory, linking physical properties of pottery vessels with their L scales and distributions.
L's Accessibility to Inference
As a general principle, the larger the pot, the longer it lasts [Longacre Reference Longacre, Hodder, Isaac and Hammond1981:64].
Scale. If studying pottery requires knowing L for assemblages’ constituent vessel types, the challenge of inference naturally arises. Some consider L accessible only by unsystematic empirical means (e.g., Lipo Reference Lipo, Hunt, Lipo and Sterling2001:206; Sullivan Reference Sullivan2008) or by thoughtful tacking between archaeological and related ethnoarchaeological data (Frankel and Webb Reference Frankel and Webb2001; Pauketat Reference Pauketat1989 Straight Reference Straight2017; Wallace Reference Wallace, Elson, Stark and Gregory1995). To them, inferring L is at best atheoretical craft. “Strong cases” (Varien and Potter Reference Varien and Potter1997) require unusual empirical data. The approach here concedes the challenge of L's inference and acknowledges the range of potential determinants but nevertheless seeks material correlates that explain it as a matter of theory, not craft. To infer L, archaeologists must seek common factors whose effects are consistent and measurable among cases.
Accomplishing this requires knowing causes of vessel failure—and therefore determinants of L and its material correlates. Today, causes and effects of vessel failure remain poorly understood. Archaeology, that is, lacks a theory of L, an understanding of the factors that determine it, how they interact, and how factors and their interactions might be inferred without recourse to contextual particulars or unsystematic ethnographic analogy. Only halting steps toward that theory are possible here.
Causes of vessel failure, and therefore L, are many and varied. Foster (Reference Foster1960) suggested vessel strength, function, and mode of use. Strength depends upon paste, surface treatment, mass or wall thickness, and firing but also potters’ skill (Deal Reference Deal1998:92), which is difficult to infer archaeologically. Ethnoarchaeologists identify function, particularly whether or not vessels are used in cooking (Bedaux Reference Bedaux and Fokkens1986; Deal Reference Deal1998; Mayor Reference Mayor1994), ceramic technology (e.g., Arnold Reference Arnold1985:153; Deal Reference Deal1998; Fournier Garcia Reference Fournier García1996), use-frequency (Arnold Reference Arnold1985:153; Deal Reference Deal1998; DeBoer Reference DeBoer and Nelson1985; Mayor Reference Mayor1994; Nelson Reference Nelson and Longacre1991:175), inventory size (Menacho Reference Menacho2001:137; Nelson Reference Nelson and Longacre1991; Varien and Potter Reference Varien and Potter1997:213, footnote 3), and vessel size (Arnold Reference Arnold1988; DeBoer Reference DeBoer and Nelson1985; Folorunso Reference Folorunso1992:173; García Reference García1988:53; Longacre Reference Longacre, Hodder, Isaac and Hammond1981; Mayor Reference Mayor1994:190–192; Menacho Reference Menacho2001:137; Shott Reference Shott1996; Silva Reference Silva2008:250; Wandibba Reference Wandibba, Kusimba and Kusimba2003:67) among L's determinants. Foster and Deal considered pottery's value, the latter attributing L differences between communities to one's “poorer and more isolated” (Deal Reference Deal1998:92) condition and its resulting need to treat vessels more carefully. Archaeologically, value is knowable only from context or estimates of production effort.
The logic behind vessel size is not that size itself determines how long vessels last. Instead, size is an efficient proxy for manner and context of use, use frequency, and function (DeBoer Reference DeBoer and Nelson1985). Smaller vessels are apt to be handled more and perhaps in wider contexts, and thereby used more often. Larger vessels are handled less, in fewer contexts and discrete episodes. Similarly, cooking vessels are used in physically and mechanically stressful ways that serving and storage vessels escape. Although both vary in size, storage vessels are generally larger than cooking ones.
Obviously, this logic confronts limits for both size (e.g., cooking pots must be of minimum size to be useful, and storage vessels that weigh a metric ton are unlikely to be useful) and function (cooking and storage vessels may be produced and used in size ranges). Owing to special functions or other reasons, L of some types may not correlate with size—a problem minimized by focus here on utilitarian wares. Yet holding constant other factors, vessel size should vary directly with L: the larger the type, the longer vessels should last (DeBoer Reference DeBoer and Nelson1985; Longacre Reference Longacre, Hodder, Isaac and Hammond1981; Shott Reference Shott1996). The rate at which L increases with size can be determined only in ethnoarchaeological study.
Modeling differences in the shapes of use-life curves . . . is an unexplored area of . . . considerable potential [Varien and Mills Reference Varien and Mills1997:160].
Distribution
Two approaches emerge in the still-unexplored study of L curves. One is cross-cultural correlates identifiable in ethnoarchaeological research, and the other is statistical relationships between archaeologically inferable scale measures and apparently inaccessible distribution. However accessed, L distributions deserve study not for mere technical virtuosity but for their archaeological implications as discussed below. They number among the “dependable points of reference” (Arnold Reference Arnold, VanPool and VanPool2003:63) that link past and present.
Consistent patterns in L distributions across ethnoarchaeological studies—for instance, large vessels differing in distribution from smaller ones—can be projected to archaeological vessels of similar size and function precisely because ethnoarchaeological research establishes those “causal relationships.” This is a matter of analogical reasoning from robust cross-cultural patterns. Obviously, it requires ethnoarchaeological testing (e.g., Shott Reference Shott2018:145–146).
As documented briefly below, the second path to inference of L distributions exploits the possibility of consistent relationships between ethnoarchaeological measures of L $\bar{x}$ and L distribution. When correlated, knowing the first for archaeological datasets gives access to the second—therefore to efficient distribution measures, if not complete distributions themselves.
The Michoacán Purépecha Study
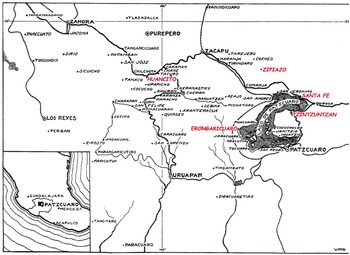
This study and larger project arose from specific questions: What determines L and L distributions? Are factors similar between cases? Are patterns accessible to archaeological inference? Fieldwork occurred in annual visits from 1997 to 2001 to roughly 25 households in five Purépecha communities—Erongarícuaro, Huáncito, Santa Fe de la Laguna, Tzintzuntzan, and Zipiajo—in highland Michoacán (Figure 1). Shott (Reference Shott2018:25–69) described communities, local pottery traditions, and methods of data collection. After five years, the sample numbered several hundred failed ollas (mostly for cooking and storage), along with cazuelas (cooking and serving) and comales (for making tortillas and frying; Shott Reference Shott2018:45–50; Supplemental Table 1).
Michoacán Purépecha study towns of Erongarícuaro, Huáncito, Santa Fe de la Laguna, Tzintzuntzan, and Zipiajo.

Informant accuracy, limited observation, and other problems create ambiguity in use-life data (Varien and Mills Reference Varien and Mills1997:150–151). Therefore, the Michoacán project compiled the following:
(1) Annual censuses of household inventories to track vessels year to year (i.e., longitudinal data). Vessels were coded for chief function, whereas households were coded for the size and composition of both resident populations and vessel inventories. The Kalinga project compiled periodic censuses (Beck Reference Beck2003; Tani and Longacre Reference Tani and Longacre1999) but could not undertake them as often.
(2) Near-monthly censuses over two years in a subsample of households to estimate the incidence of early vessel failure, which Michoacános noted, and its magnitude and effect on L $\bar{x}$
 .
(3) Completed L $\bar{x}$
, by type, from vessels that failed during the project interval. Surviving vessels were analyzed by converting census-age to failure-age distributions using Hildebrand and Hagstrum's (Reference Hildebrand and Hagstrum1999:28) method; L $\bar{x}$ measured from the latter is “HH$\bar{x}$.”(4) Each vessel's age at failure, yielding L distributions.


Size classes defined by vessel weight and the product of height and maximum diameter (H_MD; Shott Reference Shott2018:70–79) correlated highly, and their failure-age distributions were similar; accordingly, only H_MD (approximate volume henceforth; Table 1) is studied here. L $\bar{x}$ and HH$\bar{x}$
 were examined for possible correlation with contextual factors of household size and composition, and with vessel size. L $\bar{x}$
 is reported for descriptive and correlation results; HH$\bar{x}$
 is used in cross-cultural analysis of census data.
To demonstrate the value of a method not often used previously (but see Hatch et al. Reference Hatch, Stephen, Whittington and Dyke1982; for lithics, see Douglass et al. Reference Douglass, Lin, Braun and Plummer2018; Morales Reference Morales2016; Shott Reference Shott2002; Shott and Seeman Reference Shott and Seeman2017), this article analyzes L distributions by fit to the two-parameter Weibull failure model:

where age is measured in units of x, α is a scale parameter that estimates failure age at the approximately sixty-third (63.2)—not fiftieth—percentile (i.e., α ≈ L $\bar{x}$ *[0.632/0.500]), and β is the relative frequencies of times to failure (distribution shape as above; Table 1). Parameters derive from log–log plots of the cumulative Weibull probability (ln[-ln[1-p]], where ln is the natural logarithm, p = [i − 0.3] / [n + 0.4], i = rank of observation, and n = sample size) upon failure age. α, the exponent of the regression intercept, indirectly gauges dispersion of failures, with high values indicating sparser failure distributions in time (Morales Reference Morales2016:234). β is the reciprocal of the fitted-line's slope. Parameters are estimated by regression or maximum likelihood, with associated 95% confidence limits.
Ranges of β values implicate different causes of failure. Significant departure from 1.0 occurs when confidence limits do not encompass that value. When β < 1 statistically (i.e., its 95% upper confidence limit <1), much failure occurs in earliest, “burn-in,” use. When β approximates 1, failure is constant across the range of life—chance its chief cause; in this β range, Weibull encompasses as special case the exponential distribution, used previously (Pauketat Reference Pauketat1989:301; Varien and Potter Reference Varien and Potter1997:200). When β > 1, failure rate increases with age, implicating attrition. Attrition rate varies with ranges of β > 1. When 1 < β < 2, failure rate increases at decreasing rate; when β = 2, rate of increase is linear—failure risk increasing at constant rate; when β > 2, failure rate increases at increasing rate (Morales Reference Morales2016:235; Shott and Seeman Reference Shott and Seeman2017). Hazard distributions plot failure risk from age x to x + 1 for all x; they decline when β < 1, they are horizontal when β = 1, and they rise when β > 1. Model-fitting and hazard plots of completed-L distributions, therefore, suggest factors that govern discard.
Fitting census data to Weibull and other failure models is accomplished easily in Minitab (Shott Reference Shott2018:89–91) and otherwise (e.g., Douglass et al. Reference Douglass, Lin, Braun and Plummer2018:265; Supplemental Table 2). Weibull or exponential distributions always provided best fit among models tested (Shott Reference Shott2018:89). Yet compiling failure distributions from archaeological data is difficult, if even possible (some approaches are sketched below). Why, then, bother doing so with ethnoarchaeological data? Weibull parameters of failure distributions reveal factors—chiefly chance or attrition, the latter of varying degree—that govern discard (e.g., Straight Reference Straight2017:96) and improve modeling of ceramic assemblage formation (Hatch et al. Reference Hatch, Stephen, Whittington and Dyke1982). Moreover, α and β correlate in cross-cultural census data (Shott Reference Shott2018:153–155), and α is related mathematically to L $\bar{x}$ . If the latter, in turn, is inferable in archaeological data, it gives access to α and, by extension, to β, which otherwise is unknowable in archaeological assemblages.
Then why wish to know β and, by extension, the factors that govern discard? Reasons differ by artifact type. Numbers of stone tools, for instance, often are considered measures of activity frequency on the logic that each specimen indicates nearly or exactly the same amount of activity as the next. Yet stone tools that fail by chance vary widely in L, so they are imperfect measures of amount of tool-using behavior compared to those that fail by attrition (Shott Reference Shott2002:97). For inferential goals common to ceramics, failure by chance generates constant deposition rates over significant spans and vessel populations, directly registering the passage of time and the size of ceramic-using populations or span of their occupations. Attrition complicates both the relationship between kind and amount of vessel discard, and inference by making discard more episodic, nonrandomly variable over time. Inference to time, population, or span favors types governed by chance, not attrition; therefore, we must know the causes that govern discard by type. Analysis of L distributions is no mere study of modern material culture, itself useful. It possesses inherent archaeological value.
An analogy underscores the importance of distributions. Like seriation, radiocarbon dating is a chronometric technique. It measures past time because 14C isotopes decay randomly—fail by chance, like some vessel types—modeled by the exponential distribution, reducing to a constant rate over the populations of isotopes and long spans measured. Chance vessel failure resembles a radiocarbon process operating in a constant carbon reservoir that requires no calibration. Secular fluctuations in the reservoir necessitate calibration. Attrition is roughly analogous to such fluctuations, rendering failures both sparser over the time spans of L $\bar{x}$ and more variable in number over assemblage-accumulation spans—more fluctuating—than does chance. Where attrition governs discard, therefore, the abundance and type composition of ceramic assemblages require calibration for its complicating effects.
Joint Effects of L and L $\bar{x}$ Distribution

Hypothetical examples illustrate the joint and separate effects of L $\bar{x}$ and L distribution. Consider three types of 20 vessels each, all characterized by cumulative survivorship distributions over 20 years, without replacement. All have cumulative survivorship of 1.00 in Year 0; no vessels have failed yet. If 10 of an initial cohort fail in Year 1, then cumulative survivorship at Year 2 is 1.00 − (10/20) = 0.50; if five more fail in Year 2, Year 3's cumulative survivorship is 1.00 − (10 + 5) / 20) = 0.25. Cumulative survivorship is constrained to start at 1.00 in Year 0 and to decline to 0.00 when the last vessel fails. Thus, curves fall from left to right on plots whose abscissas are ordered by time. In this example, all Type 1 vessels survive until age 20, when all fail. For each of Years 1–19, its cumulative survivorship is 1.00 − (0/20) = 1.00; for Year 20, it is 1.00 − (20/20) = 0.00. Type 2 experiences a constant annual failure rate of one vessel, whereas Type 3 experiences high initial then declining failure rates.
Distributions differ (Figure 2a), as does L $\bar{x}$ , 20.00 to 10.5 to 2.75 from Type 1 to 3. Type 1's distribution is governed by attrition; all specimens survive to age 20, when all fail. Here, L $\bar{x}$
 measures the completed L of all specimens equally; L alone, not also distribution, adequately describes specimens’ life histories. More realistic is Type 2's distribution, governed by chance failure and declining at a constant rate of 0.05; L $\bar{x}$
 and distribution both are required to describe specimens’ life histories. Type 3's distribution illustrates “burn-in,” where many specimens fail early. Type 3's TD distribution, the number of vessels discarded annually, declines at declining rate, zeroing by Year 7; Type 2's is constant, so it plots as a horizontal line at TD = 1 (Figure 2b). Type 1's is highly variable; no vessels fail in Years 1–19, but all do in Year 20.
Hypothetical cumulative-survivorship (a) and TD (b) distributions varying simultaneously in L $\bar{x}$ . (Note: Type-1 TD distribution deliberately increased to nominal nonzero values to avoid overlap with Type 3's curve.)

Figure 3 shows the effect of distribution holding L $\bar{x}$ constant at 10 (Type 1 L $\bar{x}$
 = 10.5, a slight difference ignored here). It shows only two distributions, to simplify and because Type 3's burn-in probably is uncommon, although the “infant mortality” noted below tends toward it. Type 1's attrition and Type 2's chance distributions differ sharply (Figure 3a). Type 1's distribution yields no discards for most years, but all 20 vessels abruptly in Year 10 (Figure 3b). Type 2's distribution, constant over the same period, is preferable for seriation or estimating span or population.
Hypothetical cumulative-survivorship (a) and TD (b) distributions of constant L $\bar{x}$ .

Generally, attrition TD distributions are variable—relatively long intervals of little discard punctuated by spasms of high discard. Chance distributions are much less variable (i.e., stochastic, yet their products, like isotopic decay, approximate constancy owing to frequent discard), registering more steadily the effects of passing time or resident population. If a community of constant population that used Figure 3's Types 1–2 moved in hypothetical Year 9, no Type 1 vessels would be deposited in the old community in Years 1–9, then 20 in Year 1 would be deposited in the new community, and 20 more a decade later. TD totals 40 in 11 years. Yet nine-twentieths of Type 2's discards occur in the old community in Years 1–9, then eleven-twentieths in the new one, accurately reflecting L $\bar{x}$ , population size, and occupation span in both settlements. Type 1 is missing from the final nine years in the old community, overrepresented in Years 1–11 of the new. By comparison, Type 2 is represented proportionally to its population and in the two intervals and communities. Episodic deposition, compounded by population fluctuations and/or shifts between settlements, complicates the interpretation of resulting assemblages.
Examples illustrate the effects of L mean and distribution under hypothetical conditions. Yet this framework for interpretation aids treatment of vessel types and assemblages that do not vary so dramatically; for many purposes, types governed by chance failure are preferable to those governed by attrition. This partly explains why cooking pots are well suited to “accumulations research”: besides short L, their discard rates are regular.
Analysis of Michoacán Purépecha L $\bar{x}$ and Distribution

Scale
Analysis began with L $\bar{x}$ for vessels that failed during the project (completed-L), then HH$\bar{x}$
 for estimated completed-L distributions for vessels that survived to project's end. Not surprising for slightly different ways to measure the same quantity, L $\bar{x}$
 HH$\bar{x}$
 , and Weibull α covaried (Shott Reference Shott2018:125); all estimate scale—the former two as central tendency, and α (as above) as a higher percentile. Accordingly, α should and does exceed other scale measures.
Across types and size classes, L $\bar{x}$ or HH$\bar{x}$
 never correlated with commonly cited contextual factors such as household and/or vessel-inventory size and composition (Shott Reference Shott2018:70–110). This empirical result neither invalidates analysis nor renders context unknowable any more than the failure of L $\bar{x}$
 to correlate with similar contextual variables invalidated earlier studies (e.g., Arnold Reference Arnold1988:369; Beck Reference Beck2003:59; DeBoer and Lathrap Reference DeBoer, Lathrap and Kramer1979:124; Straight Reference Straight2017:112). Similarly, comal L $\bar{x}$
 and HH$\bar{x}$
 failed to pattern either with contextual factors or by size class. Again, this result is no failure; on the contrary, it identifies boundaries or limits of any theoretical understanding of L and its causes.
Again, vessel size is a proxy for factors such as use frequency and function. Use frequency patterns inversely with size of ollas and cazuelas (Shott Reference Shott2018:98–99); most cooking vessels are relatively small, and most storage ones large. Thus, size is partial proxy for those factors. Production techniques but not L $\bar{x}$ varied considerably between sets of study towns (Shott Reference Shott2018:95–97). (L $\bar{x}$
 and vessel size also exhibited robust correlations in cross-cultural analysis described below [see also Varien and Mills Reference Varien and Mills1997:149], in which production varied considerably; evidently, ceramic technology has little influence on L $\bar{x}$
 .) Accordingly, analysis then sought patterning of L $\bar{x}$
 with vessel size (Shott Reference Shott2018:111–139). Briefly, all scale measures patterned consistently by size among ollas and cazuelas (Shott Reference Shott2018:Table 6.4); longevity of Michoacán vessels clearly relates to their size (Table 2; nine large ollas of L ≫ 20 years were omitted for extreme ages that nearly doubled L $\bar{x}$
 , conservative treatment that minimized still-significant differences between large and smaller ollas). Similar results occurred when regressing L $\bar{x}$
 upon weight, a common archaeological size measure.
L $\bar{x}$ and Weibull Parameter Estimates for Study Assemblages.

Note: Michoacán data from Shott (Reference Shott2018:Table 6.2); Shipibo data from this study.
a Counts are projected failures by year in original cohorts of 100, using DeBoer and Lathrap (Reference DeBoer, Lathrap and Kramer1979:Figure 4.5) data.
L $\bar{x}$ in Annual and Monthly Censuses

The Michoacán project compiled annual censuses over five years. At any interval, censuses capture vessel age distributions at a moment in time. They complement informant estimates of average longevity and the age of specific vessels, and they provide relatively precise data on individual vessels’ use lives. Censuses corroborated Purépecha informant accounts (Shott Reference Shott2018:60–65) and elsewhere corrected informants’ reports of typical use life (e.g., Straight Reference Straight2017:98). Yet a systematic error—the undetected introduction, use, and failure of some vessels between census intervals—remains uncontrolled even in census data. This is “burn-in,” as above. In Tani and Longacre (Reference Tani and Longacre1999) showed the effects of burn-in failure on estimates of use lives and discard volume, so monthly censuses were undertaken over two years in three Huáncito households (Shott Reference Shott2018:132–138). Treatment here is confined to olla L $\bar{x}$ ; ollas of completed-L ≤ 12 months—early failures that escaped detection between annual censuses—are “short lived,” and others are “long lived.”
The three households held 16 short-lived (one large olla's completed-L was unrecorded) and 32 long-lived ollas; one-third of vessels would have escaped detection in annual censuses. Short-lived ollas, however, are not a random sample of the total assemblage. Instead, large ollas were overrepresented in the long-lived assemblage, and small ones in the short-lived assemblage (Shott Reference Shott2018:Table 6.13). Their breakage survey reduced Tani and Longacre's (Reference Tani and Longacre1999:Table 2) original estimates of Kalinga vessel L $\bar{x}$ from 4.0 to 2.2 years. Not surprisingly, adding lower-than-mean values reduces the mean. But the effect is unimportant against the pattern in data—different degrees of L $\bar{x}$
 reduction by type and especially size class, with corresponding differences in inferred failure causes—that would pass undetected without close-interval censuses.
Kalinga censuses combined cooking vessels of different size; results are not directly comparable to Michoacán, where L $\bar{x}$ of long-lived small ollas significantly exceeded short-lived ones. The difference, again, owes trivially to the distinction between short- and long-lived vessels. More significant is corrected L $\bar{x}$
 drawn from combined subsamples: 9.4 months, approximately 25% lower than the uncorrected value from long-lived vessels only. Corrected L $\bar{x}$
 in years is lower by 20% (Table 3). Although the sole short-lived medium olla scarcely reduces the combined size class's L $\bar{x}$
 , its L is only about one-half the value of long-lived ones. Difference in corrected L $\bar{x}$
 patterns as expected by size class. Results do not merely reveal the trivial—that the failure of short-lived vessels depresses L $\bar{x}$
 —but gauge the varying pattern and magnitude of its effect.
Olla L $\bar{x}$ by Size Class, from Monthly and Annual Censuses in Three Huáncito Households.

In Michoacán data, failure of short-lived vessels reduces apparent L $\bar{x}$ (from 12.1 to 9.4 months, or 1.0 to 0.8 years); even more dramatic reduction characterized cazuelas (Shott Reference Shott2018:138). Without short-interval censuses or longitudinal monitoring of household inventories, early failure of some small ollas escapes detection, their L $\bar{x}$
 correspondingly overestimated. Future studies should conduct censuses at more frequent intervals. Alternatively, archaeological L $\bar{x}$
 estimates must avoid early failure bias by focusing on large vessels. Yet these tend toward higher L $\bar{x}$
 and therefore discard by attrition, which is at odds with the preference for chance failure noted above. This unresolved dilemma is acknowledged as a matter for future research.
Michoacán L $\bar{x}$ in Cross-Cultural Perspective

Because “information must be obtained from a broader sample of contemporary ceramic-using societies” (Arnold Reference Arnold1988:357), Purépecha data were combined with other, especially longitudinal, sources. Beyond this study's scope, the robust patterns found between L $\bar{x}$ and HH$\bar{x}$
 and vessel volume and weight in cases widely separated by place, culture, and context (Shott Reference Shott2018:141–158; cf. Pauketat Reference Pauketat1989:291) reinforced earlier results (Shott Reference Shott1996). If many causes affect “the use-life characteristics of pottery assemblages” (Arnold Reference Arnold1988:374), Michoacán and other values converge despite contextual differences. Analysis did not assume that “if data are available on topics that might possibly be related, then statistical comparison . . . will yield useful insights” (Cunningham and MacEachern Reference Cunningham and MacEachern2016:631)—only that it might, as it did. With such results, archaeologists need not choose ethnographic L $\bar{x}$
 values as matters of atheoretical craft or predilection. Instead, inserting vessel-size measures into regressions from cross-cultural data estimates L $\bar{x}$
 for any type (Shott Reference Shott2018:149, 156).
Summary of L $\bar{x}$ Analysis

Ethnoarchaeological generalizations must be explicit, relate causes to effects, and identify relationships’ boundary conditions and archaeological correlates. The chief generalization here is that, both among Purépecha olla (and cazuela) size classes and cross-culturally, L $\bar{x}$ patterns consistently and positively with size; larger pots indeed last longer. Failure of short-lived small vessels reduces L $\bar{x}$
 by 20% or more, with larger vessels remaining unaffected. Relationships apply to sedentary societies and to globular vessels, not to comales (Shott Reference Shott2018:7–8). Archaeological correlates are vessel-size measures.
Analysis of Distribution
14C isotopic decay is—and vessel failure may be—governed by exponential distributions. The exact failure time of an unstable isotope or an olla is unpredictable. How can events random by nature occur at constant rates? Moment to moment, they do not. Over archaeological time scales, there is great variation in the exact timing of individual events; rate constancy at such scales arises not from variation among random events but from the absence of time trends across them.
From completed-L distributions of Purépecha small and large ollas (Shott Reference Shott2018:Figure 6.6), annual survival probability is the number of vessels that failed in that year divided by the number surviving to that year. Regressing survival probability upon age identifies time trends if they exist. Year-to-year variation in small-olla survival probability is high but distributed around practically a horizontal line (r 2 = 0.02, p = 0.69; regression slope = −0.006 [s.e. = 0.015], essentially = 0; Figure 4a). As with isotopic decay, regression cannot predict when any vessel will fail. It can only describe trends. The regression line is horizontal, indicating no time trend; year-to-year variation is noise around chance-governed, constant failure. Annual variation is high among large ollas but with a clear rising time trend—that is, attrition (Figure 4b; r = 0.73, p < 0.01; regression slope = 0.015 [s.e. = 0.003], therefore > 0), corresponding to Figure 3b's Type-1 cumulative distribution.
Annual survivorship versus age in (a) small and (b) large Purépecha ollas.

Only comprehensive study of census sources can determine if patterning is robust. A first step uses recently available Wanka data (Hildebrand and Hagstrum Reference Hildebrand and Hagstrum2021) for the smallest and largest olla classes. Again, annual survival probability varies widely for both classes; again, though, no nonzero trend appears in small-olla survival regressed against time (slope = −0.015 [s.e. = 0.049], essentially = 0; Figure 5a), but it does for large ollas (r = 0.43, p = 0.02; slope = 0.012 [s.e. = 0.005]; Figure 5b). Independent Purépecha and Wanka datasets broadly agree. Analyzing further sources (e.g., Bedaux Reference Bedaux and Fokkens1986; Tani and Longacre Reference Tani and Longacre1999) may reveal similar patterns.
Annual survivorship versus age in (a) small and (b) large Wanka ollas. (Source: Hildebrand and Hagstrum Reference Hildebrand and Hagstrum2021).

Completed-L distributions for small vessels have low standard deviations (Varien and Mills Reference Varien and Mills1997:148), but that is not what recommends them in formation research. Michoacán small ollas have both lower standard deviations and L $\bar{x}$ values than do large ones; size classes have similar coefficients of variation, a better dispersion measure that rescales standard deviation to mean and, in Purépecha data, fails to distinguish classes. The key property of completed-L distributions is not dispersion itself but shape.
Shape is estimated by Weibull parameter and revealed by hazard distributions—not to be confused with Figure 3's cumulative-survivorship curves. Consistent with β values near 1 (Table 2), Purépecha completed-L distributions are nearly horizontal for two smaller size classes (i.e., shapes approximate horizontal lines), indicating risk that stabilizes over longer intervals as age-independent failure (Figure 6a). Consistent with its value of 1 < β < 2, the large-olla distribution is approximately linear increasing. Similar results characterized cazuelas, and combined failed-and-surviving distributions for both vessel types (Shott Reference Shott2018:126–132), corroborating Michoacános’ accounts (Shott Reference Shott2018:65–67) that attributed failures more to chance in smaller vessels, and more to attrition in larger ones. Again, to start gauging robusticity, shapes of Shipibo cooking-olla hazard distributions differ between size classes (Supplemental Table 3). Fitted to the Weibull model, the smaller class's (medium, the smallest only “Infrequently used” [DeBoer and Lathrap Reference DeBoer, Lathrap and Kramer1979:128] for medicinal preparations) β does not significantly exceed 1, its distribution nearly horizontal—that is, chance governed (Table 2). The larger class's β exceeds 1, its linear-increasing distribution indicating age-dependent cumulative failure risk—that is, attrition (Figure 6b).
Completed-L olla Weibull probability and hazard plots by size classes: (a) Purépecha; (b) Shipibo.

β from α. L's distribution being as important as its mean, one path to its inference—completed-L distributions—merely is illustrated in Purépecha and other sources. Only more data can reveal cross-cultural patterns between vessels of particular sizes, functions, or other factors, for instance, and their L-distribution shapes. Until then, the question remains open. Yet there is a reasonable expedient—a second path to inference of L distributions.
All scale values correlate with vessel size in ethnoarchaeological sources; regression from cross-cultural data estimates L $\bar{x}$ from vessel size, from which α is estimated as L $\bar{x}$
 *(0.632/0.500). But Weibull β as efficient description of L distributions is not observed directly in archaeological data. L $\bar{x}$
 and α from ethnoarchaeological sources have undeniable archaeological value; β is equally valuable but cannot be calculated directly from noncensus archaeological data. If, however, Weibull α and β correlate, then β might be estimated from α, without census distributions.
In cross-cultural data, α and β correlate significantly excluding one outlier: Dogon medium cooking vessels (Bedaux Reference Bedaux and Fokkens1986; r = 0.81, r 2 = 0.65, p < 0.01; Figure 7). Correlation is robust to subdivision by vessel type and size (Shott Reference Shott2018:153–155). When L $\bar{x}$ ≥ 2.5—therefore when α ≥ L $\bar{x}$
 *(0.632/0.500) = 3.2 — β > 1. Accordingly, chance may be the chief cause of vessel failure when L $\bar{x}$
 < 2.5, and attrition when L $\bar{x}$
 > 2.5. Qualified by an outlier's selective omission, results require confirmation but suggest that β can be gauged at least broadly when L's scale is known. L's scale and shape covary; as scale and therefore L $\bar{x}$
 rise, distribution shape grows more convex. Future research may indicate if covariation directly reflects difference in manner of use by vessel size or indirectly higher curation of larger, perhaps more valuable, vessels. Undeniably challenging to compile, archaeological L distributions’ relevant parameters and character might be inferable from L $\bar{x}$
 . Inference to distribution is much better than nothing, and it does not require the census data currently available only in ethnoarchaeological studies.
Weibull β against α in cross-cultural dataset. (Source: Shott Reference Shott2018:Figure 7.6a)

Summary of L Distribution
In ethnoarchaeology, L is characterized by failure distributions whose shapes reduce to mathematical models that identify governing causes of failure with archaeological implications. Census L distributions distinguish classes governed by chance versus attrition of whatever magnitude. Distributions are inaccessible in archaeological data, but if they are similar among ethnoarchaeological functional types or size classes (Shott [Reference Shott2018:145–147] describes relevant datasets), their causes can be extended to archaeological types and size classes. Moreover, distribution β might be estimated from central tendency α. In either or both ways, failure causes may be identified, with implications for assemblage formation and archaeological analyses.
Ceramic L distributions are uncommon, but lithic analysts increasingly recognize their value. Many stone tools being retouched in use, degree, and pattern of reduction from original size reflects, directly or indirectly, amount of use. More use implies higher L, ceteris paribus. Original size can be inferred, for instance, from remnant physical properties of tools (e.g., platform allometry). Minimum functional size of resharpened tools can be determined empirically or by replication, estimating potential maximum use and age. Variation in some tool attributes thus comprise distributions of reduction interpretable as completed-L. Reduction distributions are integral properties of tool types no less than their length or width (Iovita Reference Iovita, Lycett and Chauhan2010:236) amenable to analysis (e.g., Morales Reference Morales2016; Shott and Seeman Reference Shott and Seeman2017). Experiments document variation in scale and shape of point use-life distributions (e.g., Cardillo et al. Reference Cardillo, Charlin, Arriaga, Corada, Pablo, Moreno, González-José and Shott2021), affecting properties like geographic scale of distribution (Lin and Premo Reference Lin and Premo2021). Vessels suffer use alteration over time; pioneering work (Skibo Reference Skibo1992) awaits elaboration (but see Banducci Reference Banducci2014; Beck Reference Beck2003; Kobayashi Reference Kobayashi, Longacre and Skibo1994; Simpson Reference Simpson2018; Vieugué Reference Vieugué2014). Yet L distributions are properties of vessel types no less integral than their size, production techniques, or surface decoration. More ethnoarchaeological research is needed on vessel L distributions and their possible correlation with L $\bar{x}$ and α.
Applying Formation Theory in Archaeology
The study of ceramic condition . . . can affect our understanding of artifact use-life, consumption, and discard [Banducci Reference Banducci2014:206].
Applying formation theory to ceramic data exceeds this article's scope (see Shott Reference Shott2018:158–161), but examples merit attention. One is Pereira et alia (Reference Pereira, Forest, Jadot, Darras, Charlotte Arnauld, Beekman and Pereira2021:218–221), not as criticism of this thoughtful study—few archaeologists push their data so far—but to validate formation theory and ethnoarchaeology. Pereira et alia used the discard equation and other means to estimate occupation span from pottery quantity at Postclassic Michoacán sites. They estimated L $\bar{x}$ at 2.0 for both ollas and cazuelas of broadly similar form and size to the Michoacán ethnoarchaeological sample. Dimensions measured from scaled drawings (Pereira et al. Reference Pereira, Forest, Jadot, Darras, Charlotte Arnauld, Beekman and Pereira2021:Figure 10.5) estimated H_MD as volume. Inserted into regression equations from cross-cultural analysis (Shott Reference Shott2018:156), they gave revised L $\bar{x}$
 estimates of 6.3 (±1s.e. range = 4.7–7.8) years for ollas, 2.6 (±1s.e. range = 2.2–2.9) for cazuelas. However Pereira and colleagues derived span estimates from pottery TD and other data, revised L $\bar{x}$
 may alter both results and their implications for regional occupational history. Revisions are not necessarily more accurate, but they are grounded in robust cross-cultural correlations. The example also has implications for L distribution, recalling the correlation suggested between Weibull α and β. Regression estimates of L $\bar{x}$
 exceed 2.5 years for both types (barely, for cazuelas), suggesting distributions governed by attrition. Lying nearer the threshold value, L $\bar{x}$
 of cazuelas may be better than ollas for estimating span.
But L distributions may be more directly accessed in archaeological data, at least as Orton's relativities. For instance, resin attrition on Kalinga cooking pots evidently rose with age (Kobayashi Reference Kobayashi, Longacre and Skibo1994:143–144). Elsewhere, Simpson (Reference Simpson2018) coded nearly 200 Casas Grandes vessels for a range of use alterations. Among complete, presumably utilitarian (Simpson Reference Simpson2018:153) Plainware cooking jars (n = 37), L $\bar{x}$ is approximated by vessel size that Simpson, like Shott (Reference Shott2018), measured as H_MD. Use alteration presumably accumulates over time or vessel age. If size and L $\bar{x}$
 covary, then use alteration should covary with such volume. It does (Figure 8; rs = 0.41, 1-tailed p < 0.01). Nonparametric correlation is advisable both for modest sample size and from complexities of use histories, given that not all vessels of similar age necessarily experience identical rates or kinds of use—nor, as expected in noisy archaeological data, is the scatter tightly constrained; L $\bar{x}$
 sets upper, not lower, limits to use alteration. (Sherds from nearby sites bore similar wear across a range of inferred vessel sizes, somewhat skewed toward larger sizes [Whalen and Minnis Reference Whalen and Minnis2009:173].) Wear must be calibrated to ceramic technology, foodways, and other factors. Yet if further ethnoarchaeological research documents correlations between use-alteration incidence and vessel age inferred or known, then L distributions become accessible in archaeological data.
Use-alteration frequency against volume (H_MD) in Casas Grandes jars.

“Accumulations research” inferred occupation span from TD using “strong cases”—well-preserved sites of relatively brief occupation with in situ vessel inventories (e.g., Varien and Potter Reference Varien and Potter1997). Undeniably valuable, strong cases are rare, especially where preservation is poor. They work best when “reasonably representative of the ancient society” (Varien and Mills Reference Varien and Mills1997:159) studied, a corollary of the direct-historical approach that limits applications in both space and time; strong cases are inherently context dependent. Until more are compiled (e.g., Shott Reference Shott2018:158–161), the approach's robusticity is uncertain. Cross-cultural ethnoarchaeological data are, by nature, context free. No source is ideal, but ethnoarchaeological data are as valuable as strong cases, justifying Varien and Mills's (Reference Varien and Mills1997:174) “tacking” metaphor. A worthwhile exercise is reevaluation of “strong cases” using ethnoarchaeological L data.
Using a variant of the discard equation, Thompson (Reference Thompson2012) estimated surprisingly short spans for Pueblo occupations, with implications for regional population estimates and occupational history. Others (cited in Shott Reference Shott2018:159) used L to study causes and consequences of agricultural intensification, population, and sociopolitical trends. Even archaeologists uninterested in formation theory may pose such questions, best addressed using formation theory and grounded L $\bar{x}$ estimates. Current theory and data being limited, inferences are contingent: they estimate L from vessel size; relevant parameters of L $\bar{x}$
 distributions from ranges of L $\bar{x}$
 values; and ultimately, S, t, or population. But contingent inferences—qualified and revised as research progresses and relevant data accumulate—are better than none, addressing the questions now with limited tools rather than neglecting them.
Conclusion
Research should address the material record ahead of inferred behavior . . . should be linked to the material record via uniformitarian assumptions . . . that . . . should be established in contemporary settings . . . [and] should serve as points of reference to investigate behavioral variation in the past [Arnold Reference Arnold, VanPool and VanPool2003:65–66].
Pattern in data, Purépecha and cross-cultural equally, owes partly to regularities between L $\bar{x}$ and vessel size, characterizing “closed” (David Reference David1992) material domains. L $\bar{x}$
 is affected by “infant mortality” only among small vessels. L $\bar{x}$
 and distribution intervene between archaeological data and past behavior, demanding attention when assemblages retain evidence of vessel function and size. Ethnoarchaeological research—“contemporary settings”—gives access to correlates of L $\bar{x}$
 for archaeological vessels. Access is improved, when inferring dominant causes of vessel failure, with analytical methods that are straightforward to apply.
Formation theory arose in the 1970s. Despite its respectable history, ceramic studies that integrate formation theory—including L estimates grounded in evidence—remain uncommon. Archaeology still ducks hard questions about how the record formed. This and cited studies reveal cross-cultural patterning between vessel properties and L that apply to the material record via uniformitarian assumptions. They provide data and methods useful for estimating L $\bar{x}$ and L distributions to help decipher the meaning that resides in ceramic assemblages.
Of course, ethnoarchaeological studies are mindful of the particulars of context. But robust cross-cultural relationships between, for instance, vessel size and L $\bar{x}$ , and correlations between Weibull parameters α and β are context free. Evidently, ethnoarchaeological data possess some general relevance. Michoacán Purépecha data are not somehow particularly Mesoamerican in relevance, Dogon data (Bedaux Reference Bedaux and Fokkens1986) are not uniquely African, and Kalinga data (e.g., Longacre and Skibo Reference Longacre and Skibo1994) are not exclusively Asian. All are broadly useful in research. Again, context is important but not all encompassing; further research must fix the boundary between general pattern and contextual particulars.
Whatever L's importance, many assemblages are taphonomically ravaged—their small, weathered sherds difficult to reassemble as original vessels. Literally disembodied sherds are common units of analysis, but they pose only pragmatic, not theoretical, challenges to analytical approaches illustrated here. First, highly fragmented assemblages have little analytical value at all. Second, no measurement unit universally is ideal; trivially, sherds are valid units for studying sherd use. Third, not all assemblages are highly fragmented; some vessels are sufficiently reconstructible to determine volume and other measures. Fourth, if pragmatics encourage treatment of disembodied sherds as natural units of study, a countervailing emphasis on the vessels from which they originated is salutary. Ethnoarchaeological data are not directly relevant to fragmented assemblages (e.g., Sullivan Reference Sullivan2008), a problem addressed not just by reducing ethnoarchaeological vessels to sherds but also by refitting archaeological sherds to vessels. This is a dual challenge, not a one-way matter of literally degrading ethnoarchaeological data for archaeological convenience. Fifth, imperfect now, automated methods to refit sherd assemblages into vessels may become practical (Eslami et al. Reference Eslami, Di Angelo, Di Stefano and Pane2020). Sixth, no sherd counted or classified was an integral unit to the people who made and used the vessel from which it derived. Vessels, not sherds, are integral units of ceramic analysis. To the admittedly varying extent that they are reconstructible, vessels should be fundamental units of observation and study.
Still, disembodied sherds remain popular units of ceramic measurement, ignoring the number of vessels that produced them. Yet research casts serious doubt on sherds as valid units for most analytical purposes. Reasons are several—notably, that sherd count cannot control for taphonomic comminution, Orton's (Reference Orton1993) brokenness, weight for differences in that quantity by type. Orton's (Reference Orton1993) “estimated vessel equivalents” (EVEs) or refinements are more valid, especially to compare assemblages, and not as laborious to compute as supposed (Mateo and Molina Reference Mateo Corredor and Vidal2016:335; Strack Reference Strack, Verdan, Theurillat and Pfyffer2011). Mateo and Molina's EVE alternative corrects for wares’ varying brokenness when “ceramics . . . break by accident—which is usually the case” (Reference Mateo Corredor and Vidal2016:337), further validating the distinction between chance/accident and attrition as failure causes. Counting or weighing sherds is easier than estimating number of original vessels, but convenience scarcely justifies the practice or the belief that taphonomic processes that gravely bias count and weight somehow cancel out, validating either. The higher validity of vessels as observation units requires challenge by more than appeal to convenience.
Ethnoarchaeology in service to formation theory thrived into the 1990s. Great diversity characterizes recent research (Marciniak and Yalman Reference Marciniak, Yalman, Marciniak and Yalman2013), but it is absurd to argue that positivism somehow is impermissible today (cf. Cunningham Reference Cunningham2009). In such perspective, this article's subject may seem dated. Over 60 years after Foster (Reference Foster1960) identified L's effects on ceramic assemblages, formation theory and the discard equation may appear as timely as disco music. But useful theory and methods are timeless; e = mc 2 is older than the discard equation, yet it remains valuable to explain, for instance, why radiocarbon dating works.
In that same historical perspective, recent progress in formation research is modest. If archaeologists acknowledge the importance of L, with exceptions noted here and in Shott (Reference Shott2018), they remain far from exploiting its potential in ceramic analyses. This failure is inexplicable unless Gamble (Reference Gamble1986) was right. Whatever the explanation, formation theory is old only if interpretive novelty is valued for its own sake and timeless concepts neglected merely for their age. Those concepts should engage any historical social science. They are unimportant only to a discipline beguiled by passing fancies that deny even the possibility of patterned variation among past cultures and the inferences that can be drawn from it.
Acknowledgments
George Foster and Eduardo Williams encouraged this project and provided field support. Elisabeth Bacus greatly assisted the project. Reviewers made constructive comments that improved the manuscript. My greatest debt is to the people of Erongarícuaro, Huáncito, Santa Fe de la Laguna, Tzintzuntzan, and Zipiajo, who received me in their homes and shared their lifelong experience in vessel use and failure. Fieldwork was supported by grants from the Wenner-Gren Foundation for Anthropological Research.
Data Availability Statement
Data used to perform analyses reported here are provided in the tables and supplemental tables within this article.
Competing Interests
The author declares none.
Supplemental Material
For supplemental material accompanying this article, visit https://doi.org/10.1017/aaq.2022.57.
Supplemental Table 1. Vessel data.
Supplemental Table 2. Survivorship data from which Weibull parameters were estimated in Minitab.
Supplemental Table 3. Shipibo data.