


Introduction
Coastal polynyas are common and recurrent features around the East Antarctic coast between 20° E and 160° E (Reference Massom, Harris, Michael and PotterMassom and others, 1998). Many of the polynyas along this coast are believed to be predominantly latent-heat polynyas (X. Wu and others, unpublished information) formed by divergent ice motion, usually driven by strong offshore winds, and often associated with coastal features that block the advection of ice from upstream into the polynya. Although small in area compared to the total sea-ice zone in this sector (<3%), these latent-heat polynyas are important as areas of high ice production and of strong water-mass modification due to salt ejected from the sea ice, and surface cooling. Large temperature differences between the cold, dry air flowing off the Antarctic continent in winter and the ocean surface at the freezing temperature, plus strong winds, drive intense turbulent energy exchange between the ocean and atmosphere. Turbulent heat fluxes over East Antarctic coastal polynyas may be an order of magnitude or more greater than fluxes from the surrounding pack (Reference Cavalieri, Martin and JacobsCavalieri and Martin, 1985). During winter months, when shortwave radiation is negligible, the turbulent fluxes are the major component of the surface energy balance. Variations in the turbulent exchange determine changes in the rate of ice production, and on the larger scale the coastal polynyas provide a significant source of energy to the East Antarctic atmosphere in winter.
Many estimates of the heat exchange over Antarctic polynyas (and hence implied ice-production rates) are derived from simple bulk aerodynamic formulations using surface meteorological data from nearby sites (e.g. Reference Cavalieri, Martin and JacobsCavalieri and Martin, 1985; Reference Kurtz, Bromwich and InjacobsKurtz and Bromwich, 1985) or global atmospheric models (e.g. X. Wu and others, unpublished information). However, mesoscale studies have demonstrated significant atmospheric responses to polynyas or leads not accounted for in broad-scale estimates (Reference Ruffieux, Persson, Fairall and WolfeRuffieux and others, 1995; Schnell and others, 1995). Open-water heat fluxes change non-linearly with downwind distance from an ice edge as the air mass takes up heat and moisture (Reference AndreasAndreas, 1980; Schnell and others, 1995). Also, focal wind fields change over polynyas (Reference Dare and AtkinsonDare and Atkinson, 1999), so flux estimates with wind data from large-scale models or Antarctic coastal stations may be misleading. Furthermore, Reference Dare and AtkinsonDare and Atkinson (1999) showed the atmospheric response to polynyas changes non-linearly with the size of the polynya. Consequently, turbulent heat fluxes from polynyas are highly variable with location and time. There are only a few direct measurements of the heat exchange over polynyas in winter for either the Arctic (e.g. Reference Den Hartog, Smith, Anderson, Topham and PerkinDen Hartog and others, 1983; Reference Smith, Anderson, Hartog, Topham and PerkinSmith and others, 1983) or the Antarctic (e.g. Reference Kottmeier and EngelbartKottmeier and Engelbart, 1992).
In this paper we present estimates of turbulent heat fluxes made from aircraft soundings over the most active ice-production area of the Mertz Glacier polynya (MGP) during August 1999.
The MGP
The MGP, centred near 67° S, 145° E, is one of the largest and most persistent winter polynyas on the East Antarctic coast. For the 8 years between 1987 and 1994 the average area of ice of <75% concentration in July/August was about 23 000 km2 (Reference Massom, Harris, Michael and PotterMassom and others, 1998). Figure 1, a synthetic aperture radar (SAR) image of the MGP in August 1999, shows open water and new ice along the western side of both the floating Mertz Glacier tongue and the fast ice pinned by grounded icebergs that extends northeast from the glacier front. The floating ice tongue and the grounded icebergs with fast ice together protrude >150km into the mean westward flow of sea ice in the coastal current (Reference Heil and AllisonHeil and Allison, 1999).
RADARSAT SAR image of the mgp collected on 4 august 1999. © RADARSAT international, 1999. the floating tongue of Mertz Glacier is the right, and buchanan bay is north of the label B. aerial meteorological measurements were made along the line ab which is about 30 km long and extends about 3 km over the continent. the arrow indicates the direction of the persistent winds in buchanan bay.

Processes that occur within the MGP are important on a global climate scale. Reference Rintoul, Injacobs and WeissRintoul (1998) links the large volume of Adélie Bottom Water found off the continental shelf in this region to a source near the MGP, and Reference Bindoff, Williams and AllisonBindoff and others (2001) show the importance of ice formation in the polynya for water-mass modification that precedes bottom water formation. Reference LytleLytle and others (2001) estimate the rate of sea-ice production in the MGP.
In austral winter 1999 a multidisciplinary oceanographic and glaciological study of the MGP was undertaken on the research ice-breaker RSV Aurora australis. The vessel operated south of the ice edge for 34 days (22 July-24 August), and within the actual polynya, generally within 80 km of the coast, for 24 days (1−24 August). During the total time south of the ice edge the average air temperature observed on the vessel was −16°C, with several extended periods below −20°C, and a coldest recorded temperature of-28.6°C. In contrast, there were three periods of northeasterly winds during which air temperatures rose almost to the freezing point. The average wind speed measured at the ship during the same period was 12.8 m s–1, with winds reaching gale force (17.5 ms−1) on 21 days and storm force (24.7 ms−1) on 6 days. Average winds within the polynya itself were slightly higher than in the outer pack (average of 13.6 ms−1) but with a strong tendency for much higher winds along the coast. The open water of the polynya contributed to the frequent occurrence of frost smoke, low cloud and falling snow.
Frequent strong katabatic winds, often occurring in narrow streams, were a feature of Buchanan Bay, southwest of the floating Mertz Glacier tongue (Fig. 1). Inland, the vast shallow valley of Mertz Glacier channels cold air descending from the interior of Antarctica to this part of the coast. The winds in Buchanan Bay were always stronger than elsewhere along the coast, and, because of the time taken for the radiatively cooled air to drain from well inland, the katabatic winds here typically did not reach a maximum diurnal speed until about 1500 h. This contrasted with katabatic winds off the coast further west that were generated on the local ice slopes and peaked in mid-morning.
The persistent and very strong katabatic winds made Buchanan Bay the most active ice-producing part of the MGP. In this region, open water transforms into frazil streamers and then into consolidated thicker ice while being transported north parallel to the line A-B in Figure 1 (hereafter referred to as AB). The frazil streamers curve to the east within about 30 km of the coast as the katabatic flow loses energy and the easterly gradient flow dominates. The width of the area of open water and frazil ice is strongly dependent on the wind speed, although other factors, as discussed by Reference Massom, Hill, Lytle, Worby, Paget and AllisonMassom and others (2001), also affect the morphology of the MGP.
Aircraft Measurements of Atmospheric Structure Over the MGP
We determine the ocean-atmosphere sensible- and latent-heat fluxes over the transect AB from measurements of air-temperature and humidity profiles using a helicopter. The measurements were made using Vaisala HMP35C temperature and humidity sensors mounted in the shielded head of a stinger extending forward of the helicopter blades by about 2 m. Because the helicopter is also moving forward, this provided a stream of ambient air to the sensors. The measurement resolutions of the temperature and humidity sensors are ±0.1 °C and ± 3 % , respectively; although this is relatively coarse, we expected to find large temperature and humidity gradients over this area of the polynya.
The flight path aimed to record temperature and humidity at as many locations as possible on the vertical plane up to 650 m a.s.l. between A and B in Figure 1. AB is 30 km long and extends about 3 km inland. We flew horizontal transects along AB at 60,140,300 and 600 m a.s.l. at least once during each flight, and conducted vertical soundings at A and B in Figure 1. On some flights more soundings were taken along AB. The 60 m transect was not flown inland due to rising ice cliffs, 40−50 m high (Reference Wendler, Ahlnas and LingleWendler and others, 1996), at the edge of the polynya. Wind conditions only allowed us to measure the near-surface temperature during one flight (approximately 30 cm above the ice or water surface).
Each flight lasted for up to 2 h, with air-temperature and humidity measurements recorded every second on a digital datalogger. Position of the helicopter (latitude, longitude and altitude) was noted using global positioning system and the aircraft altimeter every 2 min, and this, plus the relatively slow response time of the sensors, meant the change in aircraft position had to be slow for reliable data. Although this method of positioning was relatively crude, interpolation of aircraft locations for each Is temperature sample produced good results overall for the flights. Subsequent data processing eliminated measurements where the aircraft was buffeted by turbulence or had rapid changes in altitude. Selected data used in this paper were recorded when the aircraft was hovering or flying slowly.
Wind speed was noted from helicopter instruments at points A and B on each transect. However, due to strong gusts during flight, mostly close to point B, all measurements taken with helicopter instruments have been averaged to provide a mean value for the flight. Each mean value was compared to wind speeds recorded on the aurora australis during or immediately prior to or after each flight. While the ship’s measurements provided a guide to the likely accuracy of helicopter wind readings, the comparison is not definitive because the ship was usually several kilometres north of A. Therefore the wind average from helicopter measurements was used in calculations, even though ship-based wind recordings were similar to wind speeds recorded in flight at point A, and always less than values recorded at point B.
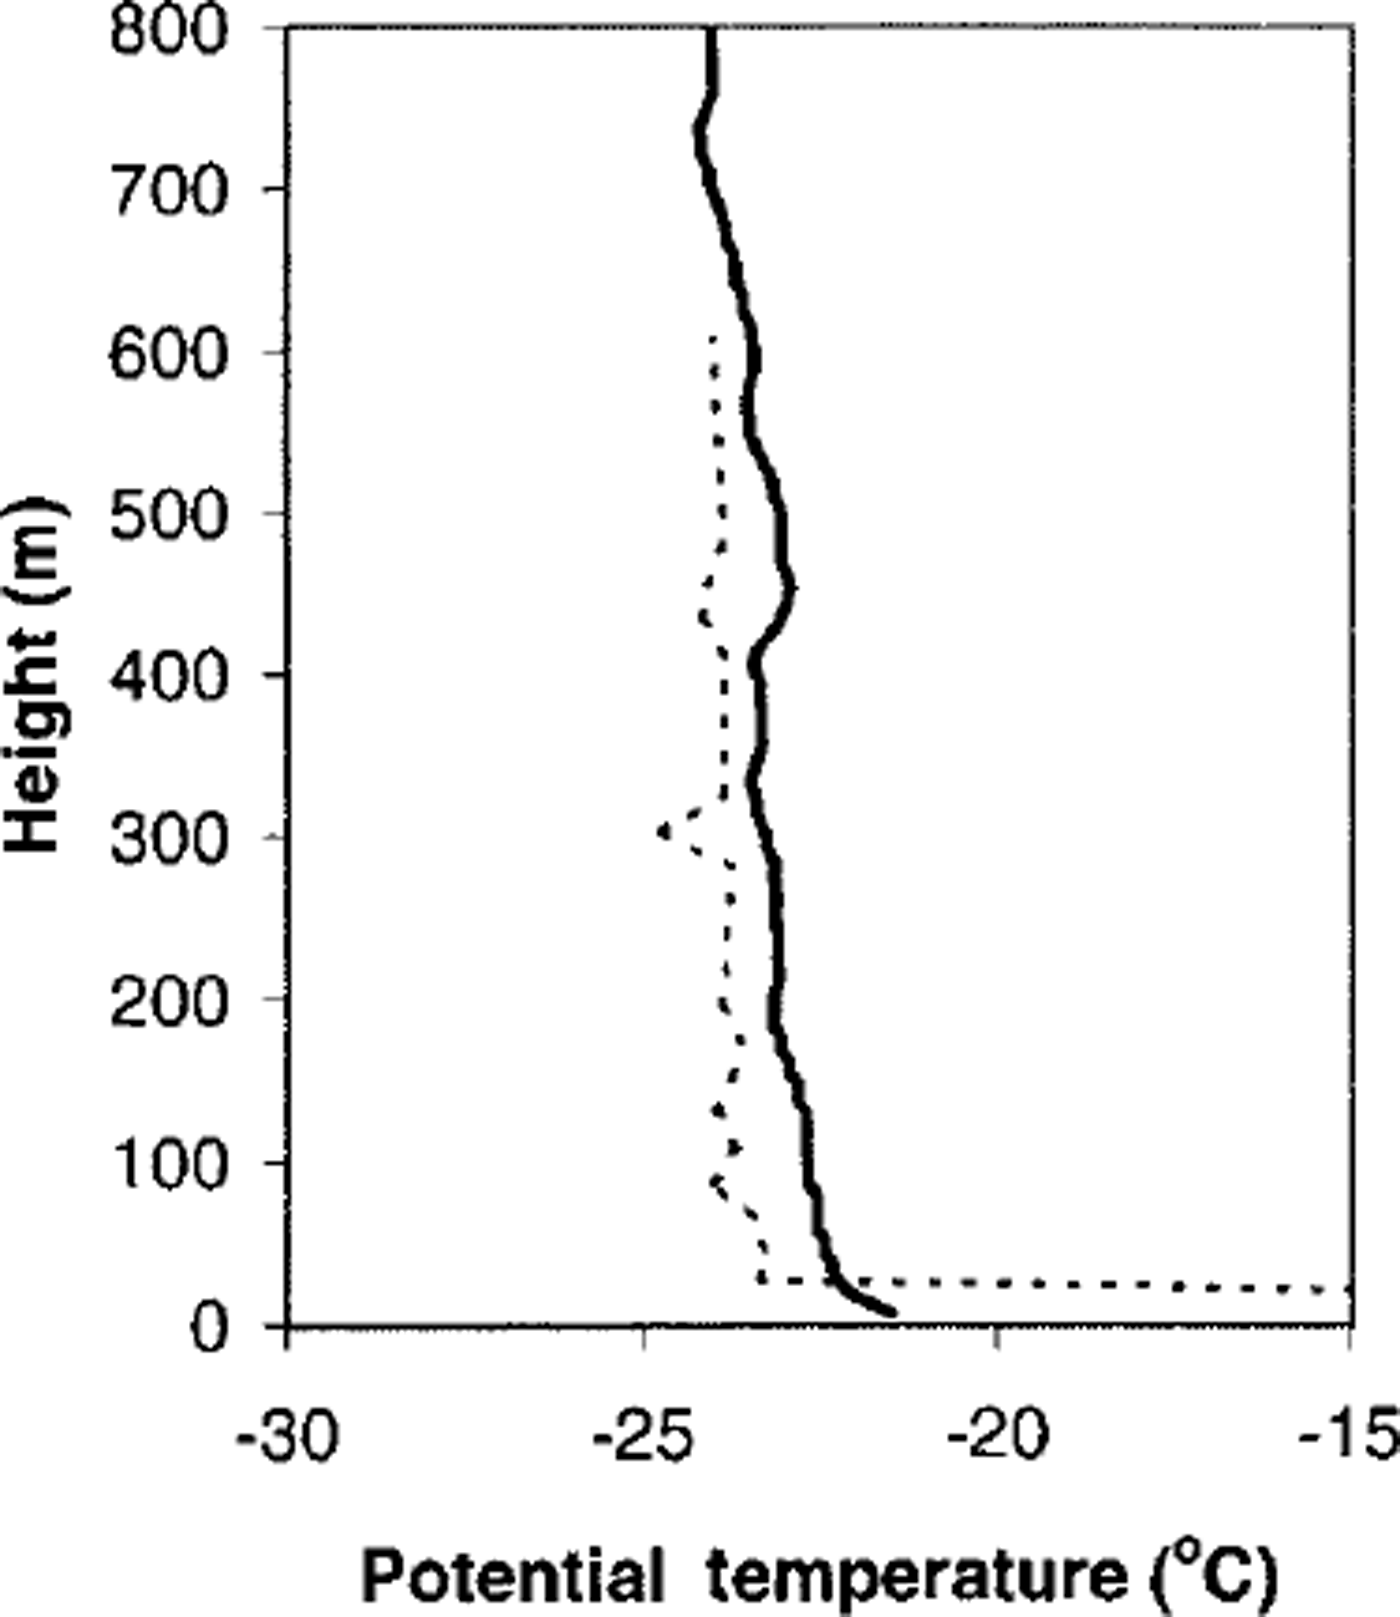
We verified the helicopter’s temperature and humidity sensors by comparing the transect measurement over AB with data from a radiosonde profile obtained from the ship immediately prior to one of the flights. Potential temperatures measured by these two methods differ only slightly (Fig. 2), even though the aircraft data represent an average over AB, while the radiosonde was released at A. Similar verification was done for the humidity sensor (not shown here).
Potential temperature trace from a radiosonde released from the ship near point a (fig. 1) at 2230 UTC on 21 august 1999 (solid line); and the horizontally averaged temperature data from helicopter flight 2 between 2300 UTC on 21 august and 0130 UTC on 22 august 1999 (dashed line).
In the following sections, we have used selected data collected during each flight, to produce contours which we use to represent the "mean" conditions for the duration of that flight.
Lower-Atmospheric Structure and Turbulent Fluxes
Results from two flights are presented in this paper. A summary of the ice conditions and mean wind and temperature during each flight is presented in Table 1. Data selected from flight 1 were recorded in a 1 h period from 1410 h on 16 August 1999 (local time); selected flight 2 data were for a 2 h period from 0935 h on 22 August. Thus data from flight 1 are for the diurnal period of maximum katabatic winds, and flight 2 data are earlier in the morning with less katabatic-wind influence.
Ice and weather conditions, and turbulent heat-flux estimates along 0−20 km transect ab for flights 1 and 2
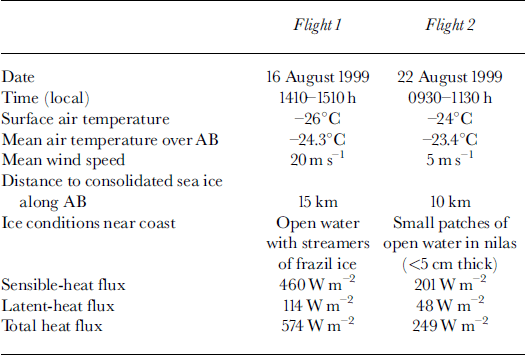
Flight 1 took place during very strong katabatic winds, conditions typical of Buchanan Bay. The ocean surface for the first 15 km was covered with a mixture of frazil streamers and open water. The winds rapidly transported this newly frozen sea ice northward where it consolidated into sheets 5−10 cm thick about 15 km from the coast. The mean wind speed was about 20 m s–1 over the entire transect, with a decrease in wind speed downwind of the consolidated ice edge. This pattern was predicted by Reference Dare and AtkinsonDare and Atkinson (1999), who modelled the atmospheric response to Southern Ocean polynyas. They showed their horizontally one-dimensional wind field was divergent over open water but convergent downwind of their polynya. During flight 1 there was often strong turbulence, particularly evident from airborne snow lifting from the continent and being carried over the polynya. The blowing snow, together with rising sea smoke, did not allow sufficient visibility to measure the near-surface temperature from the helicopter.
Flight 2 was during a period of relative calm, with wind speeds at all levels remaining close to the mean (5 m s-1) throughout the flight. Within 10 km of the coast there were only small intermittent pools of open water separated by thin sheet ice (nilas), but further seaward the ice consolidated to sheets 5−10 cm thick. In contrast to flight 1, both the ice conditions and the wind speed were atypical of what we usually observed in Buchanan Bay. During this flight, the near-surface temperature was taken by touching the helicopter skids on the surface of the nilas and hovering. This temperature was -23.0°C.
Selected data from each flight were gridded using nearest-neighbour interpolation (Reference Sibson and BarnettSibson, 1981). The U.S. National Center for Atmospheric Research (NCAR) "natgrid" nonlinear nearest-neighbour interpolator was used to create potential temperature and humidity surfaces. All calculations have been limited to 50−600 m a.s.L, and the area between the coast and 20 km over the polynya. These boundaries have been chosen over the greatest density of the selected data.
Non-linear nearest-neighbour interpolation (NNI) allows inference on data trends, and accounts for continuous partial derivatives in fields. When using non-linear NNI, features can be identified on a surface not obvious in a corresponding raw-data set. While the exact values and spatial extent of these features may be open to question for areas surrounded by, but not including, raw data, their existence is highly likely if indicated by non-linear NNI. For this reason we give considerable weight to features in our interpolated fields within the domain of our calculations. While these features may not fall in an area represented by raw data, they must be considered and should have a bearing on flux calculations.
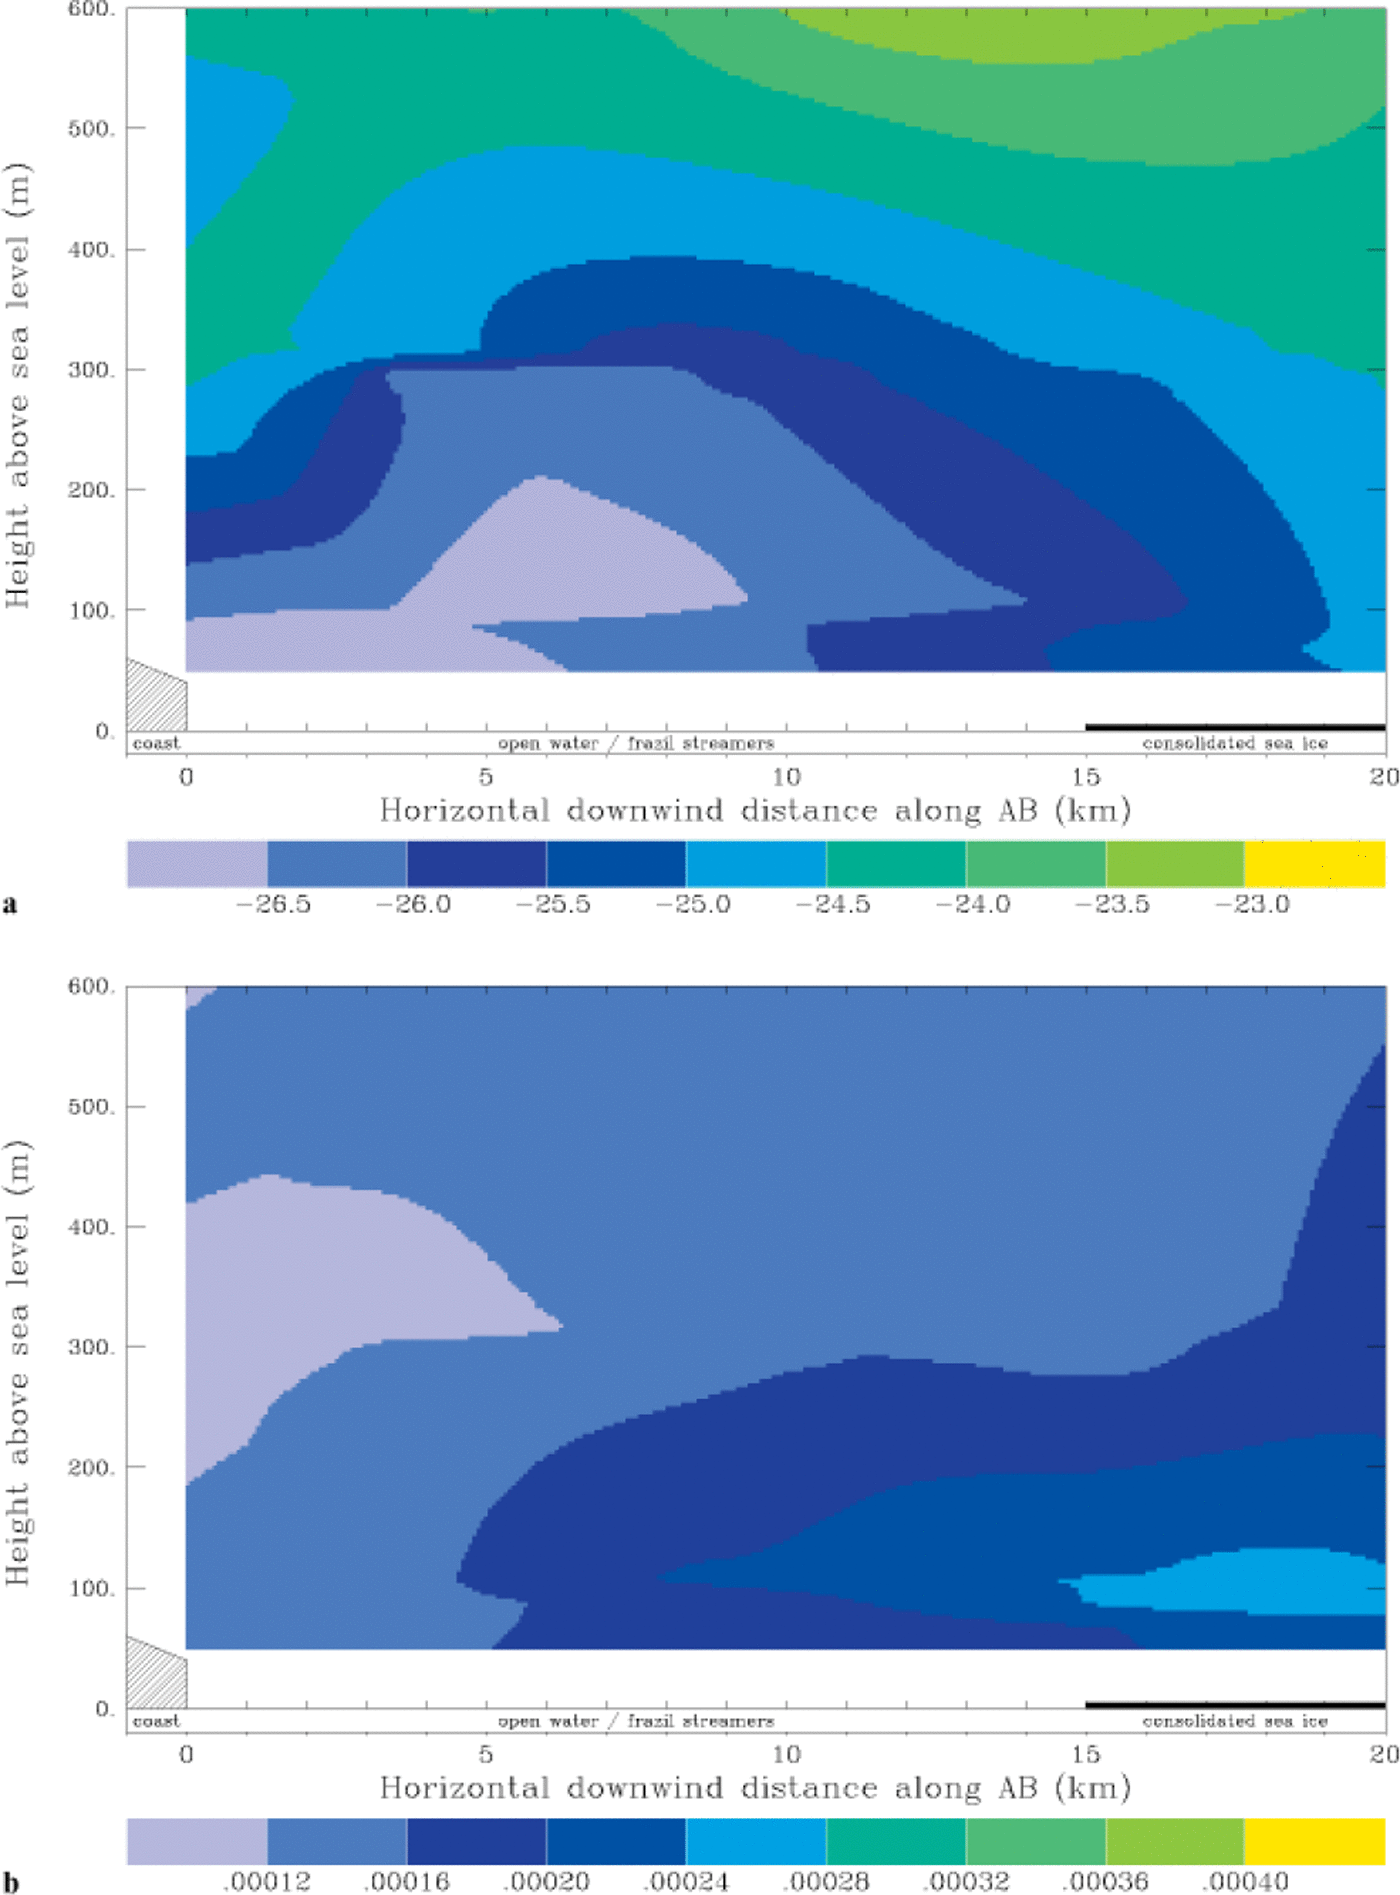
Gross-sections of interpolated potential temperatures and specific humidity for flight 1 are shown in Figure 3a and b, respectively. There is a broad-scale increase in both potential temperature and specific humidity. A cold tongue of continental air extends over the polynya from the coast. The height of this minimum increases, and the strength decreases, as the lower part of the surface inversion is broken down by heat from the open water. The effect of eddies at the ice cliffs is seen in the relatively warm air over the first 5 km of the polynya. This feature is not due to temporal changes: it was checked against raw data and found to persist at the start and end of the flight. Apart from this, the temperature pattern is similar to that predicted by Reference Dare and AtkinsonDare and Atkinson (1999), with cooling from the surface to 150 m above open water, and the katabatic inversion having greater influence above this. Figure 3b shows a pool of high specific humidity around 100 m a.s.l. downwind of open water. This agrees with the position of cloud plumes observed during flight 1, and is similar to condensate patterns presented by Reference Burk, Fett and EnglebretsonBurk and others (1997) who modelled clouds produced by Arctic leads. The humidity pool in Figure 3b may be due to a vertical trapping of humid air by the inversion, and a horizontal trapping by convergence downwind of exposed water.
Vertical cross-sections along part of transect AB (kg 1) for flight 1 (a) potential temperature (°c) and (b) specific humidity (kg kg-1). The horizontal axes also indicate open water and sea-ice cover at the surface during the flight.
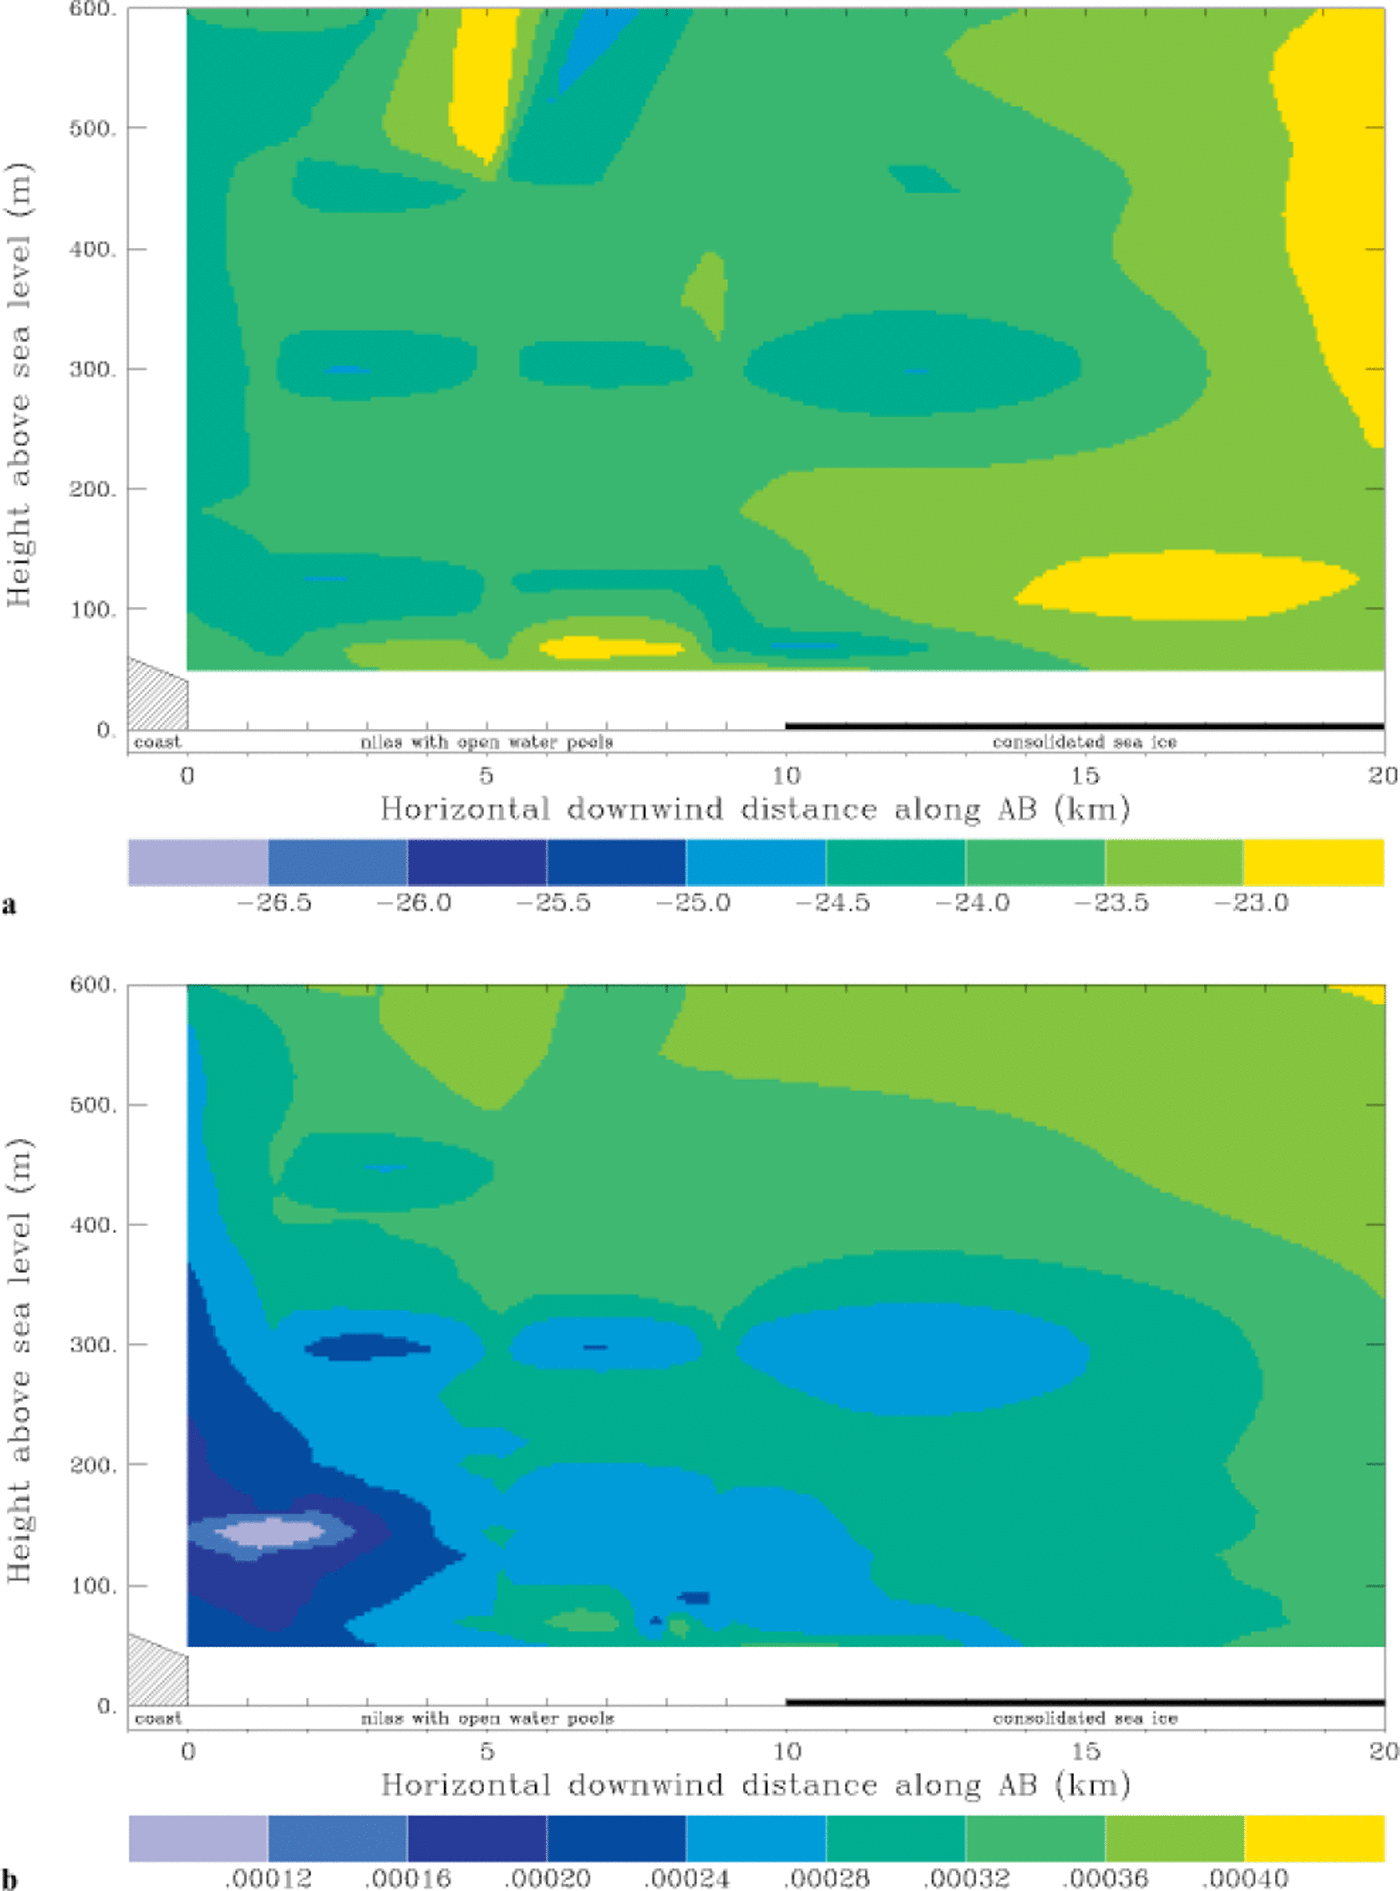
Potential temperature and humidity profiles for flight 2 are shown in Figure 4. On the broad scale there is a modest increase in both potential temperature (about 1°C) and specific humidity with distance downwind over the polynya. However, this is complicated by some vertical stratification and, in particular, a tongue of dry air centred at about 150 m elevation extending from the continent over the coast. This feature may be associated with eddies over the ice cliffs at the coast. It is probable that changes with time during this 2 h, low-wind-speed flight are responsible for some of the noise in Figure 3.
As for figure 3, but for-flight 2.
We computed the change in heat and water content over the domain represented in Figures 3 and 4 to arrive at the surface fluxes of sensible (H) and latent heat (LE). This was done by dividing the domain into a grid with resolution about 18 m in the vertical and 200 m in the horizontal. The mass of moist air in each gridcell was calculated using the equation of state for moist air, and summed vertically to arrive at a column mass m of moist air. This was done for the ith horizontal gridpoint where i = 1 is at the coast and i = 100 is 20 km seaward from the coast along AB. Using the first law of thermodynamics, we assume the process of warming over our 550 m × 20 km × 1 m volume of air is isobaric, giving the sensible-heat flux:

This integral is evaluated on a staggered horizontal grid:
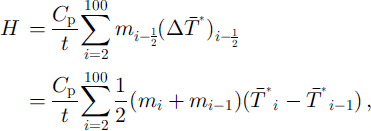
where Cp is the specific heat capacity of dry air at constant pressure,  is the mean virtual temperature of the ith air column, and t is the mean time taken for air to travel through the domain, given as t= 20 km/(mean domain wind speed).
Multiplying the specific humidity by the moist air mass for each gridcell gives the mass of water vapour in that element. Summing this over the ith column gives the column water mass wi, and, using the latent heat of vaporization at 0°C, v0, we arrive at the latent-heat flux (also evaluated on a staggered grid):

The airflow over the ice cliffs was highly non-laminar, and our instruments had neither the accuracy nor time resolution to measure turbulent components. Therefore we have not calculated the changes in fluxes with distance from the coast, but instead we have averaged all values recorded and used this bulk air-mass transformation to estimate the average surface fluxes over the 20 km transect. This assumes that the contribution or loss of energy from above our domain was negligible. We also assume all energy from the surface is transported above 50 m (our lower boundary) within the horizontal distance (20 km) over which fluxes are calculated. The flux values calculated are given in Table 1.
Discussion
Our method of flux calculations makes certain assumptions about the structure of the atmosphere immediately above the polynya. The surface temperature along the transect is not required for these flux calculations, because we have used the horizontal heat gradient of the air column above the polynya, not the vertical gradient. However, by not including the lower 50 m of the air column in our calculations, there is a real possibility of excluding a sizeable portion of heat added to the system near the surface, which would increase the calculated fluxes. We were cautious flying close to the surface in the reduced visibility and sometimes turbulent conditions. So to allow for this practical limitation, we deliberately extended our transect well over the consolidated ice, where fluxes from the surface are considerably reduced compared to those over open water or nilas. This allows convection to lift energy from the open water or nilas into our column of air starting 50 m above the surface, without further energy input from the surface over the consolidated ice. Model results of Reference Dare and AtkinsonDare and Atkinson (1999) show turbulent heat and moisture fluxes through the air column occur predominantly above the open-water section of the polynya. They also show a weak flux into the surface downwind of the open water of the polynya. While it is likely there will be a heat change in the 50 m directly above the polynya not included in our system, we cannot quantify the amount but are confident it is small, based on results presented by Reference Dare and AtkinsonDare and Atkinson (1999).
Reference Dare and AtkinsonDare and Atkinson (1999) also demonstrate their turbulent fluxes have a ceiling around 600 m above the surface in their main test case of a 10 km wide polynya. Although their wind speeds and temperatures were different from ours, they included a katabatic inversion at a similar height (500−1000 m) to that measured during sonde flights from the aurora australis around the times of both flights. This inversion is assumed to be the main factor limiting the height at which energy ceases to penetrate the atmosphere immediately above the polynya. The warping of the potential temperature contours for the strong-wind case at 500−600 m in Figure 3a is believed to be a result of convection influencing the inversion. This feature also occurred in the modelled atmosphere of Reference Dare and AtkinsonDare and Atkinson (1999). We believe this validates our assumption that there is little energy lost through the ceiling of our column of air. Conversely, it is unlikely significant heat from another source will descend on the domain during the passage of air over AB, given the vertical stability above caused by the katabatic inversion.
The method used for flux calculations also relies on inferences made by the non-linear NNI. The degree to which interpolator tautness parameters changed flux values was tested by systematically changing the breadth and intensity of influence of gradient estimates in the interpolation. We found in most cases that changes affected values by only approximately ± 2% of fluxes presented in Table 1.
Using model estimates of the radiative fluxes we can derive the total heat loss during the two flights, and hence the ice-production rates. X. Wu and others (unpublished information) estimate the net incoming shortwave flux in August as 9.4 W m−2 and the longwave loss as 63 W m−2. We expect negligible heat to be supplied to the surface from the underlying ocean in Buchanan Bay, as Williams and Bindoff (2001) show that the total water column in this region is at the freezing point, and there is no evidence of the warmer Highly Modified Circumpolar Deep Water found further to the north. The total heat loss over the southernmost 20 km of the MGP is thus 628 W m−2 for flight 1 and 303 W m−2 for flight 2. To estimate ice-growth rates, we use a sea-ice salinity of 10 psu and an ice temperature of −2°C which are typical of newly forming sea ice in the region. This results in a latent heat of fusion for the newly forming ice of 0.24 MJ kg−1. The calculated heat fluxes are equivalent to ice-growth rates of 25 and 12 cm d−1 for flights 1 and 2, respectively. Reference LytleLytle and others (2001) estimate an average growth rate of 8 cm d−1 for the region within about an 80 km radius of Buchanan Bay between 6 and 19 August when the winds averaged 12.8 ms−1 over the ship. This region includes an area of much higher ice concentration surrounding Buchanan Bay and would be expected to have a lower average ice-growth rate.
We also use bulk aerodynamic formulations to estimate the turbulent heat loss from the surface during flights 1 and 2. Using the same heat-transfer coefficients for sensible heat (1.25 ×10⁻³) and latent heat (1.34 × 10⁻³) as Reference Kurtz, Bromwich and InjacobsKurtz and Bromwich (1985) (which include a stability correction), air temperatures of-26° and −24°C, specific humidities of 0.18 and 0.27 g kg"1, and wind speeds of 20 and 5 m s–1, then the total turbulent heat loss is 1012 W m−2 for flight 1 and 350 W m−2 for flight 2. For flight 1 the sensible-heat flux is 823 W m−2 and the latent-heat flux is 189 W m−2 (H/LE = 4.3); for flight 2 the values are 282 W m−2 and 68 W m−2 , respectively (H/LE =4.3) The bulk aerodynamic estimates of turbulent sensible- and latent-heat fluxes are greater than the aircraft estimates for both flights; in particular for flight 1 where the wind speeds were very high. The estimates from the flight data are in better agreement with the measured ice-growth rates (Reference LytleLytle and others, 2001) and we suggest that these are a better estimate than the very simple bulk aerodynamic estimates which do not account for the fetch dependence of heat exchange over the polynya, particularly at higher wind speeds.
The ratio of sensible to latent heat is similar for both flights and also agrees with the ratio from the bulk aerodynamic estimate. H/LE is equal to 4.0 for flight 1 and 4.2 for flight 2. The ratio is considerably higher than the value near 1.0 obtained from similar aerial observations over an ice/water interface by Reference Allison, Tivendale, Akerman, Tann and WillsAllison and others (1982). This is a simple consequence of the strong dependence of the saturation-specific humidity on temperature: the measurements reported by Reference Allison, Tivendale, Akerman, Tann and WillsAllison and others (1982) were made at about −4°C, whereas the present ones were made around −25°C. Reference Andreas, Paulson, Williams, Lindsay and BusingerAndreas and others (1979) found the sensible heat to be 2−5 times greater than the latent-heat flux over Arctic leads in winter, and the thermodynamic model calculations of Reference MaykutMaykut (1978) give a value of around 4 for thin ice in the Arctic in March.
X. Wu and others (unpublished information) prescribed a polynya at the location of the MGP in a coarse-resolution general circulation model (GCM). For an ice concentration that was not allowed to drop below 25%, they found that the average sensible-heat loss over both ice and open water for June-August was 129 W m−2 and the latent-heat loss was 85 W m−2 . The total ice growth for this period, averaged over a large area, was equivalent to 7.7 cm d −1 (compared to 8 cm d-1 measured by Reference LytleLytle and others, 2001). The MGP was the second most active of the eight polynyas investigated by X. Wu and others (unpublished information). From a full annual run of the GCM they estimated a total ice production of 16.2 m for the year. Applying their ratio between annual ice production in the MGP (16.2 m) and the ice production in August (2.45 m; personal communication from X. Wu, 2000) to the heat flux and ice-growth rates from flight 1, we obtain a total annual ice production of 51 m for the inner part of Buchanan Bay. Meteorological and ice conditions during flight 1 were typical of the conditions experienced in August, suggesting that this region has extremely active ice production. It is stressed that this ice-production rate of >50 m a"1 applies only to the 20 km of the southeast corner of the MGP near the coast, and not to the larger area of low concentration and thin ice. Although this is a small area, it may have a significant impact on the vertical convection and water-mass modification in the region.
Reference Cavalieri, Martin and JacobsCavalieri and Martin (1985) also estimated heat loss and ice production in the MGP. They used meteorological data interpolated from stations up to hundreds of kilometres away to derive 4 day average bulk aerodynamic sensible-heat fluxes from open water. They then assumed that the total turbulent flux was 1.6 times the sensible heat (i.e. H/LE = 1.7). Their mean heat flux from open water in the MGP for the period July-September 1979 was 290 W m−2 , and the largest 4 day flux was 560 W m−2. These values are not directly comparable to those in this study since the broad-scale meteorological data used by Reference Cavalieri, Martin and JacobsCavalieri and Martin (1985) do not resolve the very specific high-wind conditions in Buchanan Bay. Cavalieri and Martin derived ice-growth rates from their heat-flux estimates by assuming that ice grew only in the open-water fraction of the total area. For a 75% open-water fraction, the average July-September growth rate was equivalent to 9.2 cm d−1. While this is similar to the 8 cm d−1 measured by Reference LytleLytle and others (2001), the ice concentration observed over the total area of the latter estimate was always much greater than 25%. The heat-flux and ice-growth rates estimated by Reference Cavalieri, Martin and JacobsCavalieri and Martin (1985) are reasonable approximations over large areas, but, as in the study of X. Wu and others (unpublished information), they do not resolve the small-scale regional differences within the polynya. Localized regions of high ice growth and salt rejection are important for water-mass modification in the polynya.
Reference Kurtz, Bromwich and InjacobsKurtz and Bromwich (1985) also used bulk aerodynamic estimates for the Terra Nova Bay polynya. They, however, used site-specific high wind speeds (13 m s−1) and August air temperature as low as −29°C. Their estimated average sensible- and latent-heat fluxes for August were 625 and 193 W m−2 , respectively (H/LE = 3.2). The comparison between our aircraft-derived and bulk aerodynamic heat fluxes for the MGP leads us to believe that this is an overestimate of the heat loss. The upper limit of annual ice production for the Terra Nova Bay polynya (>65m a−1) may also therefore be an overestimate.
Reference Kottmeier and EngelbartKottmeier and Engelbart (1992) derived sensible-heat exchange over a polynya along the coast of the eastern Weddell Sea both from boundary-layer profile measurements on the M.V. polarstern and from bulk air-mass transformation over a 35 km distance between the coast and the ship derived from aerological soundings. This latter method is broadly similar to the air-mass transformation technique that we use. Although they used in situ observations, these were generally made during periods of low wind speed and relatively high temperature, and the 10 min sensible-heat values derived from the profile data are typically <50 W m−2. There is, however, a large variance with surface wind speed and temperature, and occasional 10 min values reach 500 W m−2. The sensible-heat fluxes estimated from changes in aerological profiles were 250−430 W m−2 during the windiest and coldest period examined (−16° to −22°C; 7−15 m s–1).
Model results of Reference Dare and AtkinsonDare and Atkinson (1999) gave a turbulent heat flux of 375 W m−2 over a simulated polynya with an open-water distance of 10 km. They also used higher air temperatures during this simulation (around −16°C in the bottom 600 m air column), and their air-sea temperature difference (15°C) was not comparable with values we observed. Reference Dare and AtkinsonDare and Atkinson (1999) used a typical Antarctic air-sea temperature difference based on values quoted in the literature. However, Buchanan Bay, where air-sea interaction was observed to be strongest, was not typical of the MGP. It is hoped the temperature structures we have presented may be used in future modelling projects.
A mesoscale feature requiring further investigation is the initial cooling of the flight 1 air column over the first 5 km of the polynya (Fig. 3a). As mentioned in the previous section, raw data have been checked to make sure this was not a product of our data processing. The warm air temperatures over the cliffs, relative to those 5 km downwind of the cliffs, existed throughout the 1 h period these data represent. We think this may be an effect of strong katabatic winds moving over the ice cliffs, causing eddies to recirculate air over the polynya; this did not occur in flight 2. We cannot produce an accurate wind field in this area to investigate it further, but a modelling investigation of the effect of topography at the upwind edge of the polynya would be worthwhile.
Conclusions
The flux estimates presented here are derived from in situ, aircraft measurements over the most active part of a coastal Antarctic polynya in winter. During the coldest and windiest period when we made measurements (−26°C, 20 ms−1) the total turbulent heat loss from the portion of the MGP in Buchanan Bay was 574 W m−2, and the ratio of sensible to latent heat was slightly greater than 4. This estimate, which we believe to be the more accurate, was only about 60% of the flux estimated from the simple bulk aerodynamic method.
Estimates from a flight during calmer conditions (−24°C, 5 ms−1) gave a total turbulent flux of 249 W m−2 . This heat flux, and the associated ice-production rate of 12 cm d−1, is in broad agreement with ice-growth measurements over the larger area of the MGP, and with large-scale heat-flux estimates for a number of other Antarctic coastal polynyas.
The difference between the two periods is indicative of the variability in ocean-atmosphere energy exchange that can occur over pack ice with open water. Wind and temperature can vary regularly in the East Antarctic pack with the passage of synoptic systems, and neither of the situations presented here should be regarded as extreme. Indeed, it was not possible to take measurements during the strongest wind-speed events we experienced during August 1999.
In the southeast part of Buchanan Bay, within about 20 km of the coast, the katabatic winds are extreme and persistent. We suggest that the heat loss measured here during 20 ms−1 wind speed may be typical for August, and extrapolating the associated ice-growth rate of 25 cm d−1 over the whole year yields an annual ice-production rate of up to 50 m. These estimates are similar to those from the Terra Nova Bay polynya. Although Terra Nova Bay is further south, with colder air temperatures, the inner part of the MGP may be windier and have drier airflow off the continental ice sheet.
Acknowledgements
We are grateful for the field support provided by many people on board aurora australis, and particularly to the air crew. We thank A. P. Worby and R. A. Massom for help in the field and useful discussions, and F. Clare of NCAR Scientific Computing Division for providing us with the "natgrid" nearest-neighbour interpolator. Thanks also to P. S. Guest and an anonymous reviewer for constructive comments. The RADARSAT image was processed by the Alaska SAR facility.



