Introduction
A fundamental nosological question of direct relevance to the theory, empirical study and treatment of depression is whether this disorder is a qualitatively distinct syndrome (i.e. a taxon) or whether it possesses a dimensional latent structure, existing along a continuum of severity. Underlying current classification systems of mental disorders, the Diagnostic and Statistical Manual of Mental Disorders, 5th edition (DSM-5; American Psychiatric Association, 2013) and the International Statistical Classification of Diseases, 10th revision (ICD-10; World Health Organization, 1992), is the view that psychopathology is best assessed in a categorical manner, essentially as phenomenological entities made distinct from normality by the presence and severity of their individual constellation of symptoms. In contrast to this position, however, several theorists have contended that mental illnesses are more accurately assessed as dimensional phenomena, with differences between individuals being a matter of degree rather than of type (Flett et al. Reference Flett, Vredenburg and Krames1997; Widiger & Samuel, Reference Widiger and Samuel2005; Helzer et al. Reference Helzer, Kraemer and Krueger2006; Widiger & Edmundson, Reference Widiger, Edmundson and Barlow2014). Empirical research is required directly to delineate the latent structure of depression, and thereby to inform the ongoing theoretical debate regarding the nosology of this disorder (Sonuga-Barke, Reference Sonuga-Barke1998; Beauchaine, Reference Beauchaine2003).
There is a growing corpus of empirical studies providing evidence consistent with the view that diagnostic models of depression, at least as currently defined, are phenomenologically too restrictive, potentially leading to the omission of less severe, yet still clinically significant, manifestations of this disorder (i.e. false negatives; for reviews in this area, see Flett et al. Reference Flett, Vredenburg and Krames1997; Solomon et al. Reference Solomon, Haaga and Arnow2001; Wesselhoeft et al. Reference Wesselhoeft, Sørensen, Heiervang and Bilenberg2013). Subthreshold depression in children and adolescents, for example, appears to share common risk factors and similarly poor clinical outcomes with major depression (Gotlib et al. Reference Gotlib, Lewinsohn and Seeley1995; Wesselhoeft et al. Reference Wesselhoeft, Sørensen, Heiervang and Bilenberg2013). Furthermore, subthreshold symptoms of depression in adolescence have been found prospectively to predict first lifetime onset of major depression in early adulthood (Klein et al. Reference Klein, Glenn, Kosty, Seeley, Rohde and Lewinsohn2013) as well as recurrent major depression (Pettit et al. Reference Pettit, Hartley, Lewinsohn, Seeley and Klein2013).
Collectively, such findings have often been taken to be supportive evidence for a dimensional latent structure for depression (Nierenberg et al. Reference Nierenberg, Rapaport, Schettler, Howland, Smith, Edwards, Schneider and Mischoulon2010; Pietrzak et al. Reference Pietrzak, Kinley, Afifi, Enns, Fawcett and Sareen2013; Wesselhoeft et al. Reference Wesselhoeft, Sørensen, Heiervang and Bilenberg2013). This interpretation, however, may not be justified based on these findings alone. Although studies of subthreshold depression are important for evaluating the validity of the criterial threshold for this disorder under current diagnostic classification systems, they are incapable of directly informing our understanding of the latent structure of this construct. That is, these studies only indicate that the diagnostic criteria for depression, as defined in DSM-5 and ICD-10, probably exclude milder symptomatological presentations that are nonetheless associated with clinically meaningful distress and impairment. Several mutually exclusive possibilities exist that may account for these findings. First, it may be that depression is taxonic (i.e. categorical), but with a lower cutting point differentiating the taxon from its complement class than is featured in DSM-5 and ICD-10. Individuals with major and subthreshold depression may both potentially be members of the putative depression taxon, and non-depressed individuals its complement class. To the degree that individuals with subthreshold depression differ from both those with major depression and no depression, this may simply be a reflection of continuous variation within the putative taxon rather than evidence of a dimensional construct (for a detailed discussion of possible dimensionality within taxa, see Ruscio et al. Reference Ruscio, Haslam and Ruscio2006). An alternative possibility that is also consistent with the findings on subthreshold depression is that this disorder may indeed exist along a continuum of severity. A different empirical approach is therefore necessary to clarify the latent structure of this disorder.
One family of statistical procedures specifically developed to assess the taxonicity versus dimensionality of latent constructs is Meehl's (Reference Meehl1995, Reference Meehl2004) taxometric methods. Among prior taxometric studies of depression in youth, three found evidence of taxonicity (Ambrosini et al. Reference Ambrosini, Bennett, Cleland and Haslam2002; Solomon et al. Reference Solomon, Ruscio, Seeley and Lewinsohn2006; Richey et al. Reference Richey, Schmidt, Lonigan, Phillips, Catanzaro, Laurent, Gerhardstein and Kotov2009), whereas the remaining two reported findings more consistent with a dimensional solution (Whisman & Pinto, Reference Whisman and Pinto1997; Hankin et al. Reference Hankin, Fraley, Lahey and Waldman2005). These studies are characterized by several limitations, however, which may bias their results toward taxonicity or dimensionality, and thereby complicate the interpretability of their findings. Most importantly, although the comparison curve fit index (CCFI; Ruscio & Kaczetow, Reference Ruscio and Kaczetow2009; Ruscio et al. Reference Ruscio, Walters, Marcus and Kaczetow2010) has been applied to taxometric studies in adults, no studies to date of childhood and adolescent depression have utilized the CCFI. This objective index of taxonicity is a recent development, as well as the most significant one thus far (Haslam et al. Reference Haslam, Holland and Kuppens2012), in the broader taxometric literature. The advantage of the CCFI lies in its ability objectively to differentiate between taxonic and dimensional data at a high level of accuracy and its robustness to a wide array of poor measurement conditions (Ruscio & Kaczetow, Reference Ruscio and Kaczetow2009). Older studies relying on subjective interpretation based on visual inspection of taxometric graphical output are more vulnerable to spurious taxonic findings. Indeed, a recent quantitative review of the taxometric literature found evidence consistent with this possibility, studies using the CCFI being more likely to more likely to report dimensional findings than studies relying solely on visual inspection (Haslam et al. Reference Haslam, Holland and Kuppens2012).
Another threat to validity is inadequate sample size, with a minimum of 300 participants being generally recommended (Meehl, Reference Meehl1995). Smaller samples, as was featured in two of the studies (Whisman & Pinto, Reference Whisman and Pinto1997, n = 160; Richey et al. Reference Richey, Schmidt, Lonigan, Phillips, Catanzaro, Laurent, Gerhardstein and Kotov2009, n Study 2 = 159), may result in unstable curves and a bias toward taxonicity (Ruscio et al. Reference Ruscio, Haslam and Ruscio2006). Alternatively, if too few cases of the putative taxon are included in a small sample, a bias toward dimensionality may result. Finally, a third concern relates to construct measurement. Specifically, several studies featured self-report measures of depression (e.g. Whisman & Pinto, Reference Whisman and Pinto1997; Richey et al. Reference Richey, Schmidt, Lonigan, Phillips, Catanzaro, Laurent, Gerhardstein and Kotov2009). Such measures may lead to spurious taxonic findings (Beauchaine & Waters, Reference Beauchaine and Waters2003; Haslam et al. Reference Haslam, Holland and Kuppens2012). Still others have expressed concern that they may instead lend a dimensional bias (for a discussion of this issue, see Ruscio et al. Reference Ruscio, Brown and Ruscio2009). Yet another study (Hankin et al. Reference Hankin, Fraley, Lahey and Waldman2005) assessed for the presence of each depressive symptom at any time over the past 12 months, regardless of whether it temporally overlapped with other symptoms included in the analyses. As mentioned previously by others (Solomon et al. Reference Solomon, Ruscio, Seeley and Lewinsohn2006), such an approach may challenge the ability of the study instrument accurately to reflect the construct it was intended to measure, as temporally disconnected symptoms are unlikely to reflect the same underlying syndrome.
The present study aimed to bridge the gaps in the literature in several important ways. In addition to utilizing the CCFI objectively to evaluate data fit with taxonic and dimensional models, this study assessed the latent structure of depression in an epidemiological sample of children and adolescents, thereby addressing sample selection and sample size issues of past studies. The current investigation also used a structured clinical interview of DSM-IV major depression and related distress and impairment, the Development and Well-Being Assessment (DAWBA; Goodman et al. Reference Goodman, Ford, Richards, Gatward and Meltzer2000)Footnote 1 Footnote †. It thus addresses the stated need for research in this area using well-validated structured interviews in large representative samples (Solomon et al. Reference Solomon, Haaga and Arnow2001). Importantly, an advantage of the DAWBA as employed in the current study is that it exclusively assessed for current depression (i.e. 4-week prevalence), in contrast to previous research involving clinical interviews assessing depressive symptoms over longer intervals. This point is notable, given sizeable differences observed between prospectively and retrospectively recalled rates of psychiatric disorders and symptoms (Wells & Horwood, Reference Wells and Horwood2004; Moffitt et al. Reference Moffitt, Caspi, Taylor, Kokaua, Milne, Polanczyk and Poulton2010; Copeland et al. Reference Copeland, Shanahan, Costello and Angold2011), related concerns about the validity of recall over long time intervals (Tanur, Reference Tanur1992), a significant fall-off in recall of major depression over a 12-month period (Rogler et al. Reference Rogler, Malgady and Tryon1992), and evidence that reporting of psychiatric symptoms appears most reliable for the past 4 weeks (Goldberg, Reference Goldberg1972)Footnote 2 . Such concerns have led some to recommend focusing diagnostic assessments on the most recent 1-month period (Shaffer et al. Reference Shaffer, Fisher, Dulcan, Davies, Piacentini, Schwab-Stone, Lahey, Bourdon, Jensen, Bird, Canino and Regier1996).
Another feature unique to the present investigation is the inclusion of psychological distress and impairment items in the analyses. That impairment and distress have yet to be incorporated in taxometric studies of child and adolescent depression is important inasmuch as they are required fully to evaluate the latent structure of major depression (i.e. content validity). Functional impairment related to psychopathology in children has been found to predict severe emotional illness later in adolescence (Costello et al. Reference Costello, Angold and Keeler1999). In depressed children and adolescents, level of impairment is also positively associated with likelihood of seeking mental health treatment (Wu et al. Reference Wu, Hoven, Cohen, Liu, Moore, Tiet, Okezie, Wicks and Bird2001).
In summary, the current study conducted taxometric analyses of depression in an epidemiological sample of children and adolescents. An empirically validated structured diagnostic interview was used to assess parent- and child-reported DSM-IV depressive symptoms and related psychological distress and functional impairment over the past 4-week period. Finally, to resolve the mixed findings in the literature on whether depression in children and adolescents better fits with a categorical or dimensional model, a relatively recently developed objective taxometric aid, the CCFI, was applied in the current study.
Method
Participants
The study sample was drawn from the 1999 and 2004 surveys of Mental Health of Children and Young People in Great Britain (Meltzer et al. Reference Meltzer, Gatward, Goodman and Ford2000; Ford et al. Reference Ford, Goodman and Meltzer2003; Green et al. Reference Green, McGinnity, Meltzer, Ford and Goodman2005). These national surveys were conducted with children and adolescents living in private households in England, Scotland and Wales. Child diagnostic interviews were conducted with those of ages 11 to 16 years, and interviews with a parent were obtained for children of ages 5 to 16 years. Children below the age of 11 years were not administered diagnostic interviews on the grounds that prior research has found poor reliability in reporting of symptoms among children of this age (Fallon & Schwab-Stone, Reference Fallon and Schwab-Stone1994; Schwab-Stone et al. Reference Schwab-Stone, Shaffer, Dulcan, Jensen, Fisher, Bird, Goodman, Lahey, Lichtman, Canino, Rubio-Stipec and Rae1996). A total of 18 415 (unweighted) families participated in the surveys.
Consistent with standard procedures utilized in prior taxometric studies with interview-based measures of depression (e.g. the Kiddie-Schedule for Affective Disorders and Schizophrenia, Ambrosini et al. Reference Ambrosini, Bennett, Cleland and Haslam2002; the Composite International Diagnostic Interview, Prisciandaro & Roberts, Reference Prisciandaro and Roberts2005; Slade & Andrews, Reference Slade and Andrews2005; Slade, Reference Slade2007; Ahmed et al. Reference Ahmed, Green, Clark, Stahl and McFarland2011), only respondents who endorsed a 2-week period of depressed mood, irritability or anhedonia (i.e. the primary criterion symptom for DSM-IV major depression) within the most recent 4 weeks completed all remaining symptom and impairment questions in the diagnostic interview for depression, assessed over the same 2-week period. As taxometric procedures require response data for all symptom questions, these respondents formed the subsample included in the current analyses (unweighted n parent = 683; n child = 605). Thus, consistent with prior taxometric studies of depression featuring interview-based measures (e.g. Slade & Andrews, Reference Slade and Andrews2005), a small proportion of the entire sample was included in the current studyFootnote 3 . The low endorsement rate for depressed mood, irritability, and anhedonia was expected for a 4-week assessment interval with a very young community sampleFootnote 4 . Additionally, although a smaller fraction met full diagnostic criteria for major depression (i.e. the putative taxon) over the last 4 weeks in the full sample (weighted prevalence rate = 0.65%)Footnote 5 , the prevalence of this disorder in the subsample was adequate for taxometric analysis (weighted prevalence rate = 10.01%)Footnote 6 . This subsample was 52.98% female, with a mean age of 12.00 (s.e. = 0.09) years. The racial/ethnic composition of the subsample was 91.23% white, 3.62% black, 3.15% South Asian, and 2.00% other. The median gross household income was £15 000 to £17 499.
Measure and indicator construction
The DAWBA (Goodman et al. Reference Goodman, Ford, Richards, Gatward and Meltzer2000), a structured diagnostic interview designed for epidemiological research, was used to assess for the presence of DSM-IV major depressive disorder during the most recent 4-week period. This instrument has been found to detect higher rates of psychiatric diagnoses in clinic than in community samples (Goodman et al. Reference Goodman, Ford, Richards, Gatward and Meltzer2000), and has demonstrated adequate validity (Goodman et al. Reference Goodman, Ford, Richards, Gatward and Meltzer2000, Reference Goodman, Ford and Meltzer2002).
A total of 31 items reflecting the nine DSM-IV symptoms of depression and related psychological distress and impairment were used to construct the taxometric indicators included in the analyses. Each symptom item was dichotomous (i.e. presence versus absence of symptom), whereas distress and impairment items utilized a four-point response scale ranging from ‘not at all’ to ‘a great deal’. Following standard taxometric procedures (Beauchaine, Reference Beauchaine2003; Haslam, Reference Haslam2003; Cole, Reference Cole2004), indicators reflecting different facets of the latent construct of depression were derived from these 31 items. Four indicators were created by summing conceptually related items into composite scores. These four indicators were: core depressive symptoms (14 items reflecting depressed mood, irritability and anhedonia), somatic symptoms (six items assessing fatigue, appetite and weight disturbance, sleep disturbance/hypersomnia and psychomotor disturbance), cognitive symptoms (five items reflecting worthlessness/guilt, concentration difficulties and suicidality), and impairment (six items on psychological distress, and impairment in family life, social life, academic performance and leisure activities).
Data analysis
Three distinct taxometric procedures were employed in the present study: MAMBAC (mean above minus below a cut; Meehl & Yonce, Reference Meehl and Yonce1994); MAXEIG (maximum eigenvalue; Waller & Meehl, Reference Waller and Meehl1998); and L-Mode (latent mode; Waller & Meehl, Reference Waller and Meehl1998).
MAMBAC requires at least two valid indicators, with one serving as the input indicator and another functioning as the output indicator. The difference in mean scores of the output indicator above and below a sliding cut-off score on the input indicator is plotted as a function of the input indicator cut-points. This procedure is repeated for every possible pair of indicators. In the current study, 50 cuts were made along each input indicator. Each indicator in a pair alternates as the input and output indicator, and thus two graphical MAMBAC plots are generated for each pair of indicators. The results of these analyses are averaged into a single MAMBAC curve.
MAXEIG requires at least three indicators. One indicator is designated the input indicator, and the interrelationship between the remaining indicators is evaluated in a series of overlapping ‘windows’ (i.e. subsamples) ordered along the input indicator. Based on optimal analysis parameters (Walters & Ruscio, Reference Walters and Ruscio2010), the sample in the current study was split into 25 windows with 90% overlap between adjacent windows. The covariance matrix for the output indicators (variance values are replaced with 0's such that only covariances remain) in each window is factor analysed, and the eigenvalue of the first principal factor is then plotted on a graph with the windows of the input indicator on the x-axis. This procedure is repeated with each indicator serving as the input indicator.
L-Mode similarly requires at least three indicators. This is a factor analytic procedure for differentiating between taxonic and dimensional structures. It calculates the factor scores of cases on a one-factor latent variable, with the factor score density plot of the entire distribution then plotted.
For each taxometric procedure, simulated taxonic and dimensional comparison data were generated, approximating all distribution properties of the empirical data known to influence the shape of taxometric curves. Specifically, the simulated data were identical to the research data in terms of surface-level statistical properties of the observed indicators, such as sample size, means, standard deviations, indicator skew, and inter-indicator correlations, and differed only in terms of latent structure. The results for the empirical data were directly compared with those for simulated taxonic and dimensional data to determine which they most closely matched. For simulated data across all three taxometric techniques, a putative taxon base rate of 0.12 was used, as this was the unweighted prevalence rate of major depression in both parent-report and child-report data. This same taxon base rate was also used in estimating between-group validity and within-group correlations. Additionally, data for each model (i.e. taxonic and dimensional) were simulated 100 times to approximate sampling distributions for each model for each of the three taxometric procedures used in the current study. This approach of comparing the empirical data with simulated models of taxonicity and dimensionality with identical statistical properties provides a much more accurate comparison than would be the case with a prototypical model.
The CCFI was calculated for each taxometric procedure to form an objective determination of whether the results matched the simulated taxonic or dimensional comparison data (Ruscio et al. Reference Ruscio, Ruscio and Meron2007). It compares the root-mean-square residual (RMSR) of the fit between the curve for the actual data and for each simulated comparison curve. CCFI values range from 0 (dimensional structure) to 1 (taxonic structure), with 0.50 being equally supportive of dimensional and taxonic structures (Ruscio et al. Reference Ruscio, Walters, Marcus and Kaczetow2010). CCFI values falling between the dual thresholds of 0.45 and 0.55 indicate ambiguous results (Walters & Ruscio, Reference Walters and Ruscio2013). These dual thresholds have been found to have an accuracy rate ranging from 95.8% for MAXEIG to 98.2% for MAMBAC (Ruscio et al. Reference Ruscio, Walters, Marcus and Kaczetow2010). The CCFI is a relatively recent development in taxometric research, but an important one that appears to have resulted in appreciably reduced rates of spurious taxa in the taxometric literature (Haslam et al. Reference Haslam, Holland and Kuppens2012). All analyses were conducted using Ruscio's (Reference Ruscio2012) taxometric programs in RRO 8.0.1 beta.
Results
Indicator suitability analyses
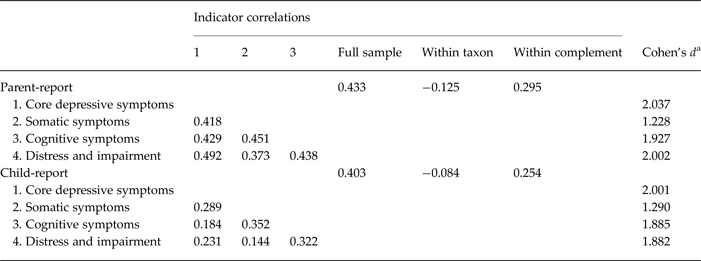
Indicator properties, including skew, correlations and validity, were assessed to determine suitability of the data for taxometric analysis. Highly skewed indicators were not observed in the present study (for all four indicators, skew ⩽0.882). To avoid nuisance covariance in indicator construction, it is important for indicator correlations to be substantially smaller within the putative taxon and complement groups than within the full sample (Ruscio et al. Reference Ruscio, Haslam and Ruscio2006). It has been suggested that a sizeable difference between the full-sample and within-group indicator correlations should be present (Ruscio et al. Reference Ruscio, Haslam and Ruscio2006; Walters, Reference Walters2008). For both parent-report and child-report data, full sample r’s ⩾0.403 and taxon and complement r’s ⩽0.295. Finally, it has been recommended that the constructed indicators should separate the putative taxon from its complement at Cohen's d ⩾1.25 to achieve an acceptable minimum validity (Meehl, Reference Meehl1995; Meehl & Yonce, Reference Meehl and Yonce1996). This condition was satisfied in the current study (for both parent-report and child-report data, mean d ⩾1.765)Footnote 7 . Table 1 provides a summary of indicator characteristics and validity statistics.
Summary of indicator correlations and validity

a Cohen's d is the difference between the putative taxon and complement standardized using pooled within-group variances weighted by degrees of freedom.
Taxometric analyses
MAMBAC analyses produced 12 curves each for parent-report and child-report data. Fig. 1 depicts the averaged graphical output relative to simulated taxonic and dimensional MAMBAC data for each response source. Both parent-report and child-report data more closely resembled dimensional distributions. Indeed, their corresponding CCFI values unambiguously favored dimensional solutions (CCFI parent = 0.315, CCFI child = 0.185). MAXEIG procedures yielded relatively flat averaged curves for both parent-report and child-report data that more closely matched simulated dimensional than categorical data (see Fig. 2). The CCFI values of 0.252 for parent-report data and 0.242 for child-report data provide unambiguous objective support for the presence of a continuous latent structure. The results of L-Mode analyses relative to simulated categorical and dimensional data are graphically presented in Fig. 3. L-Mode curves for both parent-report and child-report data did not indicate evidence of bimodal distributions, and both CCFI values were below 0.45 (CCFI parent = 0.349, CCFI child = 0.309), providing clear support for dimensionality. The mean CCFIs across all three taxometric procedures for parent-report data (0.305) and child-report data (0.245) were congruent with a dimensional latent structure for depression.
Taxometric results for MAMBAC (mean above minus below a cut) curves relative to simulated taxonic and dimensional data. In each graph, the average curve for the sample data are represented by a dark line, with the gray area reflecting the middle 50% of the simulated values, and the light lines indicating the minimum and maximum simulated values at each data point. The top panels illustrate results for parent-reported data, and the bottom panels depict results for child-reported data.

Taxometric results for averaged MAXEIG (maximum eigenvalue) curves relative to simulated taxonic and dimensional data. In each graph, the average curve for the sample data are represented by a dark line, with the gray area reflecting the middle 50% of the simulated values, and the light lines indicating the minimum and maximum simulated values at each data point. The top panels illustrate results for parent-reported data, and the bottom panels depict results for child-reported data.

Taxometric results for L-Mode (latent mode) curves relative to simulated taxonic and dimensional data. In each graph, the average curve for the sample data are represented by a dark line, with the gray area reflecting the middle 50% of the simulated values, and the light lines indicating the minimum and maximum simulated values at each data point. The top panels illustrate results for parent-reported data, and the bottom panels depict results for child-reported data.

Discussion
The aim of the present study was to investigate the latent structure of depression in children and adolescents using three mathematically non-redundant taxometric procedures (i.e. MAMBAC, MAXEIG and L-Mode). It is the first taxometric study of depression in youth to date to utilize objective indices (i.e. CCFI values) in place of subjective visual inspection tests of taxonicity and dimensionality. As such, and in addressing several important methodological limitations of prior taxometric studies of depression in youth, it represents an important step toward resolving the mixed taxometric findings in the literature. The results across all analyses provided convergent support for a dimensional latent structure of depression in this age group. These results appear to be fairly robust, as they were consistent across data derived from multiple reporting sources (i.e. parent and child). The findings of dimensionality in the current investigation are also notably consistent with the broader taxometric literature for depression in adults (Haslam et al. Reference Haslam, Holland and Kuppens2012).
Evidence of dimensionality in the latent structure of depression in children and adolescents may lend clarity to the existing research on subthreshold depression. In particular, the finding that subthreshold depression is associated with several of the same risk factors and prognostic outcomes as major depression has led some researchers to conclude that depression exists along a continuum of severity (Nierenberg et al. Reference Nierenberg, Rapaport, Schettler, Howland, Smith, Edwards, Schneider and Mischoulon2010; Pietrzak et al. Reference Pietrzak, Kinley, Afifi, Enns, Fawcett and Sareen2013; Wesselhoeft et al. Reference Wesselhoeft, Sørensen, Heiervang and Bilenberg2013). The results of the current study provide direct support for this interpretation, and counter the alternative possibility that subthreshold depression and major depression, at least in children and adolescents, exist as part of a single categorical entity.
The limitations of the current investigation warrant mention. First, the current study did not include children below the age of 6 years. Thus, although homotypic continuity has been found between preschool depression and major depression later in childhood (Luby et al. Reference Luby, Si, Belden, Tandon and Spitznagel2009, Reference Luby, Gaffrey, Tillman, April and Belden2014), the current findings cannot be generalized to depression in preschool children. A second limitation of this study is that it evaluated the latent structure of depression based on DSM-IV criteria. Thus, it cannot be ruled out that a depression taxon may exist which includes symptoms not part of DSM-IV criteria (e.g. hopelessness). Additionally, it is possible that only a subset of DSM-IV depressive symptoms form the putative depression taxon (i.e. a subtype of depression), the detection of which may have been obscured by the inclusion of non-taxon-relevant symptoms. Indeed, such a possibility is congruent with the view held by several researchers that major depression is a markedly heterogeneous condition (Spangler et al. Reference Spangler, Simons, Monroe and Thase1997; Klein, Reference Klein2008; McGuffin, Reference McGuffin, Murray, Kendler, McGuffin, Wessely and Castle2008; Harkness et al. Reference Harkness, Stewart and Wynne-Edwards2011). Nevertheless, it is worth observing that the heterogeneity of depression as currently conceptualized reflects a complex, multi-causal etiology, which is entirely consistent with a dimensional latent structure (Meehl, Reference Meehl1977; Meehl & Golden, Reference Meehl, Golden, Kendall and Butcher1982).
Finally, the present findings have implications for clinical prevention and treatment, as well as the study of this disorder in youth. The converging evidence across multiple taxometric analyses of a dimensional structure for depression complements prior research indicating that subthreshold depression is often associated with impairment of a degree comparable with that of major depression (Gotlib et al. Reference Gotlib, Lewinsohn and Seeley1995; Wesselhoeft et al. Reference Wesselhoeft, Sørensen, Heiervang and Bilenberg2013). Collectively, they are congruent with the position that a movement away from a categorical conceptualization of depression in treatment planning may be warranted, and toward a greater emphasis on other characteristics of this disorder (e.g. symptom severity, degree of impairment). Within the context of quantitative research, the arbitrary dichotomization of a dimensional construct leads to a loss in measurement precision (Ruscio & Ruscio, Reference Ruscio and Ruscio2002) and statistical power (Cohen, Reference Cohen1983; MacCallum et al. Reference MacCallum, Zhang, Preacher and Rucker2002), and to an increased risk of spurious statistical findings (Maxwell & Delaney, Reference Maxwell and Delaney1993). Furthermore, the findings of dimensionality for depression may also inform statistical approaches to the study of this condition. That is, classical test theory and item response theory are more appropriate for analyses involving dimensional latent constructs, whereas other approaches, such as Bayes's theorem, are more ideally suited for taxonic constructs (Ruscio & Ruscio, Reference Ruscio and Ruscio2004).
Acknowledgements
The data in the current study were drawn from the Mental Health of Children and Young People in Great Britain 1999 and 2004 surveys. These surveys were undertaken by the Office of National Statistics, and the data are held by the UK Data Archive. These data have received Crown Copyright.
Preparation of this paper was supported by the National Institute of Mental Health of the National Institutes of Health under award number R01MH101138. The content is solely the responsibility of the author and does not necessarily represent the official views of the Office of National Statistics, the UK Data Archive or the funding agency.
Declaration of Interest
None.