Implications
Breed authenticity of meat samples or carcasses could be a useful instrument to ensure consumer confidence on premium meat products. DNA-based technologies provide a tool to realise such objectives but should be achievable at a low cost, which usually implies a relatively small number of genotyped markers. A reduced number of genotyped markers should not, however, compromise accuracy in predicting breed proportion in a biological sample. Results from the present study suggest the breed proportion of samples can be accurately predicted from 300 to 400 genotype markers.
Introduction
Breed assignment of a biological sample is advantageous as a means of delivery on consumer expectation of traceable food products, as well as verification of breed composition for registration in herd-books (Dodds et al., Reference Dodds, Auvrey, Newman and Mc Ewan2014). Moreover, beef originating from different breeds (e.g. Angus, Hereford) is commonly marketed as value-added products. Angus beef, for example, is promoted internationally for apparent superior meat quality attributes. As a premium price is often paid by the consumer for such premium products, there is an onus on abattoirs and retailers to undertake the necessary quality control measures to accurately quantify the breed composition of each carcass. This will increase consumer confidence in such products by reliably ensuring traceability and breed authenticity.
In the absence of genomic information, the breed composition of an individual is usually derived as the average of the breed composition of the respective parents (Solkner et al., Reference Solkner, Frkonja, Raadsma, Jonas, Thaller, Gootwine, Seriussi, Fuerst, Egger-Danner and Gredler2010). Because of Mendelian sampling during gametogenesis, however, breed composition in progeny may not simply be the average of non-purebred parents. This leads to difficulties when assessing the breed proportion of progeny with at least one crossbred parent. Such assignment of breed composition is also important in genetic evaluation systems of multiple (cross-) breeds where animals are assigned to breed groups based on pedigree information. Errors in the cited breed proportion of individuals accumulate down the pedigree.
Genomic information has previously been used to differentiate between purebred populations (Negrini et al., Reference Negrini, Nicoloso, Crepaldi, Milanesi, Colli, Chegdani, Pariset, Dunner, Leveziel and Ajmone Marsan2008; Lewis et al., Reference Lewis, Abas, Dadousis, Lykidis, Paschou and Drineas2011; Hulsegge et al., Reference Hulsegge, Calus, Windig, Hoving-Bolink, Maurice van Eijndhoven and Hiemstra2013; Dodds et al., Reference Dodds, Auvrey, Newman and Mc Ewan2014). Both Kuehn et al. (Reference Kuehn, Keele, Bennett, Mc Daneld, Smith, Snelling, Sonstegard and Thallman2011) and Frkonja et al. (Reference Frkonja, Gredler, Schnyder, Curik and Solkner2012) successfully differentiated or determined the breed proportion of crossbreds with genomic information, although they stated that at least 3000 and 5000 single nucleotide polymorphisms (SNPs), respectively, were necessary to achieve a high accuracy prediction of breed composition. The development of genotype-by-sequencing technology (Nielsen et al., Reference Nielsen, Paul, Albrechtsen and Song2011) may, however, facilitate access to very low-cost genotyping with potentially quick turnaround time. The ability to determine breed composition, especially quantification of the proportion of a given breed, using low-density genotype information would be a significant advantage, particularly in abattoirs where rapid and accurate quantification of breed proportion is desired.
The focus of this study was to accurately quantify the Angus and Hereford breed proportion in biological samples using an ultra-low-density genotype panel. Such low-cost panels are an ideal verification tool for herd-books or abattoirs offering a breed-specific price premium.
Material and methods
Genotypes
High-density (HD) genotypes (i.e. 777 962 SNPs) were available on 4042 animals from seven breeds with pedigree information. Edits applied to SNPs included the removal of SNPs with an unknown genomic location, SNPs with a call rate of <0.95 as well as one copy of the SNPs that appeared on the manifest as a duplicate. SNPs that deviated from Hardy–Weinberg equilibrium within breed were also discarded. After edits, 646 773 autosomal SNPs remained. The breed composition of each animal was determined using ADMIXTURE version 1.23 (Alexander et al., Reference Alexander, Novembre and Lange2009), a programme used for estimating ancestry in a model-based manner from large autosomal SNP genotype data sets. Supervised analysis was undertaken to estimate individual admixture proportions from the SNP data using a specified number of clusters (K=7) to represent the number of ancestral populations. All genotypes of all animals were used to determine the breed composition of each animal; preliminary analyses revealed minimal impact on the correlation between breed predictions using the gold-standard panel and ultra-low-density panels when the reference population included only the genotypes of just one progeny per sire. Only purebred Angus (n=430), Belgian Blue (n=290), Charolais (n=870), Hereford (n=327), Holstein (n=872), Limousin (n=929) and Simmental (n=324) were retained.
Medium-density genotypes (i.e. 15 022 autosomal SNPs) were available on an additional 54 703 commercial cattle. Genotypes were generated using the International Dairy Beef genotyping panel (Berry et al., Reference Berry, McClure, Waters, Weld, Flynn, Creevey, Kearney, Cromie and Mullen2013). Only SNPs that passed the quality control criteria applied to the HD SNPs were retained. After edits, medium-density genotypes (i.e. 13 306 SNPs) were available on 54 703 (predominately crossbred) beef cattle as well as the 4042 purebred animals that also had high-density genotypes.
Development of ultra-low-density panels
In total, 10 genotype panels with SNP numbers ranging from 100 to 1000, in increments of 100 SNPs, were generated from the medium-density SNPs with the goal of predicting both the Angus and the Hereford breed proportion of each individual. Genotype panels were developed for the Angus and Hereford breeds separately. SNPs for inclusion on the genotype panels were selected using five different measures of genetic diversity; only genotypes from the 4042 purebred animals were used to determine the informativeness of each SNP. The five measures of genetic diversity per SNP were
-
1. The Delta statistic (Shriver et al., Reference Shriver, Smith, Jin, Marcini, Akey, Deka and Ferrell1997) calculated as:
where Freq A i and Freq A j are the frequencies of allele A in the ith and jth population, respectively. As Delta can only be estimated across pairs of populations, for each SNP the minimum Delta from the pairwise comparisons of the purebred Angus animals to each of the other breeds individually was used; this was also undertaken separately comparing the purebred Hereford population with each of the other breeds individually. $$\left| {{\rm Freq }A_{i} {\rm - Freq }A_{j} } \right|$$
-
2. The Fixation Index (F st), a measure of genetic differentiation between the pure populations (Weir and Hill, Reference Weir and Hill2002), was calculated using R (Hierfstat) (R Development Core Team, 2015) for each SNP, based on the variance in allele frequencies (Weir and Cockerham, Reference Weir and Cockerham1984). The F st statistic value per SNP was calculated using two approaches: (1) pairwise F st – the minimum F st per SNP for the pairwise comparison of the purebred Angus population with every other breed individually; the same approach was applied to the Hereford breed, (2) global F st – the F st per SNP comparing the purebred Angus with a population of each of the other breeds combined; this was also undertaken separately comparing the purebred Hereford animals to each of the other breeds combined.
-
3. An index combining both the Delta statistic and the pairwise F st value calculated as

 $${\rm Index}{\equals}\widetilde{{{\rm F}_{{{\rm st}}} }}{\plus} \widetilde{\Delta }$$
where
 $\widetilde{{F_{{{\rm st}}} }}\,{\equals}{{F_{{{\rm st}}} } \over {SD_{{F{\rm st}}} }}$
and
 $\widetilde{\Delta }\,{\equals}{{{\rm delta}} \over {{\rm SD}_{{{\rm delta}}} }}$
where
 $$SD_{{F_{{{\rm st}}} }} $$
is the standard deviation of the F
st value and SDdelta is the standard deviation of the delta value.
For comparison purposes, a second index value was also calculated substituting the pairwise F st with the global F st.
The number of SNPs selected per chromosome was reflective of chromosome length and is in Supplementary Table S1. Each chromosome was divided into blocks of a set number of SNPs; the number of blocks was such to equal the predefined number of SNPs required per chromosome to achieve the desired panel density. For each SNP selection method (i.e. the five measures of genetic diversity), SNPs within blocks were ranked based on the genetic diversity statistic under investigation. The highest ranking SNP within block was selected for inclusion in the ultra-low-density panel. SNPs selected in the present study were chosen to be spread across the genome and therefore prior screening of SNPs based on pairwise linkage disequilibrium was not undertaken.
Breed assignment analysis
All breed assignment analyses were undertaken for each panel density, each SNP selection method, and each breed separately using ADMIXTURE version 1.23 (Alexander et al., Reference Alexander, Novembre and Lange2009). Breed prediction was undertaken for all commercial animals (n=54 703), an Angus validation population which consisted of animals that were deemed to contain any proportion of Angus based on the available pedigree information (n=5740), and a Hereford validation which consisted of animals that were deemed to contain any proportion of Hereford based on the available pedigree information (n=5187). The 5740 Angus animals originated from 1337 different sires (median progeny per sire of 1), whereas the 5187 Hereford animals originated from 1117 sires (median progeny per sire of 1). Recorded breed information was available on all animals as it is a legal requirement in Ireland to record the breed of each calf born. Breed predictions of the commercial animals were generated by providing ADMIXTURE (Alexander et al., Reference Alexander, Novembre and Lange2009) with the genotypes of the 4042 purebred animals, as well as their breed identification. This information was then used as a breed profile from which the breed predictions of the 54 703 commercial animals were estimated. The breed proportions of all commercial animals were also generated based on the full medium-density genotype panel (13 306 SNPs) and, for the purpose of this study, this prediction was regarded as the gold-standard breed composition of each animal.
Accuracy of prediction
Several statistics were used to quantify the accuracy of the alternative SNP density panels to predict breed proportion of animals, relative to the gold-standard prediction based on 13 306 SNPs. The correlation between the predicted and actual Angus proportion per animal, as well as the root mean square error (RMSE) of prediction of breed proportion (which also considers prediction bias), were derived for the Angus validation population. The same approach was used for the prediction of Hereford proportion in the Hereford validation population. The range of the standard errors of the predictions generated by ADMIXTURE was also determined; the standard error estimation was based on 300 bootstrap replicates.
In addition, the sensitivity of the prediction of category of breed proportion was derived for both the Angus and Hereford populations separately. Each animal was assigned to a breed proportion category based on its gold-standard breed prediction. The breed proportion categories considered were ⩽1% Angus, >1% to ⩽10% Angus, >10% to ⩽20% Angus, >20% to ⩽30% Angus, >30% to ⩽40% Angus, >40% to ⩽50% Angus, >50% to ⩽60% Angus, >60% to ⩽70% Angus, >70% to ⩽80% Angus, >80% to <98% Angus and ⩾98% Angus. The sensitivity of prediction was defined as the proportion of animals in each category, as determined by the gold-standard panel, that were correctly assigned to that category using each of the different scenarios (i.e. panel density and SNP selection algorithm) investigated. The same approach was applied to the Hereford population.
To investigate whether the ultra-low-density panels developed in this study would be applicable across breeds, an analysis was also undertaken in which SNP panels designed for the Angus population were used to predict the breed proportion of the Hereford validation population and vice versa. Finally, the effect of breed, SNP selection method and panel density on the correlation between the gold-standard breed prediction and the different scenarios was investigated by applying a fixed effects model using PROC GLM (SAS Institute Inc., 2012). Fixed effects considered were breed, SNP density and SNP selection method, as well as all two-way interactions.
Results
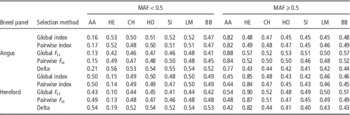
In general, SNPs with a high allele frequency in the Angus purebred population tended to have a low allele frequency in each of the other breeds, and vice versa. The trend was similar for all SNP densities and SNP selection algorithms as well as also in the Hereford breed. The allele frequencies of the 300 SNP panel in the different breeds, selected using the pairwise F st selection method, is in Supplementary Figure S1. The mean allele frequency of SNPs selected for the 300 SNP panel, using each of the five SNP selection methods is in Table 1.
Mean allele frequency of single nucleotide polymorphisms (SNP) selected for the 300 SNP density panel in Angus (AA), Hereford (HE), Charolais (CH), Holstein (HO), Simmental (SI), Limousin (LM) and Belgian Blue (BB) for each of the five selection methods when minor allele frequency (MAF) is <0.5 or ⩾0.5

Single nucleotide polymorphism selection method
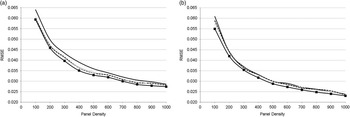
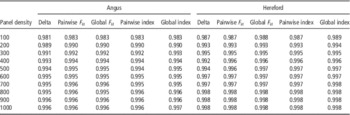
Irrespective of panel density, a strong correlation (i.e. >0.99) existed between the breed predictions generated by each of the five SNP selection methods and this was true for both breeds investigated (Table 2). Using either the correlation or RMSE statistic, or indeed the proportion of animals correctly categorised on breed proportion, the global index method of SNP selection numerically (but not significantly) outperformed all other selection methods when the panel density was ⩾300 SNPs. This was consistent in both breeds (Table 3 and Figure 1). Breed prediction generated using the Delta method consistently exhibited the weakest correlation with the gold-standard breed proportion (P<0.05) in the Angus population (Table 3). In the Hereford validation population however, no one SNP selection method consistently had the weakest correlation with the gold-standard breed prediction (Table 3). The difference in the breed predictive ability between the global F st and pairwise F st SNP selection methods was minimal; the correlation between the two methods for breed prediction was 0.988, 0.995 and 0.998 in the Angus validation population and 0.992, 0.997 and 0.999 in the Hereford validation population, for the 100, 200 and 300 SNP density panels, respectively. In the 300, 600 and 900 SNP density Angus panels, the two F st calculation methods shared 161 (i.e. 54%), 357 (i.e. 60%) and 598 (i.e. 66%) SNPs in common, respectively.
The root mean square error (RMSE) of breed prediction in the Angus ((a), n=5740) and Hereford ((b), n=5187) validation populations for each ultra-low-density panel relative to the gold-standard prediction. Single nucleotide polymorphisms were selected using the Delta method (solid blackline), pairwise F st selection method (broken black line), the Index method (solid grey line), global F st method (broken grey line) or the global index method (solid black line; square markers).

Correlation between the predicted breed proportion from the 300 single nucleotide polymorphism (SNP) panel in the Angus (n=5740; below diagonal) and Hereford (n=5187; above diagonal) validation populations among the five methods of SNP selection (i.e. pairwise fixation index (F st), global F st, delta, pairwise index and global index) and the gold-standard prediction

Correlations between the gold-standard prediction and the predicted breed proportion in the Angus (n=5740) and Hereford (n=5187) validation populations for each single nucleotide polymorphism selection method and panel density

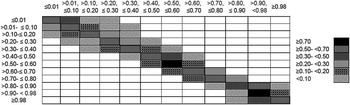
The proportion of animals assigned to the correct Angus proportion category is in Figure 2 for the 300 SNP panel, when SNPs were selected using the global index method. Using the global index method of SNP selection (i.e. the generally best method) and the 300 SNP panel, on average, 62% of animals were assigned to the correct breed proportion category, varying from 47% (the >80% to ⩽90% Angus category) to 78% (the >90% to <98% Angus category). Nonetheless, when the animal was not assigned to the correct category, the animal was consistently assigned within three categories from its true category. For example, of the 26 524 animals deemed by the gold-standard panel to be ⩽0.01 Angus, 14 886 (i.e. 56%) were correctly assigned this category using the 300 SNP panel, 11 502 animals were assigned to the >0.01% to ⩽10% proportion category, 585 were assigned to the >10% to ⩽20% proportion category and only one animal was predicted to be between >20% and ⩽30% Angus. Furthermore, of the 4150 animals categorised by the gold-standard panel to contain >50% Angus, only 98 animals (i.e. 2.36%) were categorised by the 300 SNP density panel as containing ⩽50% Angus. All of these animals were, however, categorised as having between 40% and 50% Angus. Furthermore, when the standard errors of the Admixture predictions were considered, 95 out of the 98 animals categorised as being ⩽50% Angus were in fact not significantly (P>0.05) different from 50% Angus. A scatter plot of actual Angus breed proportion of all Angus animals determined from the gold-standard genotype panel and the 300 SNP panel (SNPs selected using the global index method) is in Supplementary Figure S2.
The breed composition categories assigned to all commercial animals (n=54 703) by the gold-standard panel (vertical axis) and the 300 single nucleotide polymorphisms (SNP) ultra-low-density panel where SNP were selected using the global index method of SNP selection (horizontal axis). Shading represents what proportions of animals were assigned to each category.

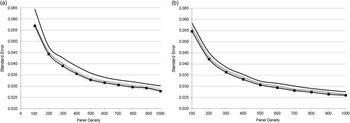
Irrespective of breed and panel density, the breed prediction generated using the global F st method was associated with the least standard error of the predictions generated by Admixture (Figure 3). Breed predictions generated using the Delta method of SNP selection consistently had the greatest mean standard error from the bootstrapping in Admixture. Using the 300 SNP density panel, the mean standard error of breed prediction was 0.0023 and 0.0015 less in the Angus and Hereford validation populations, respectively, when SNPs were selected using the global F st method compared with the Delta method.
Mean standard errors of prediction associated with the predicted Angus proportion ((a), n=5740) and the predicted Hereford proportion ((b), n=5187) of the respective validation populations for each genotype panel density and single nucleotide polymorphism (SNP) selection method; the Delta method (solid black line), the Index method (solid grey line), the pairwise F st selection method (broken black line), the global index method (solid black line; square markers) and the global F st method (broken grey line).

Genotype panel density
Regardless of SNP selection method and breed, the correlation between the gold-standard breed proportion and that predicted with the lower density panels increased (P<0.05) at a diminishing rate as the panel density increased (Supplementary Table S2). Using the global index method of SNP selection, for example, increasing the panel density from 100 to 200 SNPs materialised in a strengthening in the correlation between the predicted breed proportion with the gold-standard panel of 0.6 and 0.5 percentage units in the Angus and Hereford validation populations, respectively. Increasing SNP density from 400 to 500 SNPs resulted in only a 0.07 unit stronger correlation between the breed prediction in both the Angus and Hereford validation populations.
A significant interaction (P<0.05) existed between SNP panel density and breed; the rate of improvement in correlation between predicted and actual breed proportion with increasing panel density differed by breed. The effect of increasing panel density >600 SNPs on the correlation between actual and predicted breed proportion was minimal in the Hereford population when compared with the Angus population (Table 3).
Across all SNP selection methods, the RMSE (Figure 1) and the mean standard error of the predictions generated from the bootstrapping in Admixture (Figure 3) reduced at a diminishing rate as panel density increased. When SNPs were selected using the global index selection algorithm, the mean standard error of the predictions from Admixture reduced by 51% (i.e. from 0.0569 to 0.0278) in the Angus population and 52% (i.e. from 0.0546 to 0.0260) in the Hereford population when the panel density increased from 100 SNPs to 1000 SNPs (Figure 3).
The number of SNPs that were common between each of the SNP panel densities is in Supplementary Table S3. Using the global index method of SNP selection, 99 of the 100 SNPs selected for the 100 SNP panel in the Angus population were also selected for inclusion on the 200 SNP panel; in the Hereford population, all 100 SNPs selected for the 100 SNP panel were included in the 200 SNP panel. The number of SNPs shared between the Angus and Hereford populations for the same panel density was low (<0.036%) although the concordance rate increased with increasing panel density.
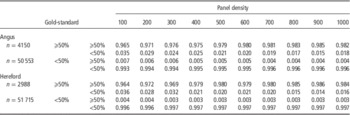
The proportion of Angus and Hereford animals that were correctly categorised as containing <50% Angus/Hereford or ⩾50% Angus/Hereford from each of the ultra-low-density panels, using the global index method, is in Table 4. As panel density increased, the number of animals correctly assigned also increased. For example, of the 4150 animals deemed to be ⩾50% Angus by the gold-standard panel, 4052 (i.e. 97.6%) were correctly assigned this category using the 300 SNP panel, and 4076 (i.e. 98.2% were correctly assigned this category using the 1000 SNP panel. Of the 2988 animals deemed to be ⩾50% Hereford by the gold-standard panel, 2894 (i.e. 96.9%) were correctly assigned this category using the 300 SNP panel, and 2941 (i.e. 98.4%) were correctly assigned this category using the 1000 SNP panel.
The proportion of animals that were assigned the same (or different) breed proportion category (i.e. ⩾50% Angus/Hereford or <50% Angus/Hereford) using the ultra-low-density genotype panels as that assigned using the gold-standard panel

Single nucleotide polymorphisms were selected using the global index selection method.
Prediction of breed proportion using panels developed for another breed
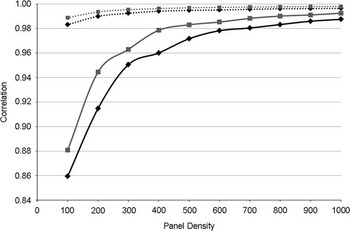
When ultra-low-density panels developed in the Angus population were used to predict the Hereford proportion, the correlation across panel densities between the gold-standard proportion and predicted breed proportion (when SNPs were selected using the global index method) was 0.96 with 300 SNPs (0.034 weaker than when the panel was developed in the Hereford population), and 0.99 with 1000 SNPs (0.006 weaker than when the panel was developed in the Hereford population). Likewise, when panels developed in the Hereford population were used for predicting Angus proportion, the correlation between the gold-standard proportion and predicted breed proportion from the 300 and 1000 SNP panels were 0.044 and 0.009 weaker than when panels were developed in the Angus population (Figure 4). The standard error of prediction was, on average, 0.0496 and 0.0475 greater in the Angus and Hereford populations (across densities) when using SNP panels developed for the other breed.
The correlation between the gold-standard breed prediction and the breed prediction generated using each of the ultra-low-density genotype panels in the Angus (n=5740; black lines) and Hereford (n=5187; grey lines) validation populations. The broken lines represent where the breed prediction was generated using panels designed and used in the same population; the continuous black line represents where panels were designed in the Hereford population and used to predict the breed proportion of the Angus validation population and the continuous grey line represents where panels were designed in the Angus population and were used to predict the breed proportion of the Hereford validation population.

Discussion
The principal objective of the present study was to develop an ultra-low-density genotype panel(s) that could accurately quantify the Angus and Hereford proportion of biological samples. A quick turnaround time for generating breed prediction is demanded by potential users of these genotype panels (i.e. breed societies, abattoirs), thus limiting the number of SNPs present on the panel. Any reduction in SNP density, however, should be achieved without a significant compromise in predictive ability.
Single nucleotide polymorphism selection methods and panel density
The selection of informative SNPs for inclusion on ultra-low-density genotype panels was a key factor in ensuring accurate breed prediction for the large commercial population in the present study. The average pairwise linkage disequilibrium (r 2) between adjacent SNPs on the 300 panel, when selected using the global index method, in the Angus and Hereford populations was 0.18 and 0.22, respectively; no pairwise SNP linkage disequilibrium >0.50 existed suggesting minimal SNP redundancy. Several studies have evaluated approaches of identifying informative SNPs in human (Rosenberg et al., Reference Rosenberg, Li, Ward and Pritchard2003; Paschou et al., Reference Paschou, Ziv, Burchard, Choudhry, Rodriguez-Cintron, Mahoney and Drineas2007) and both pure (Negrini et al., Reference Negrini, Nicoloso, Crepaldi, Milanesi, Colli, Chegdani, Pariset, Dunner, Leveziel and Ajmone Marsan2008; Wilkinson et al., Reference Wilkinson, Wiener, Archibald, Law, Schnabel, McKay, Taylor and Ogden2011; Hulsegge et al., Reference Hulsegge, Calus, Windig, Hoving-Bolink, Maurice van Eijndhoven and Hiemstra2013) and crossbred (Frkonja et al., Reference Frkonja, Gredler, Schnyder, Curik and Solkner2012) cattle populations. Previously evaluated approaches for selecting highly informative SNPs include, but were not limited to, principal component analysis (PCA)-correlated SNPs (Paschou et al., Reference Paschou, Ziv, Burchard, Choudhry, Rodriguez-Cintron, Mahoney and Drineas2007), the Delta method (Wilkinson et al., Reference Wilkinson, Wiener, Archibald, Law, Schnabel, McKay, Taylor and Ogden2011) and F-statistics (Negrini et al., Reference Negrini, Nicoloso, Crepaldi, Milanesi, Colli, Chegdani, Pariset, Dunner, Leveziel and Ajmone Marsan2008; Wilkinson et al., Reference Wilkinson, Wiener, Archibald, Law, Schnabel, McKay, Taylor and Ogden2011; Frkonja et al., Reference Frkonja, Gredler, Schnyder, Curik and Solkner2012). Although no previous study in cattle has combined two or more SNP selection methods into a single index when identifying informative SNPs, Ding et al. (Reference Ding, Wiener, Abebe, Altaye, Go, Kercsmer, Grabowski, Martin, Khurana Hershey, Chakorborty and Baye2011) suggested that combining one or more SNP selection methods in humans may provide a more reliable measure of genetic diversity. The Delta statistic is defined as the absolute difference in the frequencies of a particular allele observed in two populations (Ding et al., Reference Ding, Wiener, Abebe, Altaye, Go, Kercsmer, Grabowski, Martin, Khurana Hershey, Chakorborty and Baye2011), whereas the F st statistic depicts the proportion of genetic variance at a locus that can be explained by population structure (Ding et al., Reference Ding, Wiener, Abebe, Altaye, Go, Kercsmer, Grabowski, Martin, Khurana Hershey, Chakorborty and Baye2011). Combining the favourable characteristics from both measures of SNP informativeness in the present study resulted in more accurate breed predictions than those based on either statistic individually. In fact, in the Angus population, breed prediction using SNPs selected with the Delta statistic was consistently the poorest. Nonetheless, combining the Delta statistic with the F st statistic provided predictions superior to, albeit not significantly different from, the F st statistic alone. The correlation between the Delta and the global F st statistic for all medium-density SNPs (n=13 306) was 0.685 and 0.733, in the Angus and Hereford populations, respectively. The number of common SNPs selected by both the Delta method and the global F st method on the 300 SNP density panel was 109 and 125 in the Angus and Hereford populations, respectively. Therefore, it is clear that both the Delta and F st statistics are measuring different SNP characteristics and so an improvement in accuracy of breed prediction was possible by combining the favourable attributes of both approaches. This improvement in accuracy was most evident when the Index was generated as equal weighting (i.e. 50 : 50 combination) on both the Delta and F st statistics; combining the Delta and F st methods using an 80 : 20 or 20 : 80 weighting resulted in a lower accuracy of prediction of breed proportion in both the Angus and Hereford populations (results not shown).
As SNP panel density increased, the mean informativeness per SNP reduced. When SNPs were selected using the pairwise F st method for example, the average F st values for the 100, 300 and 600 panels were 0.148, 0.099 and 0.074 in the Angus population, and 0.189, 0.130 and 0.095 in the Hereford population, respectively. Nonetheless, the increased density of the panel more than offset the reduction in mean informativeness per SNP as panel density increased, thus leading to more accurate breed predictions with higher density panels.
The stronger, but not significantly different, correlation between predicted and actual breed proportion for the global F st method compared with the pairwise F st method agrees with results documented previously by Hulsegge et al. (Reference Hulsegge, Calus, Windig, Hoving-Bolink, Maurice van Eijndhoven and Hiemstra2013) when attempting to predict breed origin in cattle from four breeds. Nonetheless, the conclusions from the present study, and that of Hulsegge et al. (Reference Hulsegge, Calus, Windig, Hoving-Bolink, Maurice van Eijndhoven and Hiemstra2013), are in direct contrast to results presented by Wilkinson et al. (Reference Wilkinson, Wiener, Archibald, Law, Schnabel, McKay, Taylor and Ogden2011), in their study of identifying the breed origin of cattle from 17 breeds. Similarly, Kersbergen et al. (Reference Kersbergen, van Duijn, Kloosterman, den Dunnen, Kayser and de Knijff2009) reported that pairwise F st was more optimal than global F st as a method of selecting informative SNPs when trying to identify the continental origins of humans. Both Wilkinson et al. (Reference Wilkinson, Wiener, Archibald, Law, Schnabel, McKay, Taylor and Ogden2011) and Kersbergen et al. (Reference Kersbergen, van Duijn, Kloosterman, den Dunnen, Kayser and de Knijff2009) documented that global F st may not be appropriate to determine the level of genetic informativeness of an SNP when there are more than two populations being investigated and the method could result in the selection of SNPs which are specific in distinct populations. However, in the present study only contrasts between two populations (i.e. the Angus population v. everything else or the Hereford population v. everything else) were undertaken, substantiating why the global F st method outperformed the other selection methods. In both Hulsegge et al. (Reference Hulsegge, Calus, Windig, Hoving-Bolink, Maurice van Eijndhoven and Hiemstra2013) and Wilkinson et al. (Reference Wilkinson, Wiener, Archibald, Law, Schnabel, McKay, Taylor and Ogden2011) the pairwise F st was calculated by averaging all the pairwise F st values to produce an estimated information content for each SNP; this approach was different to that used in the present study, where the minimum F st per SNP for the pairwise comparison of the purebred Angus population to every other breed individually was used (the same approach was used in the Hereford population). As a comparison in the present study, the pairwise F st was also calculated by averaging the pairwise F st values when estimating the information content per SNP; predictions generated using this method were almost identical to predictions generated using the minimum F st per SNP for the pairwise comparison of the Angus v. every other breed (the same trend was evident in the Hereford population).
The lack of a significant difference in predictive ability amongst most of the SNP selection methods (with the exception of the Delta method which resulted in the poorest breed prediction in the Angus population, P<0.05), indicates that all methods investigated in the present study could be used in the development of ultra-low-density panels for accurate breed assignment. This is especially true as panel density increased.
Results from the present study indicate that accurate breed prediction (i.e. correlation between actual and predicted breed proportion of ⩾0.993 with a standard error of prediction ⩽0.039 and also good sensitivity) can be achieved using a genotyping panel density of between 300 and 400 SNPs. Although as panel density increased, the accuracy of prediction increased, HD panels may cost more and not be easily amenable to developing technologies, especially in some species where routine genotyping is not the norm. When panel density was <300 SNPs, the correlation between actual and predicted breed proportion weakened, concurrent with a large increase in RMSE and standard error of the prediction from Admixture. Both Kuehn et al. (Reference Kuehn, Keele, Bennett, Mc Daneld, Smith, Snelling, Sonstegard and Thallman2011) and Frkonja et al. (Reference Frkonja, Gredler, Schnyder, Curik and Solkner2012) using genomic data from cattle recommended that between 3000 and 5000 SNPs were necessary to generate accurate breed predictions. The fewer SNPs required in the present study compared with recommendations elsewhere (Kuehn et al., Reference Kuehn, Keele, Bennett, Mc Daneld, Smith, Snelling, Sonstegard and Thallman2011; Frkonja et al., Reference Frkonja, Gredler, Schnyder, Curik and Solkner2012) could be due to the fact that panels developed in the present study were to predict the breed composition of a single breed, whereas previous studies used the genomic data to predict the breed proportion of several breeds. Results from the present study do however support the requirement for higher density panels when attempting to predict breed proportion in several breeds; an ultra-low-density panel developed in one breed was not applicable to other breeds when <1000 SNPs are used. For example, when panels developed in the Angus population were used to predict the Hereford proportion, the mean reduction in the correlation between predicted and actual breed proportion relative to when the panels were developed in the Hereford population, were 0.068 and 0.031 when the panel density ranged from 100 to 500 SNPs and 600 to 1000 SNPs, respectively. Likewise, when panels developed in the Hereford population were used to predict the Angus proportion, the mean reduction in the correlation between predicted and actual breed proportion were 0.067 and 0.028 when panel density ranged from 100 to 500 SNPs and 600 to 1000 SNPs, respectively, when compared with panels developed in the Angus population. Furthermore, a 300 SNP panel was also developed using the most informative SNPs for both the Angus and Hereford breeds combined. The global index values for all SNPs in both individual breeds were averaged and a new index generated. The predictive ability of this panel was inferior to a panel developed using the information from only that breed (results not shown). Therefore, if breed assignment analysis was required across breeds, it is necessary to include between 300 and 400 SNPs per breed on the genotype panel.
Application
Results from this study suggest that at least 300 SNPs are required to accurately predict the Angus proportion in a biological sample with a further, mostly different, 300 SNPs required to predict the Hereford proportion. Nonetheless, ascertainment bias in the SNPs included in the present study exist which affects this threshold requirement. The SNPs available for selection in the present study were from the medium-density panel used by the Irish cattle population, developed predominantly for genomic selection (Berry et al., Reference Berry, McClure, Waters, Weld, Flynn, Creevey, Kearney, Cromie and Mullen2013). The base panel consisted of the commonly used Illumina low-density SNPs (Boichard et al., Reference Boichard, Chung, Dassonneville, David, Eggen, Fritz, Gietzen, Hayes, Lawley, Sonstegard, Van Tassell, VanRaden, Viaud-Martinez and Wiggans2012), but several thousand additional SNPs were included to aid imputation to higher density in beef cattle. As well as the requirement of being relatively equidistant across the genome, the additional SNPs had to have a high, within breed, minor allele frequency across all beef breeds. Such SNPs are probably not optimal for developing a low-density panel for breed prediction; a similar phenomenon would have been experienced in previous similar studies in cattle (Hulsegge et al., Reference Hulsegge, Calus, Windig, Hoving-Bolink, Maurice van Eijndhoven and Hiemstra2013) where SNPs were selected from the Illumina Bovine50 Beadchip (Illumina Inc., San Diego, CA, USA), which is also likely to have prioritised SNPs that were segregating across breeds. The impact of such ascertainment bias was determined in the present study by using the Delta method to select the 300 most informative SNPs (using the same approach as already outlined) from the original HD (i.e. 646 773 SNPs) genotypes in the 4042 purebred cattle in the present study. The mean difference in allele frequency between the Angus population v. each of the other breeds was 0.15 units greater than when the top 300 SNPs were selected from the medium-density panel. Furthermore, of the 300 SNPs selected using the Delta method from the medium-density panel, only nine of these were also selected by the HD panel. Therefore, the accuracy of breed prediction for the same number of SNPs could possibly be improved by selecting the SNPs from the higher density genotype panel. Nonetheless, the Illumina High Density Beadchip (Illumina Inc.) is also likely to suffer from ascertainment bias. Access to whole genome sequence (Daetwyler et al., Reference Daetwyler, Capitan, Pausch, Stothard, van Binsbergen, Brondum, Liao, Djari, Rodriguez, Grohs, Esquerre, Bouchez, Rossignol, Klopp, Rocha, Fritz, Eggen, Bowman, Coote, Chamberlain, Anderson, Van Tassell, Hulsegge, Goddard and Guldbrandtsen2014) on a sufficiently large population of animals from multiple breeds should provide the most informative SNPs. However, representation of different family lines per breed could be an issue until the time that whole genome sequence becomes routine.
Because of the low number of SNPs required for breed assignment, additional SNPs or structural mutations could also be included on a commercial panel to add value to the end user. For example, parentage SNPs or mutations with documented large effects on traits like meat quality (Sevane et al., Reference Sevane, Armstrong, Cortés, Wiener, Wong and Dunner2013) could be included on the panels. The SNPs chosen for breed assignment are unlikely to be very informative for parentage as they are chosen to have extreme, within breed, minor allele frequency. Many organisations or consortia are now generating their own custom genotype platforms; it may be advisable to include ~300 SNPs per breed for assignment should a requirement for ultra-low-density genotype platforms materialise in the future. Having these SNPs on a historical population with accurate breed composition known, based on the larger SNP panel, could be extremely useful for a reference population of the allele frequencies in the different breeds.
Supplementary material
To view supplementary material for this article, please visit https://doi.org/10.1017/S1751731116002457
Acknowledgements
Funding from the Irish Department of Agriculture, Food and the Marine FIRM research grant GENOTRACE and the FP7 project SEQSEL are greatly appreciated.