Love is one of the most complex human emotions, because it is linked with great joys and great sorrows. Despite its importance, Psychology did not pay attention until the 70s, when the first theories about love were developed (Cassepp-Borges & Martins, Reference Cassepp-Borges and Martins Teodoro2009). Since then, the study of love in a relationship has been a widely discussed topic in Psychology, possibly because of the influence this variable has on other fundamental aspects of a person, such as: Satisfaction with life, self-esteem, psychological and physical health, satisfaction with the relationship (Acevedo & Aron, Reference Acevedo and Aron2009; Dietch, Reference Dietch1978; Kim & Hatfield, Reference Kim and Hatfield2004; Lemieux & Hale, Reference Lemieux and Hale2000). Obviously, interest in this subject of study has encouraged researchers to develop valid and reliable instruments to measure it. But there are different ways of love depending on the type of relationship (e.g., friends, children, romantic relationships) which have been assembled into different taxonomies of love. According to Graham (Reference Graham2011) some of the best known love measures are: Loving and Liking (Rubin, Reference Rubin1970), Passionate Love Scale (Hatfield & Sprecher, Reference Hatfield and Sprecher1986), Love Attitude Scale (Hendrick & Hendrink, 1986) and Triangular Love Scale (Sternberg, Reference Sternberg1986).
Measures of love
Loving and Liking. This scale, one of the first developed (Rubin, Reference Rubin1970), measures love through three components: Attainment (desire to be close to someone), caring (desire to help the loved one) and intimacy (desire to be in union with the partner; possessiveness). Added to these was Liking, that measures positive affiliation, respect and similarity. The scale consists of 13 items on a Likert nine-point scale and presents high internal consistency: Coefficient alpha was .84 for women and .86 for men. Although Rubin posed both components as distinct, the research has shown that both factors, Love and Liking, together form a third factor called Companionate Love. It seems therefore, that both scales measure similar constructs that are relevant in romantic relationships (Fehr, Reference Fehr1994).
Passionate Love Scale. A scale developed by Hatfield and Sprecher (Reference Hatfield and Sprecher1986) to measure the passionate facet of love, is a uni-dimensional scale formed with 30 items that are included in a Likert nine-point scale. This factor explained 70% of the total variance and presented an internal consistency of .94 (Graham & Christiansen, 2008; Hendrick & Hendrick, Reference Hendrick and Hendrick1989).
Love Attitude Scale (LAS). Lee (Reference Lee1973, 1977) organizes the different forms of love into six categories, three main or primary styles, and three secondary. The main styles are: 1) Eros or passionate and romantic love, characterized by intense feelings and strong sexual attraction; 2) Ludus or playful love, characterized by a lack of emotional involvement, usually occurring in casual relationships; and 3) Storge or love as friendship or companionship characterized by the sharing of values and attitudes towards life. Secondary styles are: 1) Pragma or pragmatic love, based on the rational pursuit of a set of demographic characteristics in the beloved; 2) Agape or altruistic love, centered on emphasizing the welfare of the couple above self; and 3) Mania, or obsessive love characterized by jealousy, obsession with the partner, and intense feelings. These different styles of love can be measured using the LAS developed by Hendrick and Hendrick (Reference Hendrick and Hendrick1986), an instrument which deals with the six styles of love proposed by Lee (Reference Lee1973, 1977), through 42 items (6 per style) included in the Likert 5-point scale. The study by Hendrick and Hendrick (Reference Hendrick and Hendrick1989) presents the appropriate scale for psychometric qualities. Regarding the factorial validity, six factors were extracted using exploratory factor analysis, corresponding respectively to each of the styles of love, which accounted for 45% of the variance. Note that the different styles of love are reasonably independent, presenting correlations between them ranging from .02 to .37, in absolute value. As for the reliability, it was appropriate with values ranging from .67 to .84 for the six subscales and .82 for the total measurement.
Triangular Love Scale. Sternberg (Reference Sternberg1986, 1988, 1997) and his Triangular Theory of Love considers three main ingredients: Intimacy, passion and decision/commitment, which are metaphorically organized in a triangle. First, intimacy is related to "feelings of closeness, connectedness, and bondedness" (Sternberg, Reference Sternberg1986, p. 119) present in loving relationship, and including thoughts such as: Sharing, emotional support, high regard for the partner and intimate communication. Second, passion refers to "the drives that lead to romance, physical attraction, sexual consummation, and related phenomena in loving relationships" (Sternberg, Reference Sternberg1986, p. 119). Sexual needs are not only present in passion however. Others such as: Self-esteem, assistance/support, nurturing, affiliation, dominance, submission, and self-actualization, could also contribute to passion. And third, decision/commitment refers to "the short term recognition that one loves someone else, whereas commitment is the long term intention to maintain that love" (Sternberg, Reference Sternberg1986, p. 119).
According to Sternberg (Reference Sternberg1986) these three components are, in general, separable and interactive in loving relationships. Different combinations of them give place to eight distinct kinds of love: 1) Non-Love is the absence of all three components, 2) Linking is the presence of intimacy components without passion and decision/commitment, 3) Infatuated love is the presence of passion without the other two components, 4) Empty love is the presence of decision/commitment without passion and intimacy, 5) Romantic love is the combination of passion and intimacy components, 6) Companionate love is the combination of decision/commitment and intimacy components, 7) Fatuous love is the combination of passion and decision/commitment, and 8) Complete love is the full combination of all three components.
Sternberg (Reference Sternberg1986, 1997) developed a scale to measure different components of love, Triangular Love Scale (TLS), an instrument that has been widely used in research and is composed of 45 items (15 for each of the three components) in the 9-point Likert scale. The reliability was very appropriate presenting the three factors Cronbach’s Alpha values between .93 and .97 for the total scale. With respect to the convergent validity, the components of the TLS present positive correlations with some the LAS developed by Hendrick and Hendrick (Reference Hendrick and Hendrick1986): Eros (.53 to .64), Ludus (–.38 to –.41), Mania (.36) and Agape (.43 to .54); and no relation to Storge and Pragma, which would reflect discriminant validity of the TLS (Hendrick & Hendrick, Reference Hendrick and Hendrick1989). Regarding the factorial validity, employing a principal component analysis, studies reflect a structure of three components corresponding to the 3 dimensions identified by the author and explain around 60% of the variance (Hendrick & Hendrick, Reference Hendrick and Hendrick1986; Sternberg, Reference Sternberg1997). Nevertheless, the factor analysis shows that some items loaded more highly on an unintended factor than the one on which they were supposed to load, and others items loaded highly on multiple factors, indicating a high degree of item overlap and suggesting the presence of only one mayor construct or dimension of love (Acker & Davis, Reference Acker and Davis1992; Hendrick & Hendrick, Reference Hendrick and Hendrick1989). In fact, the three components of love are highly correlated (between .69 and .81), suggesting the presence of a second-order component (Hendrick & Hendrick, Reference Hendrick and Hendrick1986, Reference Hendrick, Hendrick, Lopez and Snyder2003; Masuda, Reference Masuda2003; Yela, Reference Yela1996, 1997). In the same line, Graham (Reference Graham2011) points out that, although Sternberg’s Triangular Theory of Love provides an elegant model of how the components of love combine to account for different styles of love, the correlations between the different components are so high, on average .75, that serious doubts arise about the independent nature of the same, suggesting the presence of a general factor of second order.
TLS shorter scales have been developed with good psychometric properties employing a Principal Component Analysis. Acker and Davis (Reference Acker and Davis1992) reduced the original Sternberg scale (1997) to 36 items by measuring the three components proposed by this author and explaining 63% of the total variance. The internal consistency of the subscales was acceptable with values between .80 and .93. Overbeek, Ha, Scholte, de Kemp, and Engels (Reference Overbeek, Ha, Scholte, de Kemp and Engels2007) used 19 items of the initial questionnaire, obtaining the three initial components that explain 69% of the total variance, with internal consistency values between .80 and .89. And Gouveia, da Fonseca, Cavalcanti, Diniz, and Dória (Reference Gouveia, da Fonseca, Cavalcanti, Diniz and Dória2009) were able to reduce the scale to 15 items composed of the three components that explained 67.7% of the total variance and with internal consistency values between .86 and .88.
Finally, Yela (Reference Yela1996) states that the passion component could be divided into two dimensions: Erotic and romantic. The author proposes a questionnaire of 60 items that measures four factors (intimacy, erotic passion, romantic passion and commitment), composed of some items of the Sternberg scale and other authors, which could be considered an integration of the previous scales that have tried to measure love. Unlike the rest of the authors, it uses an Exploratory Factor Analysis to analyze the internal structure of the scale. Find the four factors proposed that explain 44% of the total variance and 86% of the estimated common variance, with internal consistency values between .77 and .95. Subsequently, Yela (Reference Yela2006) reduced the number of items to 20 by choosing the 5 items of each subscale that most saturated in each factor with adequate internal consistency values for the four subscales: From .78 to .91. The main advantage of this reduced scale is that the correlations between the factors is lower (between .18 and .58) than the extended one (between .34 and .82), which could coincide with Sternberg’s (Reference Sternberg1997) proposal of a certain independence between the dimensions of love.
Could it be monarchical-hierarchical love?
In 2011, Graham performed a meta-analysis with the main measures of love and submitted the data to Principal Component Analysis with oblique rotation in order to see if there was any common underlying component. The measurements used were: Loving and Liking Scale (Rubin, Reference Rubin1970), Passionate Love Scale (Hatfield & Sprecher, Reference Hatfield and Sprecher1986), LAS (Hendrick & Hendrick, Reference Hendrick and Hendrick1986) and TLS (Sternberg, Reference Sternberg1986). The Loving factor of the Loving and Liking scale was eliminated due to the high collinearity that it presented with the rest of the variables. The results yielded three reasonably independent components that explained 66% of the variance: The first component was called General Love, and included the Liking Scale, the Passionate Love Scale, all dimensions of the Triangular Love Scale and fifty percent of the Love Attitude Scale. Obsession was the second factor only loaded by Mania from the LAS and the third component was loaded by Sorge and Pragma from the LAS and was named Practical Friendship. According to Graham the first component is general which represents love in a romantic relationship while the others dimensions are non-love. This result shows that the General Love factor is present in the main measurements of love and this is especially true in the case of the TLS because their three components have very high loads (passion .89; intimacy .84 and commitment .86). This result puts into question the triarchic structure of the TLS and clearly suggests the possibility of a monarchical-hierarchical structure on two levels, as previously found by Hendrick and Hendrick (Reference Hendrick, Hendrick, Lopez and Snyder2003) with the scale of Sternberg (Reference Sternberg1986). In addition, we must emphasize that the Principal Components Analysis is not an adequate technique to obtain latent factors from different measurements. For this type of objective, a Confirmatory Factorial Analysis or Structural Equations Models must be used (Hair, Black, Babin, Anderson, & Tatham, Reference Hair, Black, Babin, Anderson and Tatham2006). As far as we know, there weren’t studies done to test this question by this method.
Objectives of the research
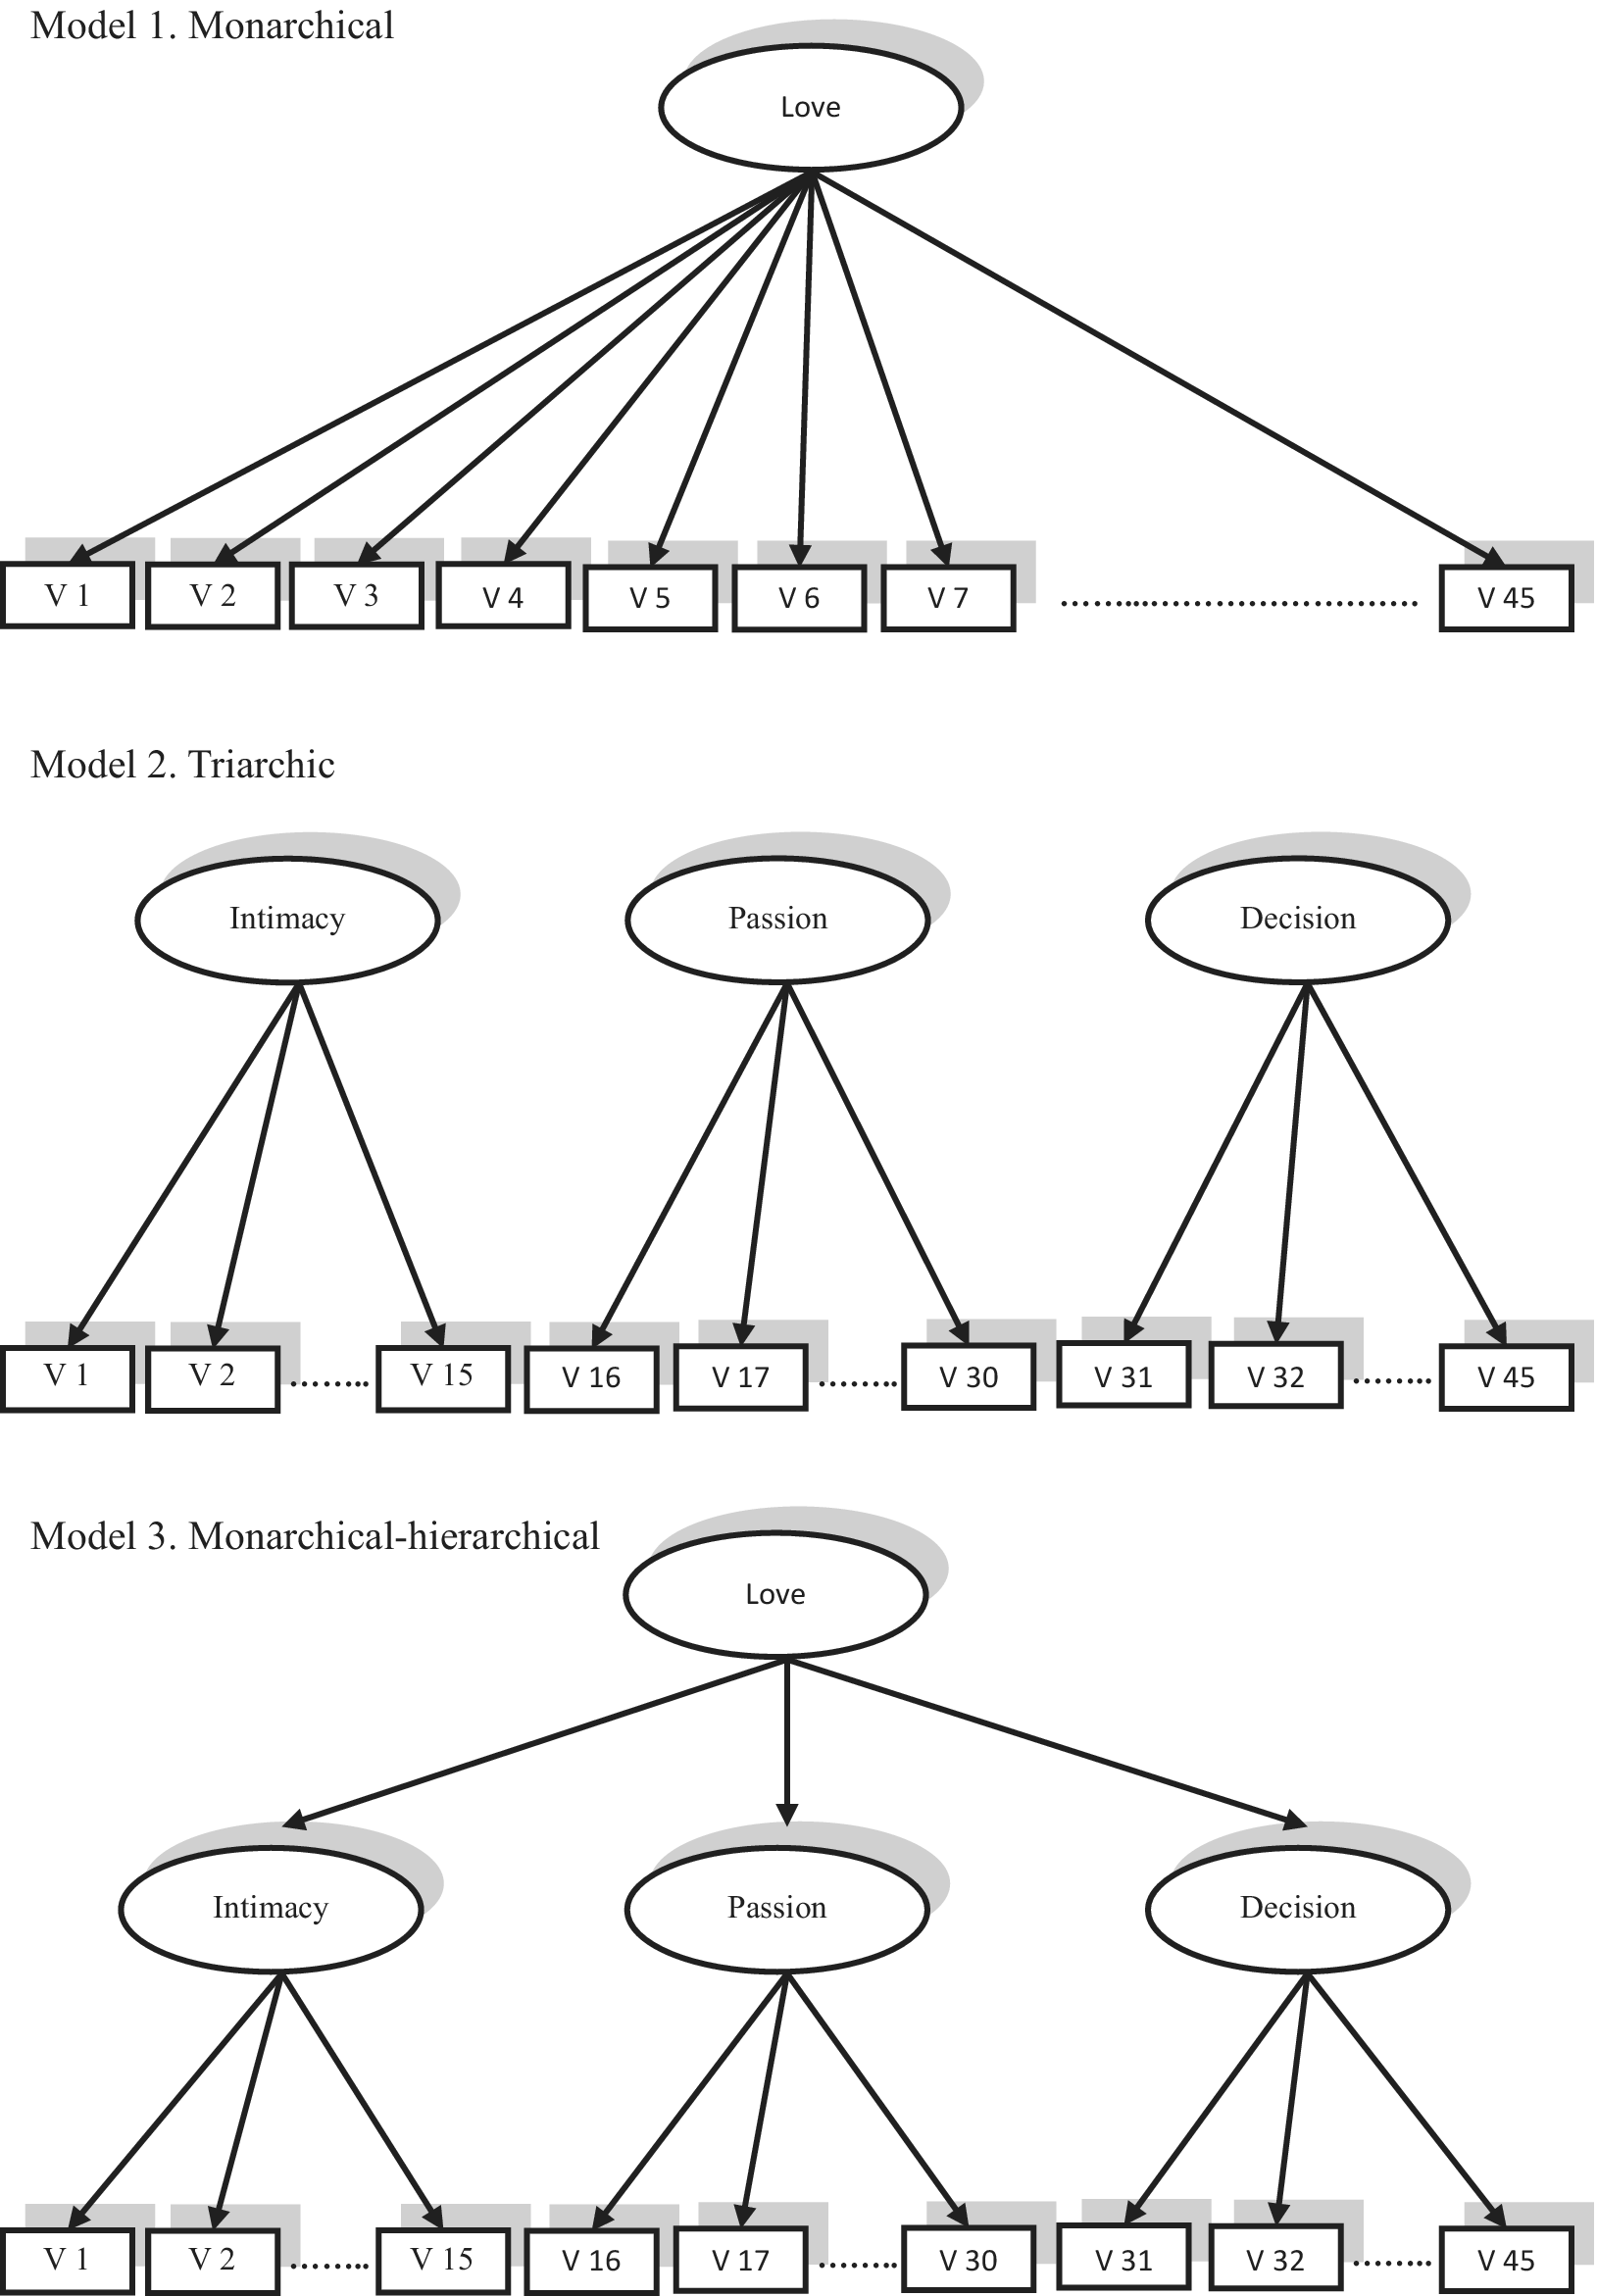
The first objective of this research is to know if the factorial structure of the TLS (Sternberg, Reference Sternberg1986) is triarquic, formed by three independent factors, or monarquic-hierarquic, compound of two levels: In the top the love general factor and behind the three related dimensions. For this, several alternative models were tested in order to see which one best fit the data: Uni-dimensional (monarchical) formed by a general factor, (triarchic), the three independent factors of first order, and hierarchical between a general factor of second order that explains the three factors of the first order (monarchical-hierarchical). In Figure 1 you can see the structure of these models.
Contrasted Models: Monarchical, Triarchic and Monarchical-hierarchical.

The second objective was to develop new items for the three components of love to develop an equivalent measurement of TLS but simpler, with a fewer number of items, and less overlap among items. We tested the psychometric properties of this new scale (reliability and evidence of convergent and discriminant validity) and we replicated the different structural equations model put on trial with the TLS. If there were coincident results between both scales, it would be evidence about the structure of love. We called this new scale Quality Partner Relationship Scale (QPRS).
Method
Participants
The sample consisted of 610 people with an average age of 30.02 years (SD = 13.09 years) range between 15 and 74 years, 55.1% of whom were women. The educational level was recorded in all areas: 5.6% primary, 6.9% middle school, 45.9% high school, 15.2% vocational training, 25.4% university graduate and 1.0% doctorate. A couple had lived together an average of 65.77 months (SD = 115.53 months) range between 1 and 594 months. 60.3% of them had steady partners but did not live together, 14.9% lived with the partner, and a 24.8% were married.
Measurements
The Cronbach Alpha indexes for each applied test are offered in the results section.
Measures used to test the structure of love:
1) TLS (Sternberg, Reference Sternberg1997): Measures the three components of love defined by Sternberg: Intimacy, Passion and Commitment. It is composed of 45 items in a Likert 9-point scale (15 for each of the three components).
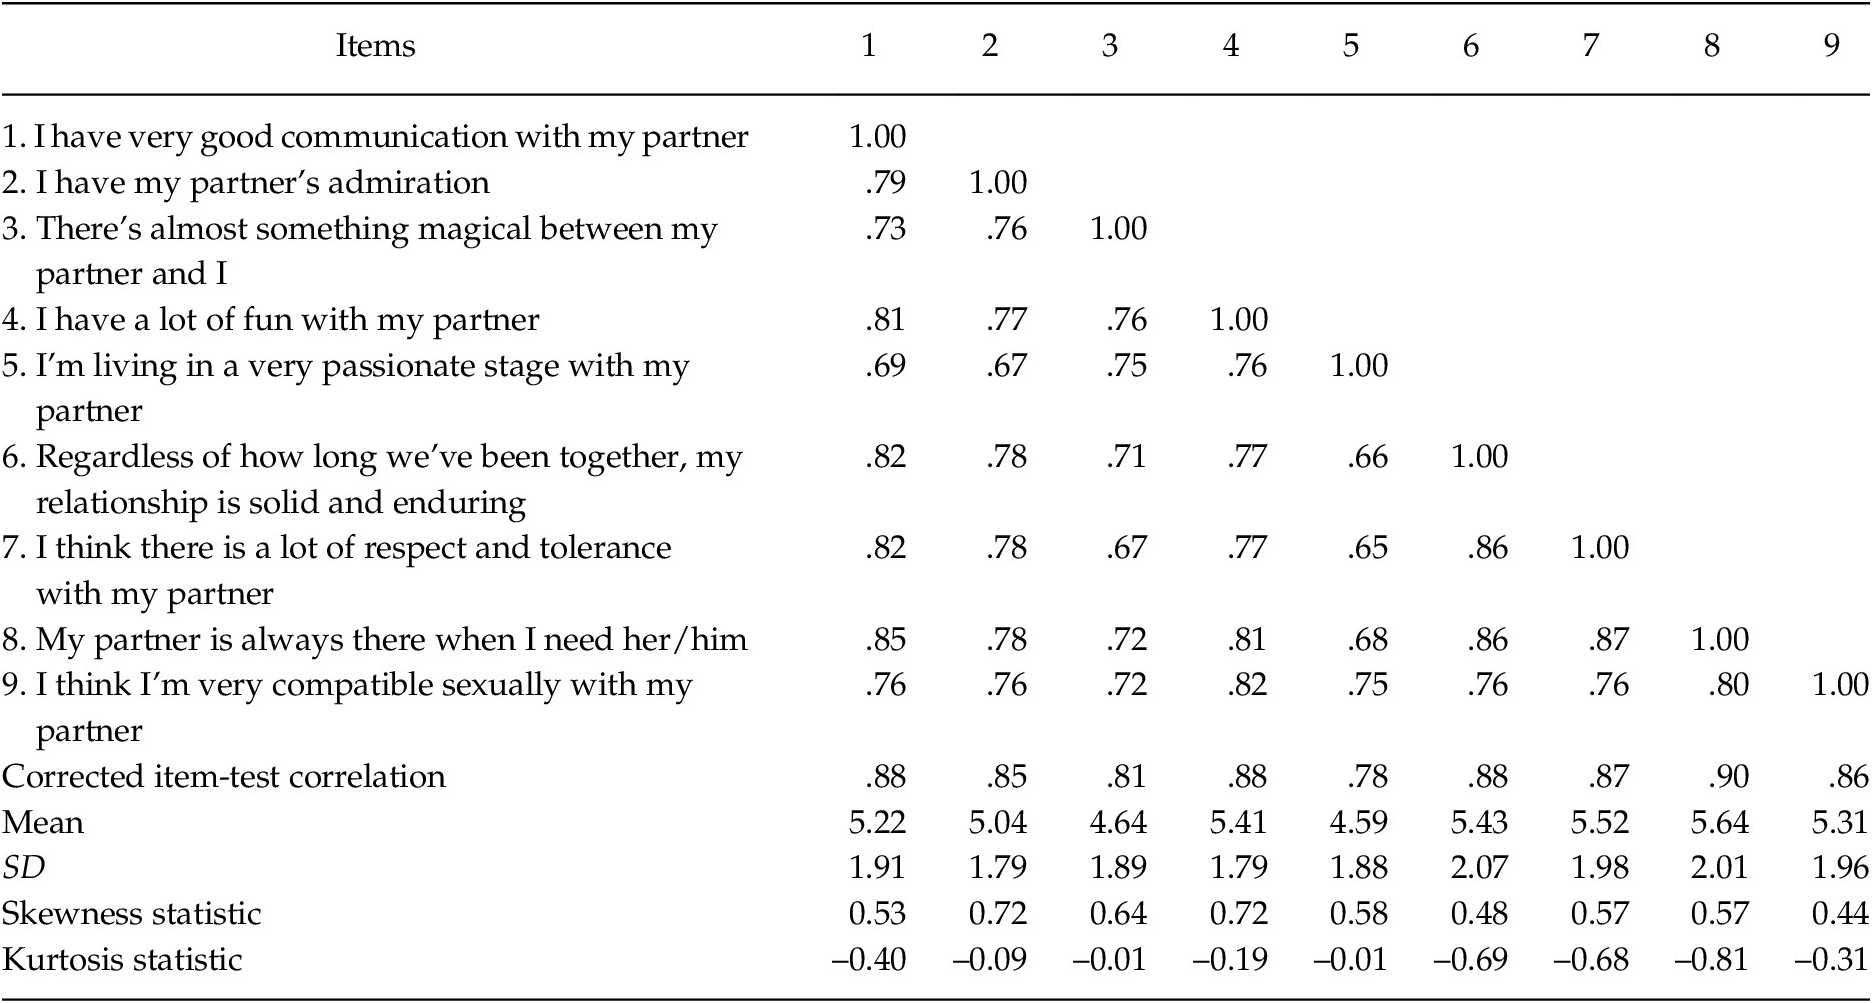
2) QPRS: To develop the scale items, a team of five researchers proceeded as follows: 1) They were well aware of the significance of the three components of love developed by Sternberg (Reference Sternberg1986); 2) the researchers developed a pool of 40 items where Sternberg’s three components of love were represented properly; and 3) to avoid overlap in item content, researchers selected the 9 best representative statements (see Table 2, to see the Spanish original version see Appendix). Those were used to configure the new short scale undergoing validation. It should be noted that the scale was developed and applied in Spanish. It was translated into English by a bilingual native English speaker, and written in English and Spanish for publication. Subsequently, the scale in English was translated into Spanish by a bilingual native Spanish/English speaker to ratify its equivalent in both languages to enable subsequent application in English.
Measure used to test the psychometric properties of QPRS:
1) TLS explained before.
2) LAS (Hendrick & Hendrick, Reference Hendrick and Hendrick1986): It measures six styles of love proposed by Lee (Reference Lee1973, 1976) through 42 items (seven about love style) indicated in a Likert 5-point scale.
3) Kansas Marital Satisfaction Scale (KMSS) (Schumm, Nichols, Schectman, & Grigsby, Reference Schumm, Nichols, Schectman and Grigsby1983): A brief measurement of 3 items measuring satisfaction in the relationship in a Likert 9-point scale.
4) Satisfaction with Life Scale (SWLS) (Diener, Emmons, Larsen, & Griffin, Reference Diener, Emmons, Larsen and Griffin1985). This is probably the most used scale to measure Subjective Well-Being. It is composed of five items to assess the degree of satisfaction with life in general in a Likert 5-point scale.
5) Positive Psychological Functioning Scale (PPF) (Merino & Privado, Reference Merino and Privado2015). This is a scale of 33 items which measure 11 psychological key resources in a Likert 5-point scale: Autonomy, resilience, self-esteem, purpose in life, enjoyment, optimism, curiosity, creativity, humor, environmental mastery and vitality. The 11 measures are grouped into a general factor of positive psychological functioning, which measures psychological well-being and is what we used.
6) Positive and Negative Affect Schedule (PANAS) adapted by Sandín et al. (Reference Sandín, Chorot, Lostao, Joiner, Santed and Valiente1999) from the original version of Watson, Clark, and Tellegen (Reference Watson, Clark and Tellegen1988). It is composed of two scales of 10 items each, one for Positive Affect and one for Negative Affect, in a Likert 5-point scale.
Procedure
Different evaluators, instructed by researchers, recruited the participants in a non-random way, so, it was a convenience sample. In order for the sample to be as heterogeneous as possible, people of both sexes were selected between 15 and 75 years of age, of different educational level and who had a partner at the time of the study. The evaluators assessed the sample, and ensured that the participants read and signed the informed consent and understood the instructions before completing the questionnaires. Only one partner per couple responded to the questions. The research was carried out over two years.
Statistical analysis
First, descriptive statistics and reliability of the scales, Cronbach’s alpha, using the statistical package of SPSS V. 18.0 were analyzed.
Second, a Structural Equation Model with AMOS V. 7.0 (Arbuckle, Reference Arbuckle2006) was used for studying the evidence of internal validity of TLS to contrast the three alternative models proposed: Monarchical, triarchic and monarchical-hierarchical. These models require at least three measurement indicators to accurately estimate the latent factors, with a minimum of 100 participants, and 10 times the number of observed variables (Byrne, Reference Byrne2001). This analysis used a sample of 610 participants and 45 indicators (items) for the model, which are 610/45 = 14 participants per indicator. The procedure used to fit the models was maximum likelihood. The goodness of fit statistics used to evaluate the adequacy of the models were: Absolute, incremental and parsimony. 1) The value of the absolute fit of the model to empirical data indicates the statistic χ2. The null hypothesis, the matrix theoretical and empirical data being equal, is commonly rejected with large samples, so the ratio χ2/df (Bentler & Bonett, Reference Bentler and Bonett1980) is often used, indicating a good fit with values less than 3. Another absolute fit index is: Root Mean Square Error of Approximation (RMSEA) (Steiger, Reference Steiger1990). The RMSEA values below .05 indicate good fit. You can also see the absolute adjustment by examining the standardized residuals matrix: If there are few higher values |± 1.96| we can affirm that there is little discrepancy between the estimated and observed covariance matrix and the data would be well adjusted (Byrne, Reference Byrne2001). 2) Incremental fit measures compare the resulting model with the null model. Normed Fit Index (NFI) of Bentler and Bonett (Reference Bentler and Bonett1980) and Comparative Fit Index (CFI) of Bentler (Reference Bentler1990) are the most frequently used. Values above .95 indicate good fit and then the empirical model is significantly different from the null model. 3) Parsimony fit measures evaluate the model fit versus the estimated number, taking into account the complexity of the hypothesized model in the assessment of overall model fit. Parsimony Goodness of Fit Index (PGFI) of Jöreskog and Sörbom (Reference Jöreskog and Sörbom1993) and Parsimony Normed Fit Index (PNFI) of James, Mulaik and Brett (Reference James, Mulaik and Brett1982) are more representative coefficients and values above .50 indicate good fit.
Third, a Structural Equation Model was performed with AMOS V. 7.0 to evaluate the evidence of internal validity in the QPRS, as had been done with the TLS, in order to contrast which of the three models presented a better fit to the data. In this analysis, a sample of de 610 participants and 9 indicators (items), which are 610/9 = 68 participants per indicator.
Fourth, the evidence of convergent and discriminant of the QPRS with the rest of the measures collected, were analyzed using Pearson correlations. These analyses were performed using SPSS statistical package V. 18.0.
Results
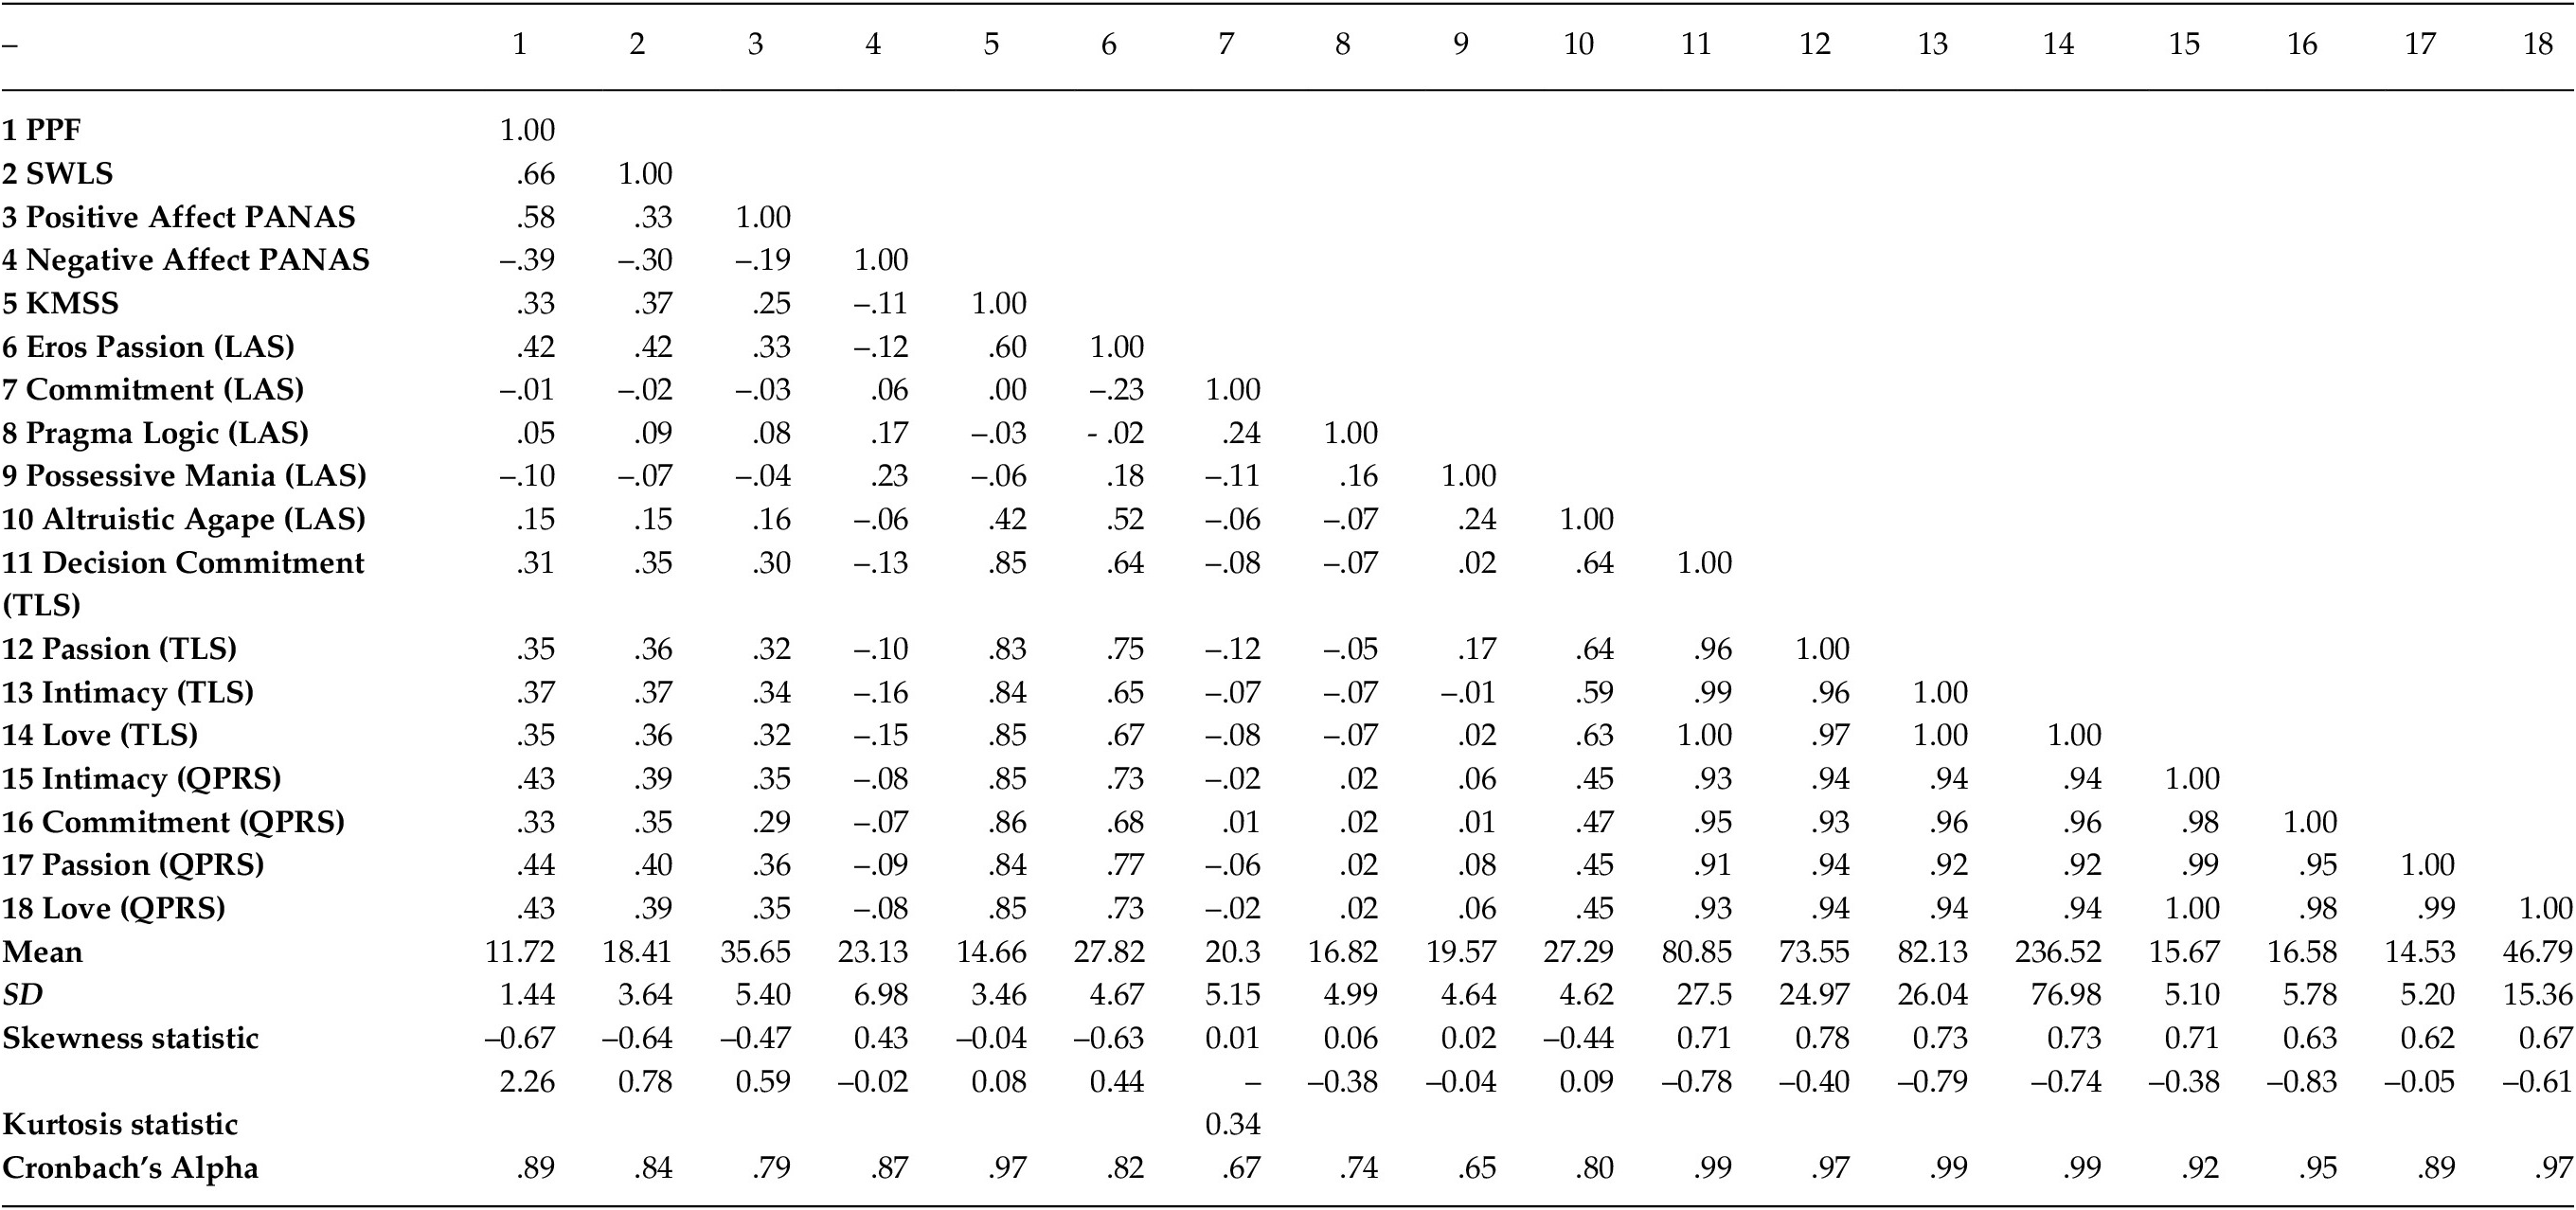
Descriptive and reliability: Table 1 shows the descriptive data (mean, SD, asymmetry and kurtosis) and the reliability of the different measures used in the present study. According to West, Finch, and Curran (Reference West, Finch, Curran and Hoyle1995) values of asymmetry and kurtosis are not excessively high (asymmetric statistic less than 2 in absolute value statistic kurtosis less than 7 in absolute value) and can be considered adequate. In our case, all measures meet these criteria. Regarding reliability, .70 is the minimum value recommended (Abad, Olea, Ponsoda, & Garcia, 2011), in our case, some measures presented lower values. Specifically, the measures with low reliability were: Resilience, Environmental Mastery, Enjoyment and Creativity all of the PPF, and Ludus of the LAS. These scales were excluded of the convergent and discriminant analysis due to the low reliability obtained.
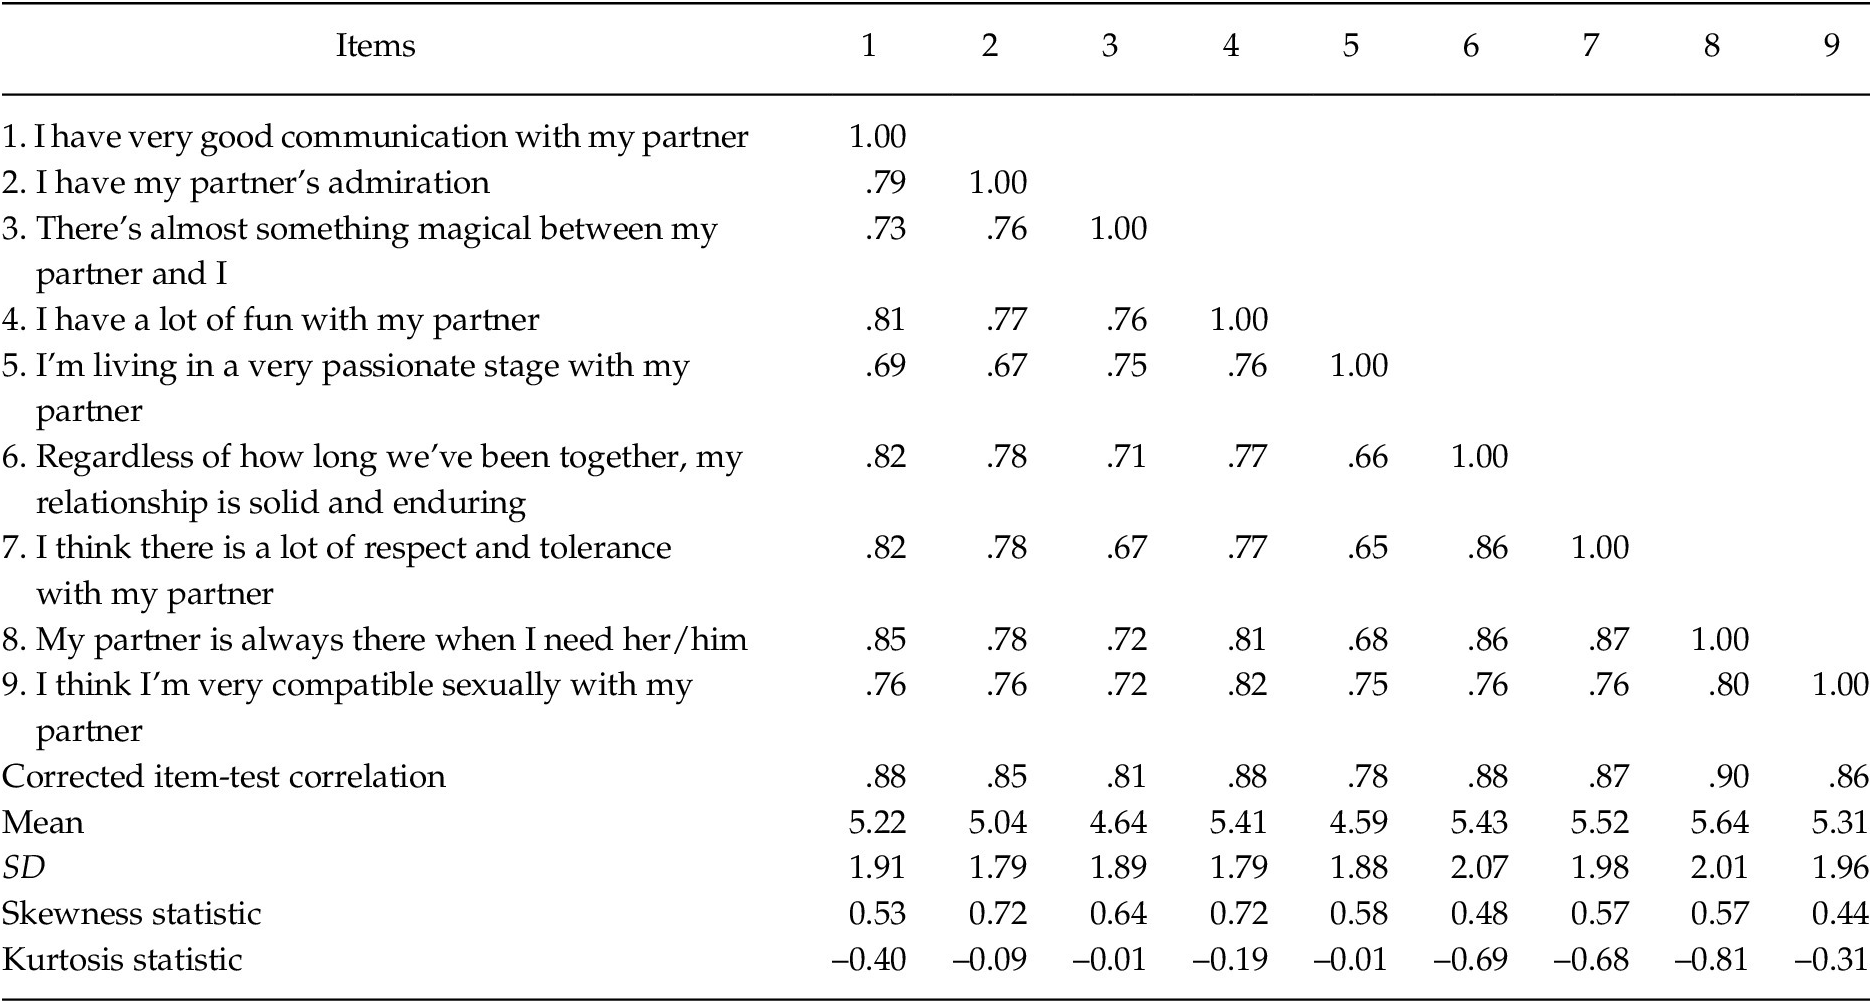
We also analyzed the distribution of the items of the two tests (QPRS and TLS) that were going to be submitted to Structural Equations Models, since it was going to be used as the Maximum Likelihood estimation procedure. In both cases, the values were among those recommended by West et al. (Reference West, Finch, Curran and Hoyle1995). In Table 2 these data can be consulted for QPRS. For the TLS the skewness statistics showed values between .46 and .77 and those of kurtosis between –1.06 and .16.
Descriptive Statistics, Reliability and Pearson Correlations of the Measures (*)

Note.
* Correlations > |± .10| are statistically significant at 5%.
Descriptive Statistics and Pearson Correlations between QPRS Scale Items and Corrected Item-test Correlation
Note. * All correlations are statistically significant at 1%.
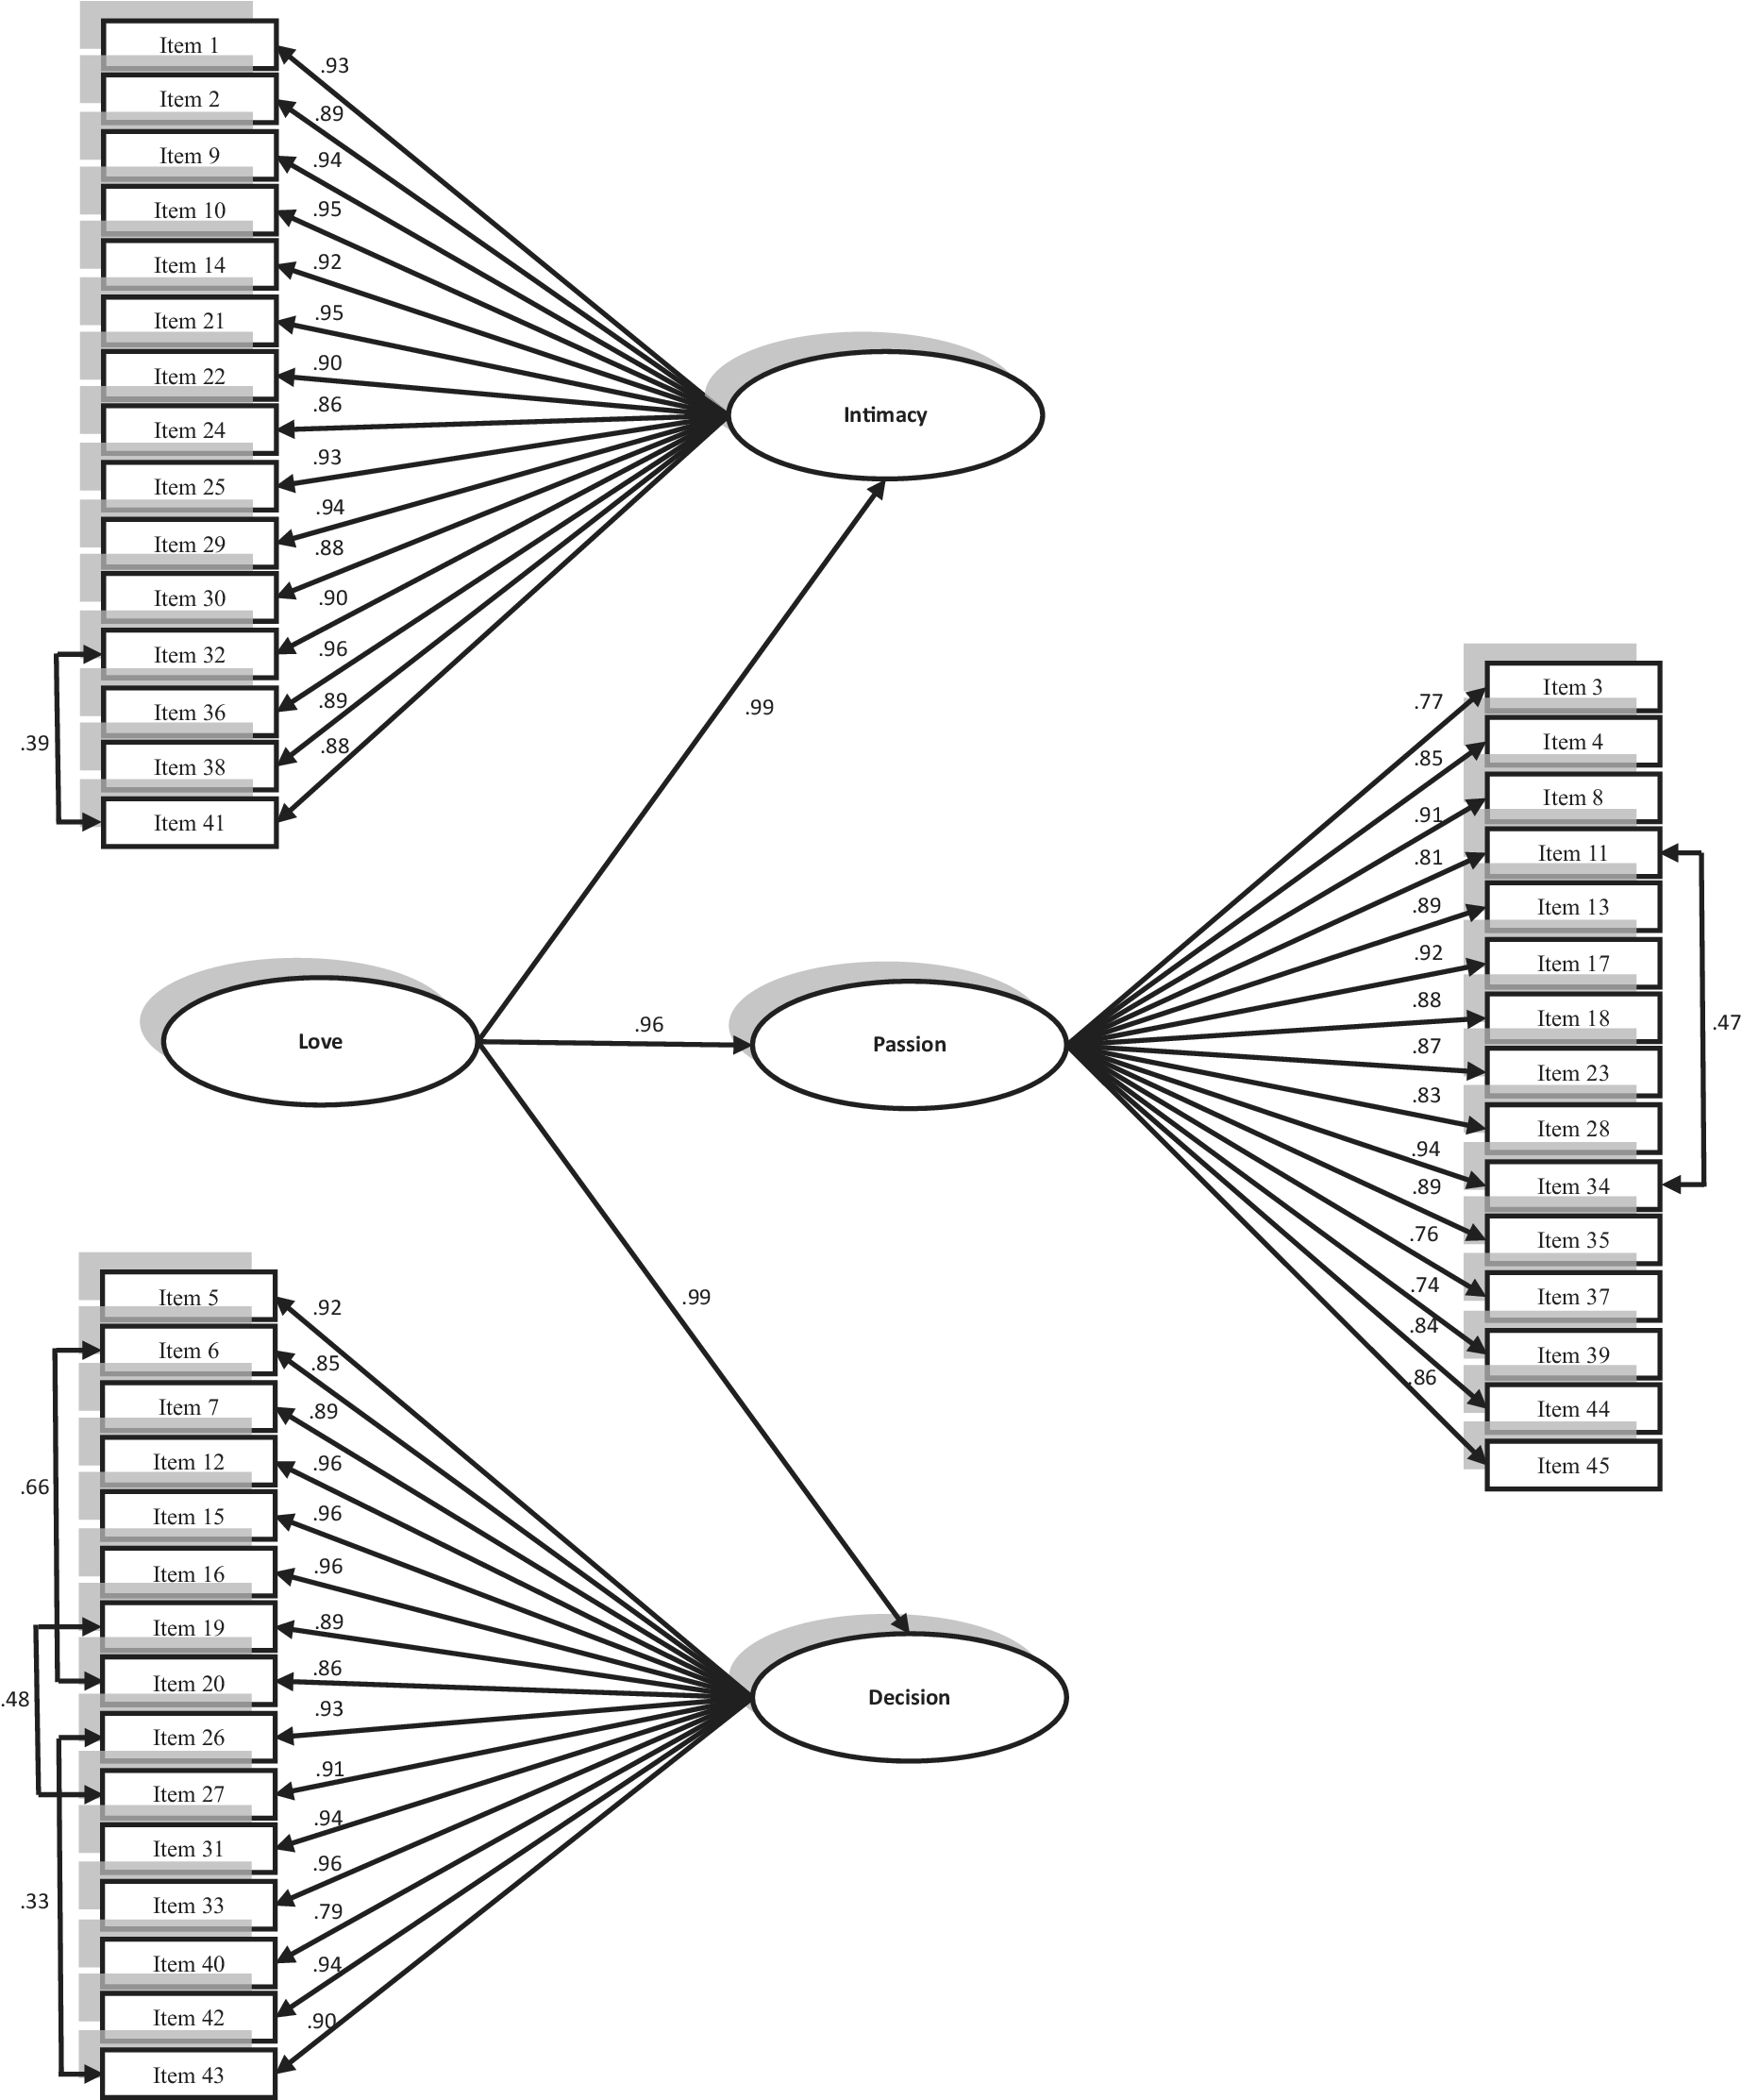
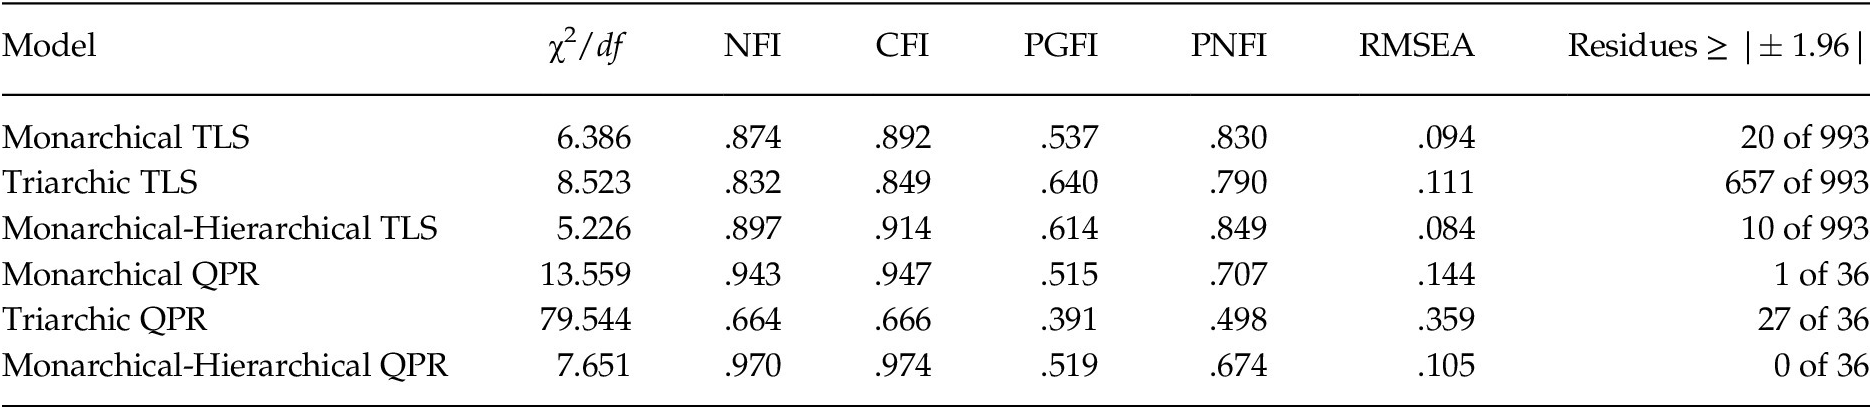
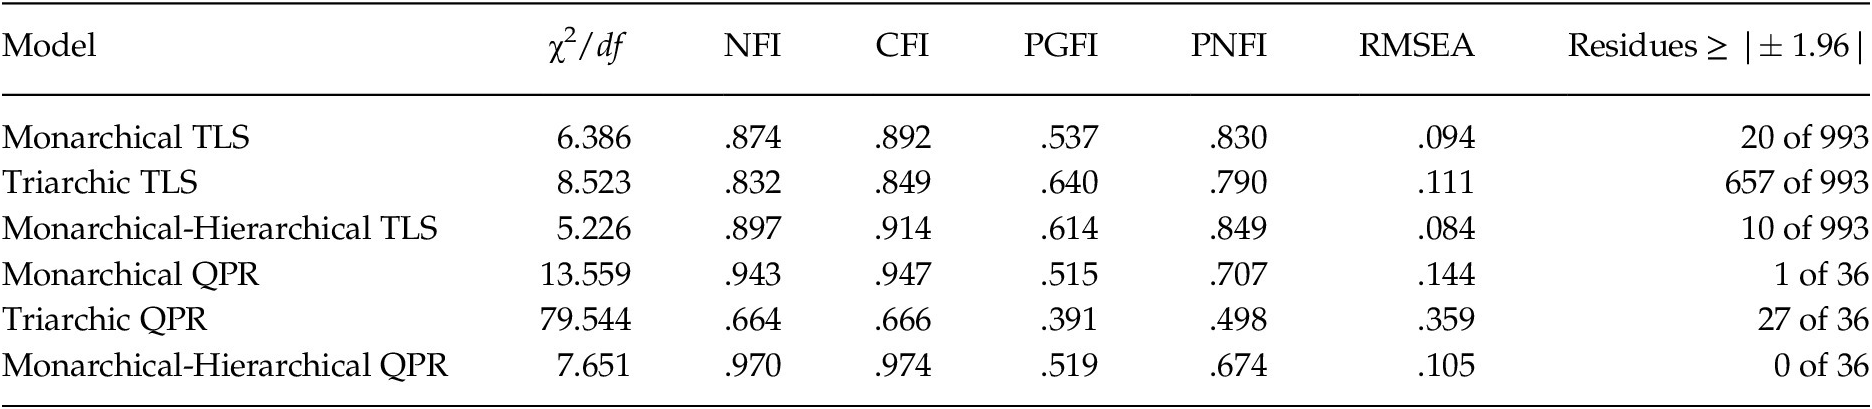
Evidence of Internal validity of TLS. The internal structure of the TLS was analyzed contrasting three alternative models (monarchical, triarchic and monarchical-hierarchical). In Table 3 you can see the goodness-of-fit statistics of these models. As you can see, the model that best fits the data is the monarchical-hierarchical and the worst the triarchic. Therefore, it seems more appropriate to consider this type of structure in this questionnaire: Three factors of the first order that can be explained in turn by a factor of second order of love. Figure 2 shows this model with the corresponding factorial weights. The adjustment of the monarchical-hierarchical model is adequate according to the CFI, PGFI, PNFI, RMSEA and the significant residues, so it can be considered that there is a fairly adequate adjustment to the data. To achieve this adjustment it was necessary to correlate several errors of some items: a) Item 6 (I will always feel a strong responsibility for my partner) and 20 (I feel a sense of responsibility toward my partner), b) Item 11 (I cannot imagine life without my partner) and 34 (there is nothing more important to me than my relationship with my partner), c) Item 19 (I could not let anything get in the way of my commitment to my partner) and 27 (because of my commitment to my partner, I would not let other people come between us), d) Item 26 (I expect my love for my partner to last for the rest of my life) and 43 (I view my relationship with my partner as permanent), and e) Item 32 (I communicate well with my partner) and 41 (I feel that my partner really understands me).
Monarchical-hierarchical Model for the TLS Scale.

It can be seen that each pair of items are very similar, so it is expectable that the measurement error is shared. Moreover, this indicates that TLS has many redundant statements that reflect the same aspects.
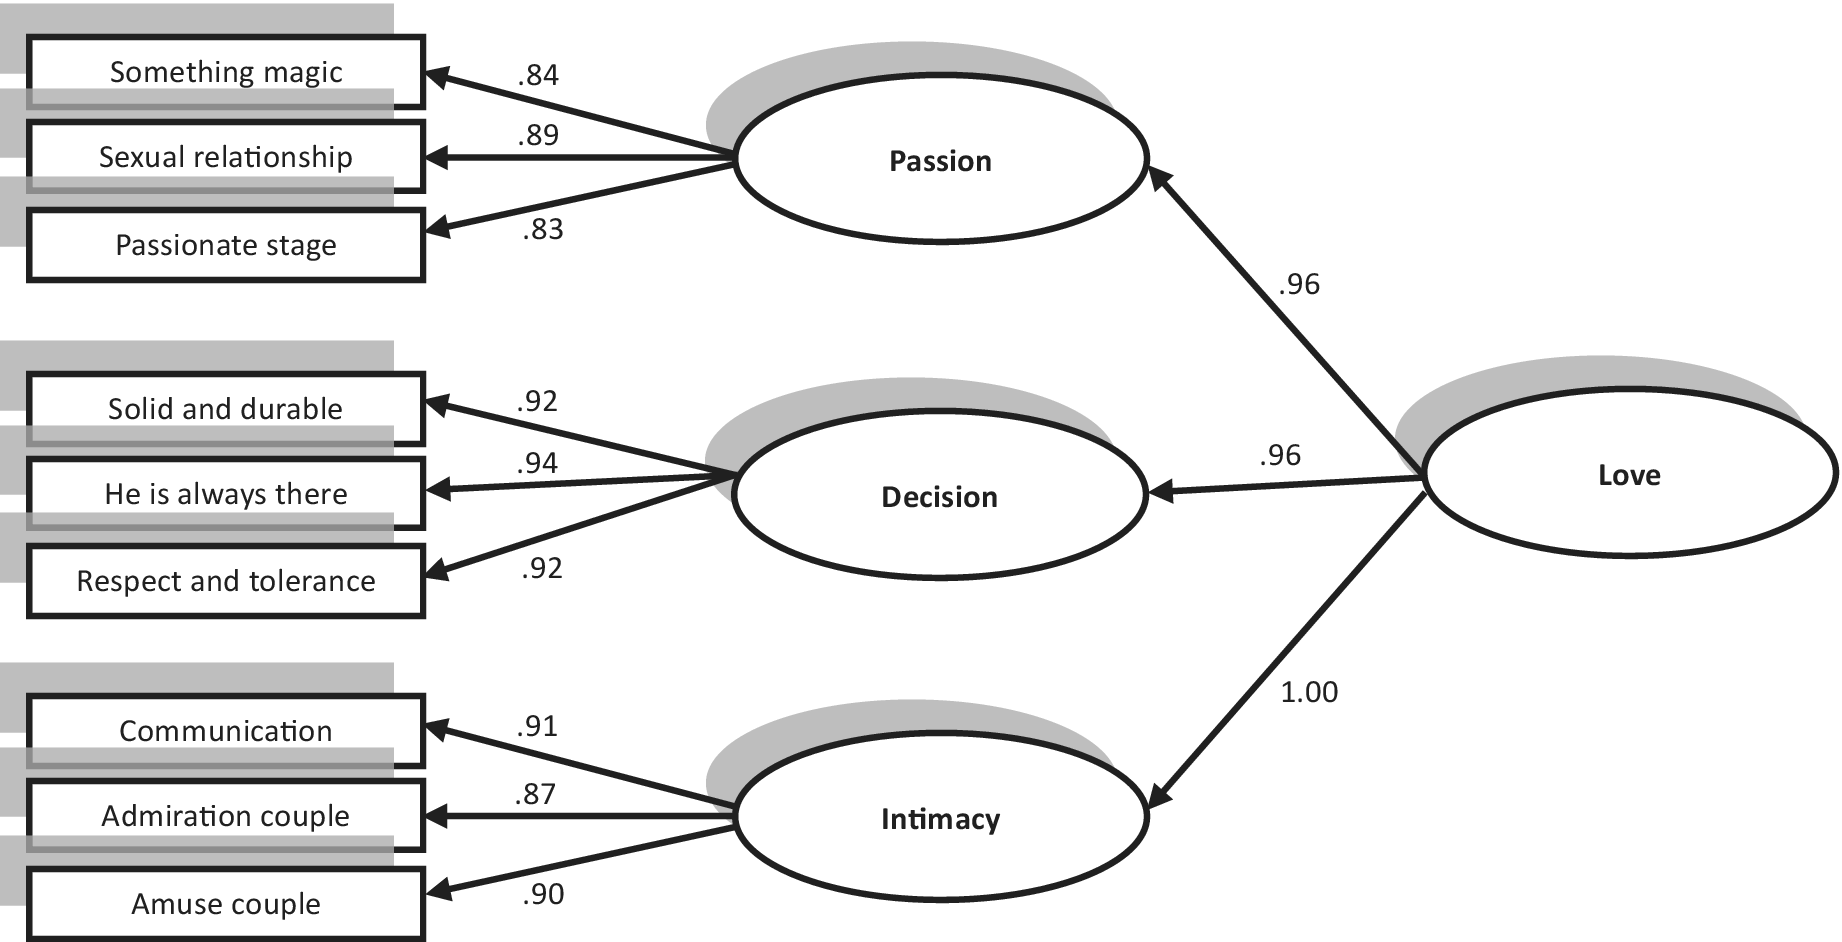
Evidence of Internal validity of QPRS. To analyze the internal structure of a confirmatory scale model in which all items saturated in one latent factor, was performed. As seen in Table 2 all items have high Pearson correlations (over .65) which would justify the presence of latent factors, accounting for the different items of the QPRS. The same models were contrasted as in the case of the TLS, in Table 3 the goodness- of- fit statistics appear. The model that best fits the data is the monarchical-hierarchical and the worst the triarchic. Therefore, the scale proposed, as with the TLS, has a hierarchical structure with three factors of first order and general factor of love. Figure 3 shows the representation of the model with the estimated factor weights.
Monarchical-hierarchical Model for the QPRS Scale.

Reliability of QPRS. Once the factorial structure of the scale has been established, the reliability of each subscale and the total scale can be calculated. Table 1 shows Cronbach’s Alpha for each subscale, greater than .88. In regards to the reliability of all scales, Cronbach’s Alpha is .97 which is a very high value. Moreover, the correlation of each item is calculated by the total scale eliminating this item itself, i.e. corrected correlation-test item. In Table 2 the results obtained in this correlation can be seen with values that reflect the internal discrimination scale. The values are much higher than the ideal of .40, so we can consider that the scale has high internal discrimination in all items (Abad et al., Reference Abad, Olea, Ponsoda and García2011).
Goodness-of-fit for the Contrasted Models in TLS and QPRS 47
Evidences of convergent and discriminant validity of QPRS. The Pearson correlations presented by the QPRS with the rest of the measurements were studied in order to analyze if the relationship pattern is theoretically adequate. Table 1 shows the results found. Regarding the convergent validity, we found very high correlations (.91 to .96) between the components of the QPRS and those of the TLS, which show, as we expected, that both scales measure the same. Regarding the relationship of the QPRS with the LAS: There is a high average relation to Eros Passion (.68 to .77) and average with Agape Altruistic (.45 to .47) which would indicate that the test developed in this study would measure aspects similar to these other measures. Regarding the correlations found with the measures of well-being and satisfaction, we found a very high correlation between the QPRS and the KMSS (.84 to .86) which indicates that good quality in the couple’s relationship is associated with partnership satisfaction. Regarding the rest of the well-being measures, we found average results: The correlations found with the PPF were from .33 to .44; with the SWLS from .35 to .40 and with positive affect from .29 to .35. On the other hand, the negative affect showed no correlation with the QPRS, all values being very close to zero. These results mean that in the global well-being of the person, the couple is a factor to consider, but not the only one. Regarding the discriminant validity, it should be noted that the QPRS, as expected, did not present a correlation with the following LAS scales: Manía, Storge and Pragma, because, in all cases, the correlations were very close to zero. This constitutes clear proof of the discriminant validity of the QPRS scale.
In view of the correlations found, we can say that a person with a high quality relationship would have an average positive psychological functioning and subjective well-being, an average positive affect, high marital satisfaction and type of Eros and Agape love.
Discussion
In the present investigation, the factorial structure of one of the most-used scales to measure love (TLS) developed under the triarchic model of Sternberg (Reference Sternberg1986) has been analyzed. Through this approach, it is assumed that love would be composed of three independent components: Intimacy, passion, and decision/commitment. In addition, to check this model, known as called triarchic, we endeavored to see if love could be formed by a single latent factor of the first order (monarchical) or alternatively by three factors of the first order and one of the second order more general (monarchical-hierarchical). At the same time, a new scale has been constructed that studies the quality of the partnered relationship (QPRS) that tries to measure the same as the TLS, but simplifying the number of items and eliminating those with a lot of overlap. This new scale has undergone the same contrasts as the scale of Sternberg (Reference Sternberg1986).
Unlike other previous studies, such as that of Graham (Reference Graham2011), in our case we propose an analysis technique of a Structural Equations Model that collects only the variance common to the measured variables and allows a better estimation of the measurement errors of the model (Hair et al., Reference Hair, Black, Babin, Anderson and Tatham2006).
The results, both in the case of the TLS and the QPRS, indicate that the structure that best explains love is the monarchical-hierarchical type, where three factors of the first order (intimacy, passion and decision) which in turn would be explained by a factor of second order that we could call general love. The model that shows the worst adjustment to the empirical data is precisely that of the triarchic type, which would contradict the model proposed by Sternberg (Reference Sternberg1986). The new measure we offer, in addition to having a better fit to the data than the TLS, presents adequate reliability and evidence of convergent and discriminant validity. In particular, a person with a high quality relationship would be very satisfied with the relationship, and would be immersed in a romantic and passionate type of love in which there would be interest in satisfying the needs and interests of the partner. All this combines with average levels of psychological and subjective well-being, since the partnership is a very important element for well-being, but not the only factor that explains it.
These results coincide with those of other authors who already found a relationship between love, satisfaction with life, psychological health and satisfaction with the relationship (Acevedo & Aron, Reference Acevedo and Aron2009; Dietch, Reference Dietch1978; Kim & Hatfield, Reference Kim and Hatfield2004; Lemieux & Hale, Reference Lemieux and Hale2000). Previously, a relationship has also been found between the measure of love of TLS and Eros and Agape of LAS (Hendrick & Hendrick, Reference Hendrick and Hendrick1986), which would justify the relationship between our scale (QPRS) and these measures. However, no relationship was found between the TLS and Storge and Pragma of LAS, as has happened in our case with the QPRS. Where we did not find similar results was relating our scale to Mania of LAS, since this measure has been related to the TLS previously. This data would indicate that our scale would not include aspects of love related to jealousy, obsession with the partner and intense feelings. In any case, our measure shows clear evidence of convergent validity, with very high correlations (r > .90) with the components of TLS scale, which implies a clear advantage because our scale measures the same constructs with a smaller number of items.
Previously, other scales have been proposed with fewer than the initial 45 items of the Sternberg’s TLS (1986), either with a subset of new items (Acker & Davis, Reference Acker and Davis1992; Gouveia et al., Reference Gouveia, da Fonseca, Cavalcanti, Diniz and Dória2009; Overbeek et al., Reference Overbeek, Ha, Scholte, de Kemp and Engels2007) or by adding other measures related to love (Yela, Reference Yela2006). In these cases, as in the scale proposed here, adequate psychometric properties have been obtained. However, QPRS achieved these results even with only 9 items.
Unlike Sternberg (1996), there is research that suggests that the most consistent data, does not consider the different components of love as independent. Specifically, Acker and Davis (Reference Acker and Davis1992) already proposed as a simpler structure which considers a general factor of love that explains the other components. Other authors, as in our case, suggest that the best model is one that considers a monarchical-hierarchical structure (Graham, Reference Graham2011; Hendrick & Hendrick, Reference Hendrick and Hendrick1986, Reference Hendrick, Hendrick, Lopez and Snyder2003; Masuda, Reference Masuda2003; Yela, Reference Yela1996, 1997). And on the other hand, it is proposed that perhaps considering four factors, dividing Passion into Erotic and Romantic, would lead to some independence between the components of love (Yela, Reference Yela2006).
Among the possible limitations that our research may have, the fact that it is a correlational study is highlighted, but this limitation has tried to be supplicated by collecting a sample as wide as possible in age, sex, educational level, relationship time and a considerable size (N = 610). In some collected measures the reliability has been very low, but these measures were removed from the analysis so as not to affect the validity of the test that was intended to be tested.
In order to improve the research, possible future investigations may be proposed to further analyze how the quality of the couple’s relationship varies over time. In our case, it is a cross-sectional study, a longitudinal study would allow us to see whether the quality in the relationship is equal to the length of time they have been together or not. Other measures could also be collected that are probably related to love, such as personality, intelligence and temperament, since they could be variables that shape the quality of the relationship. Equally we could try to repeat this study in another non-Western type of culture, asking if the structure of love is universal, or if there are differences that we could say are due to the culture in which the person is immersed. Research has only considered heterosexual couples, but it would be interesting to see if the results are the same for people in non-heterosexual relationships. The data of the present investigation has only been obtained from one member of a couple, but we wonder if there would be a similar kind of relationship between both members of the couple when considering the quality of the couple. Finally, it would be interesting to consider Yela’s approach (1996, 2006) and implement the two passion sub-factors on our scale. In this way it could be seen whether the hierarchical structure of love is effectively maintained or it is more appropriate to think of a structure of independent factors.
Appendix: Spanish Original Version of QPRS
Escala de Calidad en la Relación de Pareja
1. Tengo muy buena comunicación con mi pareja.
2. Cuento con la admiración de mi pareja.
3. Existe algo casi mágico entre mi pareja y yo.
4. Me divierto mucho con mi pareja.
5. Mi pareja y yo estamos viviendo un momento muy pasional.
6. Con independencia del tiempo que llevamos juntos, mi relación de pareja es algo sólido y duradero.
7. Considero que en mi pareja hay mucho respeto y tolerancia.
8. Mi pareja siempre está ahí cuando la necesito.
9. Considero que estoy muy compenetrado sexualmente con mi pareja.