1. Introduction
Neotethyan ophiolites in Anatolia are located along several E–W-trending suture zones separated by continental blocks, metamorphic core complexes and sedimentary basins (Şengör & Yılmaz, Reference Şengör and Yılmaz1981; Robertson & Dixon, Reference Robertson, Dixon, Dixon and Robertson1984; Robertson, Reference Robertson2002, Reference Robertson2006; Dilek & Thy, Reference Dilek and Thy2009). These suture zones are marked by ophiolites, ophiolitic melanges and ophiolite-related metamorphic rocks (Okay, Reference Okay, Evans and Brown1986; Parlak, Delaloye & Bingöl, Reference Parlak, Delaloye and Bingol1995; Önen & Hall, Reference Önen and Hall2000; Vergili & Parlak, Reference Vergili and Parlak2005; Parlak, Yılmaz & Boztuğ, Reference Parlak, Yılmaz and Boztuğ2006; Parlak et al. Reference Parlak, Rizaoğlu, Bağci, Karaoğlan and Höck2009; Robertson, Karamata & Saric, Reference Robertson, Karamata and Saric2009; Pourteau, Candan & Oberhänsli, Reference Pourteau, Candan and Oberhänsli2010; Okay & Whitney, Reference Okay and Whitney2010; Dilek & Furnes, Reference Dilek and Furnes2011). These tectonic units were emplaced in Late Cretaceous time as a result of a series of collisions of intraoceanic arc-trench systems with the continental margins (Robertson, Reference Robertson2002, Reference Robertson2004, Reference Robertson2006; Flower & Dilek, Reference Flower, Dilek, Dilek and Robinson2003; Dilek & Flower, Reference Dilek, Flower, Dilek and Robinson2003; Dilek, Furnes & Shallo, Reference Dilek, Furnes and Shallo2007; Dilek & Thy, Reference Dilek and Thy2009; Dilek & Furnes, Reference Dilek and Furnes2009). Although there is a general agreement that Tethyan ophiolites in the Eastern Mediterranean region formed in suprasubduction zone settings (Pearce, Lippard & Roberts, Reference Pearce, Lippard, Roberts, Kokelaar and Howells1984; Parlak, Deloye & Bingöl, Reference Parlak, Delaloye and Bingöl1996; Parlak, Höck & Deloye, Reference Parlak, Höck, Delaloye, Bozkurt, Winchester and Piper2000; Robertson, Reference Robertson2002; Dilek, Furnes & Shallo, Reference Dilek, Furnes and Shallo2007; Dilek & Thy, Reference Dilek and Thy2009; Parlak et al. Reference Parlak, Rizaoğlu, Bağci, Karaoğlan and Höck2009), complex melt evolution in arc–fore-arc suprasubduction zone settings during the closure of the ocean basins has been suggested for the Kızıldağ (Hatay), Tekirova (Antalya), Divriği (Sivas), Troodos (Cyprus), Pindos (Greece), Mirdita (Albania) and Semail (Oman) ophiolites (Flower & Dilek, Reference Flower, Dilek, Dilek and Robinson2003; Parlak, Yılmaz & Boztuğ, Reference Parlak, Yılmaz and Boztuğ2006; Bağcı, Parlak & Höck, Reference Bağci, Parlak and Höck2008; Bağcı & Parlak, Reference Bağci and Parlak2009; Dilek & Furnes, Reference Dilek and Furnes2009, Reference Dilek and Furnes2011; Dilek & Thy, Reference Dilek and Thy2009; Pearce & Robinson, Reference Pearce and Robinson2010).
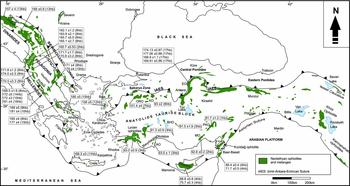
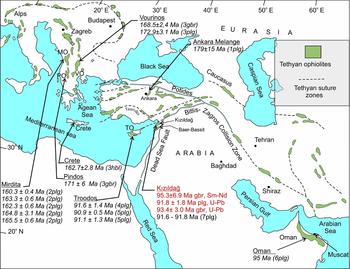
Tethyan ophiolites have been extensively dated by 39Ar–40Ar and K–Ar to determine ages of intraoceanic thrusting/metamorphism events (Lanphere et al. Reference Lanphere, Coleman, Karamata and Pamic1975; Okrusch et al. Reference Okrusch, Seidel, Kreuzer and Harre1978; Roddick, Cameron & Smith, Reference Roddick, Cameron and Smith1979; Spray & Roddick, Reference Spray and Roddick1980; Lanphere, Reference Lanphere1981; Thuizat et al. Reference Thuizat, Whitechurch, Montigny and Juteau1981; Yılmaz & Maxwell, Reference Yılmaz and Maxwell1982; Spray et al. Reference Spray, Be'Bien, Rex, Rodick, Dixon and Robertson1984; Montigny, Le Mer & Whitechurch, Reference Montigny, Le Mer and Whitechurch1988; Gnos & Peters, Reference Gnos and Peters1993; Önen & Hall, Reference Önen and Hall1993; Hacker, Reference Hacker1994; Parlak, Delaloye & Bingöl, Reference Parlak, Delaloye and Bingol1995; Parlak & Delaloye, Reference Parlak and Delaloye1996, Reference Parlak and Delaloye1999; Çelik, Delaloye & Feraud, Reference Çelik, Delaloye and Feraud2006; Chan et al. Reference Chan, Malpas, Xenophontos and Lo2007; Çelik et al. Reference Çelik, Marzoli, Marschik, Chiaradia, Neubauer and Öz2011) (Fig. 1). By contrast, U–Pb oceanic crust crystallization ages on the same units are very limited (Fig. 2). The ages indicate two periods of formation: Late Cretaceous (Turonian–Cenomanian) in Oman to Anatolia and Middle Jurassic (Bathonian–Callovian) in the Balkan region. Early Jurassic plagiogranites of the Ankara melange have been interpreted as the remnants of Palaeotethyan basement that was amalgamated into the İzmir–Ankara–Erzincan ocean during Neotethyan evolution (Dilek & Thy, Reference Dilek and Thy2009).
Geochronological data from the metamorphic sole rocks. 40Ar–39Ar age data are from: (1) Dilek et al. (Reference Dilek, Thy, Hacker and Grundvig1999); (2) Parlak & Delaloye (Reference Parlak and Delaloye1999); (3) Çelik, Delaloye & Feraud (Reference Çelik and Delaloye2006); (4) Chan et al. (Reference Chan, Malpas, Xenophontos and Lo2007); (5) Galoyan et al. (Reference Galoyan, Rolland, Sosson, Corsini, Billo, Verati and Melkonian2009); (6) Önen (Reference Önen2003); (7) Harris, Kelley & Okay (Reference Harris, Kelley and Okay1994); (8) Dimo-Lahitte, Monie & Vergely (Reference Dimo-Lahitte, Monie and Vergely2001); (9) Spray et al. (Reference Spray, Be'Bien, Rex, Rodick, Dixon and Robertson1984); (10) Roddick, Cameron & Smith (Reference Roddick, Cameron and Smith1979); (11) Koepke, Seidel & Kreuzer (Reference Koepke, Seidel and Kreuzer2002), K–Ar age data are from: (12) Hatzipanagiotou & Pe-Piper (Reference Hatzipanagiotou and Pe-Piper1995); (13) Lanphere et al. (Reference Lanphere, Coleman, Karamata and Pamic1975); (14) Thuizat et al. (Reference Thuizat, Whitechurch, Montigny and Juteau1981); (15) Spray & Roddick (Reference Spray and Roddick1980); (16) Roddick, Cameron & Smith (Reference Roddick, Cameron and Smith1979); (17) Çelik et al. (Reference Çelik, Marzoli, Marschik, Chiaradia, Neubauer and Öz2011). Abbreviations: AO – Antalya Ophiolite; BHO – Beyşehir–Hoyran Ophiolite; EO – Eldivan Ophiolite; KO – Kınık Ophiolite; LO – Lesvos Ophiolite; MO – Mersin Ophiolite; ORO – Orhaneli Ophiolite; PKO – Pozantı–Karsantı Ophiolite; SO – Sevan Ophiolite; mu – muscovite; hb – hornblende. Map modified after Stampfli, Reference Stampfli, Bozkurt, Winchester and Piper2000, Dilek & Flower, Reference Dilek, Flower, Dilek and Robinson2003 and Çelik et al. Reference Çelik, Marzoli, Marschik, Chiaradia, Neubauer and Öz2011. Box shows study area (Fig. 3).

U–Pb ages of the Neotethyan ophiolites. (1) Dilek & Thy (Reference Dilek and Thy2006); (2) Dilek, Furnes & Shallo (Reference Dilek, Furnes and Shallo2008); (3) Liati, Gebauer & Fanning (Reference Liati, Gebauer and Fanning2004); (4) Mukassa & Ludden (Reference Mukasa and Ludden1987); (5) Konstantinou, Wirth & Vervoot (Reference Konstantinou, Wirth and Vervoort2007); (6) Tilton, Hopson & Wright (Reference Tilton, Hopson and Wright1981); (7) Dilek & Thy (Reference Dilek and Thy2009). Abbreviations: MO – Miridita Ophiolite; PO – Pindos Ophiolite; VO – Vourinos Ophitolite; TO – Troodos Ophiolite; plg – plagiogranite; gbr – gabbro; rhy – rhyolite. Map modified after Dilek & Flower, Reference Dilek, Flower, Dilek and Robinson2003.

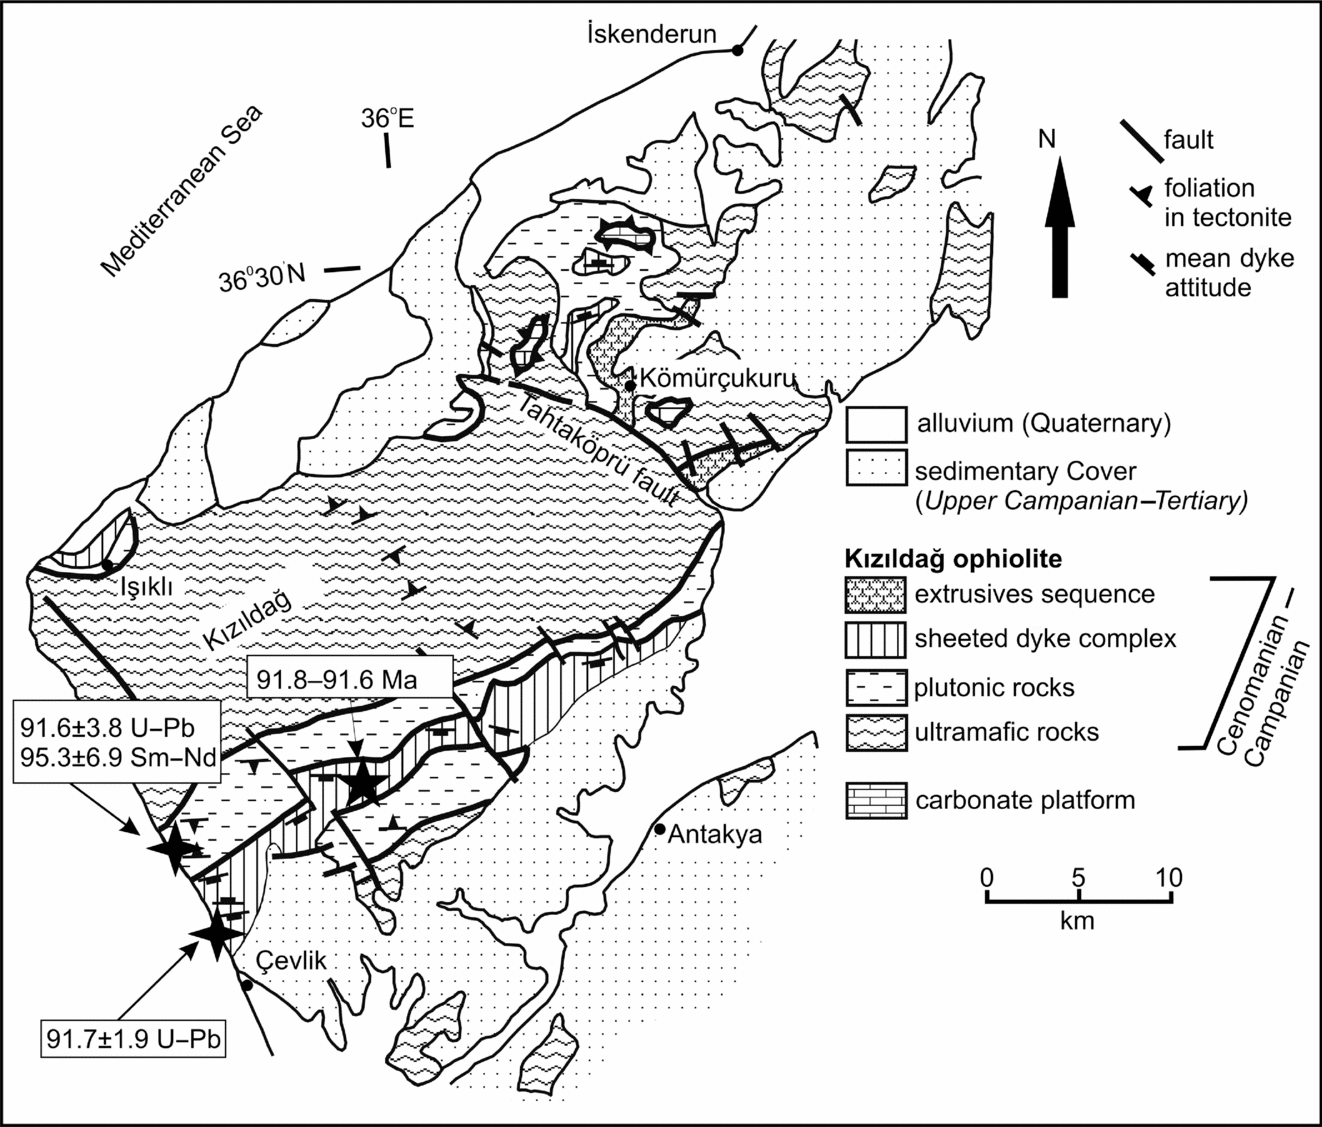
Geological map of the Kızıldağ ophiolite (Hatay, Turkey).
 $\protect\epsfscale600\epsfbox{art/star1.eps}$
shows sample location for the study of Dilek & Thy (Reference Dilek and Thy2009).
 $\protect\epsfscale600\epsfbox{art/star2.eps}$
show sample locations for this study. Map modified after Selçuk, Reference Selçuk1981, Pişkin et al. Reference Pişkin, Delaloye, Selçuk and Wagner1986, Dilek & Delaloye, Reference Dilek and Delaloye1992 and Dilek & Thy, Reference Dilek, Thy, Mills and Harrison1998.

The Kızıldağ ophiolite exposes the best-preserved oceanic lithospheric remnants of the Neotethys in Anatolia. Therefore, it is a suitable body to better understand different stages of magma generation during Late Cretaceous Tethyan evolution. Previous K–Ar age determinations on pillow lavas (74 to 44 Ma), sheeted dykes and gabbros (116 to 71 Ma) of the Kızıldağ ophiolite display age scatters, indicating extensive hydrothermal alteration and metamorphism of crustal rocks (Çoğulu et al. Reference Çoğulu, Delaloye, Vuagnat and Wagner1975; Delaloye, Vuagnat & Wagner, Reference Delaloye, Vuagnat, Wagner, Biju-Duval and Montadert1977; Delaloye et al. Reference Delaloye, de Souza, Wagner, Hedley and Panayiotou1980). Recently laser ablation multicollector inductively coupled plasma mass spectrometry (LA-MC-ICP-MS) methods have been used to date U–Pb in zircons from the Troodos, Ligurian and Kormay ophiolites (Konstantinou, Wirth & Vervoot, Reference Konstantinou, Wirth and Vervoort2007; Grazetti, Tribuzio & Tiepolo, Reference Grazetti, Tribuzio and Tiepolo2009; Pedersen et al. Reference Pedersen, Searle, Carter and Bandopadhyay2010).
In this paper, we present new LA-MC-ICP-MS U–Pb and Sm–Nd age determinations on the Kızıldağ ophiolite to constrain the timing of oceanic crust generation in a slow-spreading ridge segment. We compare our results with the Troodos and the Oman ophiolites that are thought to have been formed along the same oceanic segment during Late Cretaceous time.
2. Geology of the Kızıldağ (Hatay) ophiolite and the surroundings
The Arabian platform is represented by Cambrian to Lower Carboniferous clastic rocks and limestones unconformably overlain by Triassic to Cretaceous platform carbonates (Dubertret, Reference Dubertret1953; Dean & Monod, Reference Dean and Monod1985; Tekeli & Erendil, Reference Tekeli and Erendil1986; Yılmaz, Reference Yılmaz1993; Al-Riyami & Robertson, Reference Al-Riyami and Robertson2002; Ghienne et al. Reference Ghienne, Monod, Kozlu and Dean2010). A thin melange unit is observed as exposures beneath the Kızıldağ ophiolite within tectonic windows near Kömürçukuru (Fig. 3) where the sheared serpentinites include allochthonous limestone blocks. The age of the blocks ranges from Cenomanian to Campanian (Atan, Reference Atan1969; Aslaner, Reference Aslaner1973). The Kızıldağ ophiolite rests tectonically on the top of the melange unit at a contact exposed as a low-angle thrust fault near the village of Kömürçukuru (Tinkler et al. Reference Tinkler, Wagner, Delaloye and Selçuk1981; Robertson, Reference Robertson1986b ; Dilek & Thy, Reference Dilek and Thy2009; Inwood et al. Reference Inwood, Anderson, Morris and Robertson2009a ,Reference Inwood, Morris, Anderson and Robertson b ).
Regional comparisons show that the Kızıldağ ophiolite has similar petrological and geochemical features to the Baer–Bassit and Troodos ophiolites. The Baer–Bassit ophiolite is the leading edge of a vast ophiolite that was emplaced southwards from the southerly Neotethyan ocean in latest Cretaceous (Maastrichtian) time. The Kızıldağ ophiolite to the north represents the undeformed, more northerly part of the same thrust sheet (Robertson, Reference Robertson1986a ,Reference Robertson b ; Al-Riyami & Robertson, Reference Al-Riyami and Robertson2002; Al-Riyami, Robertson & Danelian, Reference Al-Riyami and Robertson2002; Al-Riyami et al. Reference Al-Riyami, Robertson and Danelian2002; Robertson, Reference Robertson2002). There are number of similarities between the two ophiolites. Despite the strongly dismembered nature of the Baer–Bassit ophiolite, it can be reconstructed as a single complete ophiolite sequence from bottom to top, like the Kızıldağ ophiolite (Robertson, Reference Robertson1986 a,b; Al-Riyami et al. Reference Al-Riyami, Robertson and Danelian2002). The plutonic section of the Kızıldağ ophiolite is lithologically similar to that of the Baer–Bassit ophiolite (Bağcı, Parlack & Höck, Reference Bağci, Parlak and Höck2005, Reference Bağci, Parlak and Höck2008; Al-Riyami et al. Reference Al-Riyami, Robertson, Xenophontos, Danelian and Dixon2002). Both ophiolites have well-developed sheeted dyke complexes. The extrusive rocks in both ophiolites are mostly depleted and exhibit the geochemical features of island arc tholeiites (IAT) (Al-Riyami et al. Reference Al-Riyami, Robertson and Danelian2002; Bağcı, Parlack & Höck, Reference Bağci, Parlak and Höck2008). The Kızıldağ ophiolite contains interlava metalliferous sediments (umber), similar to that reported from the Baer–Bassit and Troodos ophiolites (Robertson, Reference Robertson1986a ,Reference Robertson b ; Al-Riyami et al. Reference Al-Riyami, Robertson, Xenophontos, Danelian and Dixon2002).
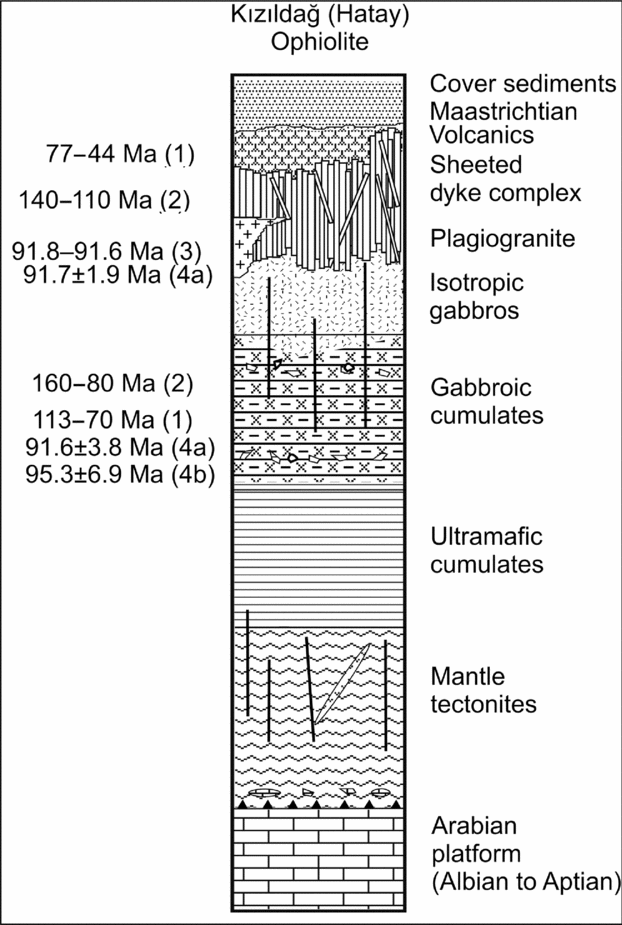
The Kızıldağ ophiolite displays a complete ophiolite assemblage that comprises, from bottom to top, depleted mantle tectonites, ultramafic to mafic cumulates, isotropic gabbro, sheeted dykes, plagiogranites and a volcanic complex (Figs 3, 4). The mantle tectonites constitute the core of the ophiolite and consist primarily of harzburgite with local lenses and bands of dunite. The harzburgitic tectonites exceed 3 km in thickness and are intruded by pegmatitic gabbroic and pyroxenitic dykes (Figs 3, 4) (Tinkler et al. Reference Tinkler, Wagner, Delaloye and Selçuk1981; Tekeli, Whitechurch & Erendil, Reference Tekeli, Whitechurch and Erendil1983; Erendil, Reference Erendil, Tekeli and Göncüoglu1984; Dilek & Thy, Reference Dilek, Thy, Mills and Harrison1998, Reference Dilek and Thy2009). The 165 to 700 m thick cumulate rocks consist of dunite, wehrlite, olivine gabbro, olivine gabbronorite and normal gabbro (Bağcı, Parlack & Höck, Reference Bağci, Parlak and Höck2005). Toward the top of the plutonic section, isotropic gabbros and diorites are abundant, reaching a thickness of 2–2.5 km (Selçuk, Reference Selçuk1981; Tinkler et al. Reference Tinkler, Wagner, Delaloye and Selçuk1981; Pişkin et al. Reference Pişkin, Delaloye, Moritz, Wagner, Malpas, Moores, Panayiotou and Xenophontos1990). At the top, the isotropic gabbros grade into a well-developed sheeted dyke complex containing several 50 to 70 cm wide gabbro screens and lenses (Erendil, Reference Erendil, Tekeli and Göncüoglu1984; Tinkler et al. Reference Tinkler, Wagner, Delaloye and Selçuk1981; Dilek & Thy, Reference Dilek, Thy, Mills and Harrison1998; Inwood et al. Reference Inwood, Anderson, Morris and Robertson2009a ) (Fig. 3). The sheeted dykes start as isolated dykes at the basal contact with the isotropic gabbro, and are dominated by 100% dykes ranging in thickness from a couple of centimetres to 2 m. The best-preserved outcrops are observed in the north of Çevlik along the Mediterranean coastline (Figs 3, 4). Some small outcrops of the sheeted dyke complex are seen in the north of Kömürçukuru and Tahtaköprü (Fig. 3). The sheeted dykes are oriented along a strike of E–W and display well-preserved chilled margins and cross-cutting relationships. Dilek & Thy (Reference Dilek, Thy, Mills and Harrison1998) showed that at least three main generations of dyke intrusions exist in the sheeted dyke complex based on cross-cutting relationships and textural and compositional differences. The plagiogranite has an intrusive relationship with the upper part of the isotropic gabbros in Karaçay valley, dated by Dilek & Thy (Reference Dilek and Thy2009), and the sheeted dyke complex in Çevlik village (Figs 3, 5a), dated in this study. There are two types of volcanic rocks in the Kızıldağ ophiolite. The first one consists of basalts exhibiting IAT affinity and is located near Tahtaköprü and Kömürçukuru villages in the northern part of the massif (Fig. 3) (Tekeli, Whitechurch & Erendil, Reference Tekeli, Whitechurch and Erendil1983; Erendil, Reference Erendil, Tekeli and Göncüoglu1984; Robertson, Reference Robertson1986a ; Dilek & Thy, Reference Dilek, Thy, Mills and Harrison1998, Reference Dilek and Thy2009). The second group consists of hyaloclastites associated with boninitic egg-shaped micro pillow lavas, 4–5 cm to 20 cm long (Laurent et al. Reference Laurent, Delaloye, Vuagnat, Wagner and Panayiotou1980; Robertson, Reference Robertson1986b ) (Fig. 3), called ‘Sakalavite’ by Dubertret (Reference Dubertret1955), and is located 12 km southeast of the main body of the Kızıldağ ophiolite near Mount Silpius.
Isotopic ages on the Kızıldağ ophiolite. (1) K–Ar whole-rock by Çoğulu et al. (Reference Çoğulu, Delaloye, Vuagnat and Wagner1975); (2) K–Ar whole-rock by Delaloye et al. (Reference Delaloye, de Souza, Wagner, Hedley and Panayiotou1980); (3) U–Pb zircon by Dilek & Thy (Reference Dilek and Thy2009); (4a) U–Pb ages (this study); (4b) Sm–Nd age (this study).

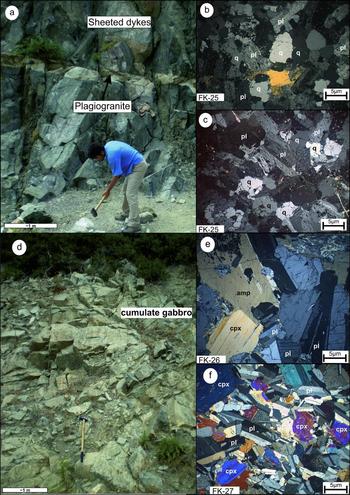
(a) Field view of the plagiogranite intruding the sheeted dykes. (b, c) Microscopic views of the plagiogranites used for U–Pb geochronology. (d) Field view of the cumulate gabbros. (e, f) Microscopic views of the cumulate gabbros used for U–Pb and Sm–Nd geochronology. Abbreviations: q – quartz, cpx – clinopyroxene, pl – plagioclase, amp – amphibole.

The oldest transgressive sequence covering the ophiolitic rocks consists of shallow marine sediments, starting with ophiolite-derived conglomerate and sandstone passing upward into carbonates of Maastrichtian age (Selçuk, Reference Selçuk1981; Boulton, Robertson & Unlugenc, Reference Boulton, Robertson, Unlugenc, Robertson and Mountrakis2006; Boulton & Robertson, Reference Boulton and Robertson2007). This post-emplacement transgressive sequence is conformably overlain by Paleocene–Eocene and Middle to Upper Miocene sediments (Selçuk, Reference Selçuk1981; Boulton & Robertson, Reference Boulton and Robertson2007). The geological features of the Kızıldağ ophiolite suggest that the emplacement age of the Kızıldağ ophiolite is limited to the Late Cretaceous (pre-Maastrichtian).
3. Analytical methods
Two samples from the Kızıldağ ophiolite (one gabbro from the cumulate gabbro and one plagiogranite sample cutting sheeted dykes) were analysed for LA-MC-ICP-MS zircon U–Pb and ID-TIMS Sm–Nd geochonology. The LA-MC-ICP-MS and Sm–Nd analytical work was performed at the Laboratory of Geochronology, Centre for Earth Sciences, University of Vienna. Sample preparation procedure for zircon included crushing, sieving (0–250 mesh size fraction split), wet-sieving, heavy liquid (diiodmethan >3.2 g cm−3), magnetic separation and hand picking under binocular microscope. The handpicked inclusion-free zircon fractions were mounted in epoxy and ground and polished prior to cathodoluminescence (CL) imaging and LA-MC-ICP-MS analyses. CL imaging was performed with a JEOL JSM 6310 scanning electron microscope (SEM) with 15 kV acceleration voltage at the Institute of Earth Sciences, University of Graz.
The CL images of the zircon crystals dated were obtained before LA-MC-ICP-MS dating, to distinguish between different zircon domains, as well as after LA-MC-ICP-MS measurements to confirm the exact location of the spots/line paths. In general, weak CL emission (darker areas in the images) corresponds to high amounts of minor and trace elements; strong CL emission (lighter areas in the images) reflects low amounts of minor and trace elements, including U (e.g. Sommerauer, Reference Sommerauer1974; Corfu et al. Reference Corfu, Hanchar, Hoskin and Kinny2003). Thus, the U-contents can be qualitatively predicted via CL.
Zircon 206Pb–238U and 207Pb–206Pb ages were determined using a 193 nm solid state Nd-YAG laser (NewWave UP193-SS) coupled to a MC-ICP-MS (Nu Instruments HR). Ablation in a He atmosphere was raster-wise according to the CL zonation pattern of the zircons. Line widths for rastering were 35–75 μm with a rastering speed of 5 μm sec−1. Energy densities were 5–8 J cm−2 with a repetition rate of 10 Hz. The He carrier gas was mixed with the Ar carrier gas flow prior to the plasma torch. Ablation duration was 60 to 120 seconds with a 30 second gas and Hg blank count rate measurement preceding ablation. Ablation count rates were corrected accordingly offline. Remaining counts on mass 204 were interpreted as representing 204Pb. Static mass spectrometer analysis was as follows: 238U in a Faraday detector; 207Pb, 206Pb and 204 (Pb+Hg) in ion counter detectors. 208Pb was not analysed. An integration time of 1 second was used for all measurements. The ion counter–Faraday and inter-ion counter gain factors were determined before the analytical session using standard zircon Plesovice (Slama et al. Reference Slama, Kosler, Condon, Crowley, Gerdes, Hanchar, Horstwood, Morris, Nasdala, Norberg, Schaltegger, Schoene, Tubrett and Whitehouse2008). During the analytical session of sample FK-25, mass and elemental bias and mass spectrometer drift of both U/Pb and Pb/Pb ratios were corrected using a multi-step approach: first-order mass bias is corrected using a dried 233U–205Tl–203Tl spike solution, which was aspirated continuously in Ar and mixed with the He carrier gas coming from the laser before entering the plasma. This corrects for bias effects stemming from the mass spectrometer. The strongly time-dependent elemental fractionation coming from the ablation process itself is then corrected for using the ‘intercept method’ of Sylvester & Ghaderi (Reference Sylvester and Ghaderi1997). The calculated 206Pb–238U and 207Pb–206Pb intercept values are corrected for mass discrimination from analyses of standard Plesovice measured during the analytical session using a standard bracketing method. The correction utilizes regression of standard measurements by a quadratic function. During the analytical session of sample FK-26 all mass and elemental bias and mass spectrometer drift of both U/Pb and Pb/Pb ratios, respectively, were corrected using just the standard bracketing method.
Sample preparation for Sm–Nd analysis started with crushing, milling and sieving. The 160–400 μm fraction was used for mineral separation. The magnetic separator was used to concentrate mineral fractions prior to hand picking. From this concentrate, some 200 mg of optically pure mineral fragments were carefully handpicked under a binocular microscope. Before decomposition, the handpicked mineral fractions were repeatedly rinsed, using acetone and deionized water in an ultrasonic bath. Handpicked, pure mineral separates used for Sm–Nd analysis weighed between 120 and 180 mg. Sample digestion was performed in Savillex® beakers using an ultrapure 5:1 mixture of HF and HClO4 for ten days at 110°C on a hot plate. For whole-rock powders, a minimum dissolution time of three weeks was applied to ensure complete leaching of the rare earth elements (REEs) from refractory material such as zircon. After evaporating the acids, repeated treatment of the residue using 5.8 N HCl resulted in clear solutions for all samples. Upon cooling, between 5 and 10% of the sample solution was split off and spiked for Sm and Nd concentration determination by isotope dilution (ID) using a mixed REE tracer (147Sm–150Nd spike). The REE fraction was extracted using AG® 50W-X8 (200–400 mesh, Bio-Rad) resin and 4.0 N HCl. Nd and Sm were separated from the REE fraction using teflon-coated HdEHP, and 0.18 N and 0.4 N HCl, respectively, as elution media. Maximum total procedural blanks for both Sm and Nd were <50 pg. Sm and Nd were run as metals from a Re double filament, using a Finnigan® MAT262 (for ID fractions) and a ThermoFinnigan® Triton TI TIMS (for isotope compositions (IC)). A 143Nd/144Nd ratio of 0.511843 ± 0.000001 (mean value n = 17) was determined for the La Jolla (Nd) international standard during the period of investigation. Within-run mass fractionation for Nd IC was corrected relative to 146Nd/144Nd = 0.7219. Uncertainties on the Nd isotope ratios are quoted as 2σ. For the 147Sm/144Nd ratio, a mean error of ± 1% is estimated, including blank contribution, uncertainties on spike composition and machine drift; regression calculation is based on these uncertainties and the isochron calculations follow Ludwig (Reference Ludwig2003). Age calculations are based on a decay constant of 6.54 × 10⁻¹² a−1 for 147Sm (Lugmair & Marti, Reference Lugmair and Marti1978); age errors are given at the 2σ level. For Nd, a continuous depletion of the upper mantle is assumed throughout geological time using the following depleted mantle model parameters: 147Sm/144Nd = 0.222, 143Nd/144Nd = 0.513114 (Michard et al. Reference Michard, Gurriet, Soudant and Albarède1985).
Major and trace element contents of the plagiogranite and gabbro were measured in Acme Analytical Laboratories Ltd in Canada.
4. Petrology of the Kızıldağ (Hatay) ophiolite
The petrology and geochemistry of the Kızıldağ ophiolite is well described by Çoğulu et al. (Reference Çoğulu, Delaloye, Vuagnat and Wagner1975), Erendil (Reference Erendil, Tekeli and Göncüoglu1984), Dilek & Delaloye (Reference Dilek and Delaloye1992), Dilek & Thy (Reference Dilek, Thy, Mills and Harrison1998, Reference Dilek and Thy2009) and Bağcı, Parlack & Höck (Reference Bağci, Parlak and Höck2005, Reference Bağci, Parlak and Höck2008). Geochemical data suggest that there are two main types of parental basic magmas that form the Kızıldağ ophiolite: IAT and a low-Ti boninitic series. Spatial and temporal relationships indicate that the two different magma types were contemporaneous. This evidence suggests a fore-arc tectonic setting for the Kızıldağ ophiolite in the southern branch of the Neotethys (Dilek & Thy, Reference Dilek, Thy, Mills and Harrison1998; Bağcı, Parlack & Höck, Reference Bağci, Parlak and Höck2008; Reference Bağci and Parlak2009; Dilek & Furnes, Reference Dilek and Furnes2009).
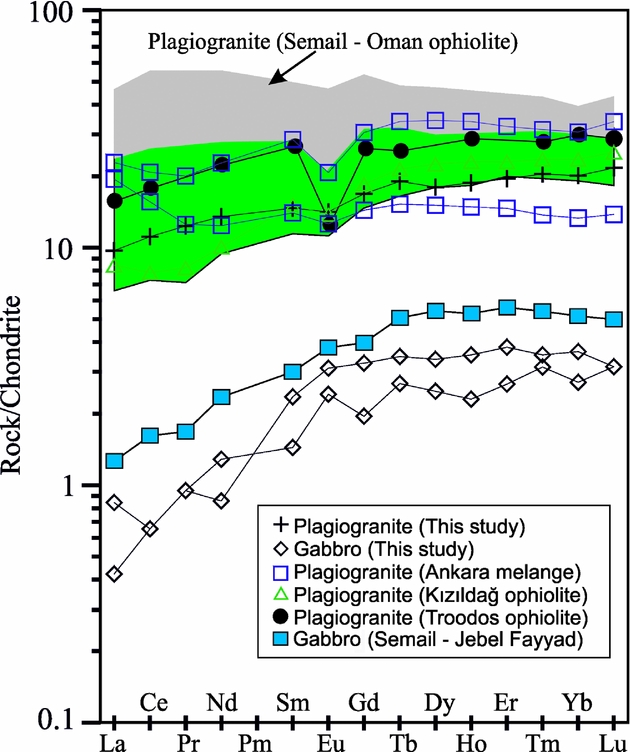
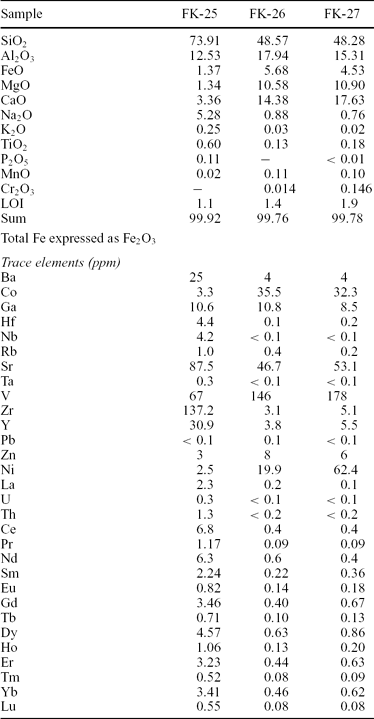
The plagiogranite intrusions in the Kızıldağ ophiolite are observed both in the upper part of the isotropic gabbros and in the sheeted dykes and are characterized by low potassium (0.25 wt% K2O) and high sodium (5.28 wt% Na2O) contents. The low potassium content is one of the most conspicuous features of the plagiogranites (Coleman & Peterman, Reference Coleman and Peterman1975; Pedersen & Malpas, Reference Pedersen and Malpas1984; Jafri, Charan & Govil, Reference Jafri, Charan and Govil1995). They are quartz normative and plot within the trondhjemite field of the An–Ab–Or diagram (Barker, Reference Barker and Barker1979). REE concentrations vary from 9 to 21 times chondritic with low light REE/heavy REE (LREE/HREE) ratios (LaN/YbN = 0.48). They have a small negative Eu anomaly (Fig. 6). The overall REE pattern of the Kızıldağ plagiogranite shows similarities to published data from the Tethyan ophiolites (Pallister & Knight, Reference Pallister and Knight1981; Thy, Brooks & Walsh, Reference Thy, Brooks and Walsh1985; Mukassa & Ludden, Reference Mukasa and Ludden1987; Dilek & Thy, Reference Dilek and Thy2006, Reference Dilek and Thy2009; Rollinson, Reference Rollinson2009; Hanghøj et al. Reference Hanghøj, Kelemen, Hassler and Godard2010) that formed in a suprasubduction zone setting in Late Cretaceous time (Fig. 6). The plagiogranites of the Kızıldağ ophiolite display very similar REE patterns to isotropic gabbros in the same suite (Bağcı, Parlack & Höck, Reference Bağci, Parlak and Höck2008) and also early-formed plagiogranite intrusions of the Oman ophiolite (Rollinson, Reference Rollinson2009) (Fig. 6). The geochemical features of the plagiogranite indicate the derivation of the plagiogranitic melt from the partial melting of hornblende gabbro type rocks in a subduction zone.
REE patterns of the plagiogranites and the gabbros from the studied samples. Plagiogranites from the Ankara mélange (Dilek & Thy, Reference Dilek and Thy2006), Kızıldağ ophiolite (Dilek & Thy, Reference Dilek and Thy2009), Troodos ophiolite (Mukassa & Ludden, Reference Mukasa and Ludden1987) and Semail ophiolite (Pallister & Knight, Reference Pallister and Knight1981; Rollinson, Reference Rollinson2009) and gabbro from the Semail ophiolite (Rollinson, Reference Rollinson2009) are given for comparison.

The plagiogranite (FK-25), from which the analysed zircons were selected, is composed of euhedral plagioclase (45–50%), subhedral to interstitial quartz (~40%) and minor amounts (<10%) of amphibole. Accessories are characterized by zircon, sphene and apatite. It displays fine- to medium-grained hypidiomorphic granular texture. The plagioclase is often altered to saussurite. The amphiboles are altered to chlorite, opaque minerals and rarely epidote at their rims. Anhedral quartz is often associated with plagioclase with a myrmekitic texture (Fig. 5b, c).
The REE patterns of the cumulate gabbros are presented in Figure 6. The REE concentrations are very low and vary from 0.4 to 3.8 times chondritic. They have low LREE/HREE ratios (LaN/YbN = 0.12–0.31) (Fig. 6). The analysed cumulate gabbros have low TiO2 (0.13–0.18 wt%) contents and can be classified as low-Ti ophiolitic gabbros based on the classification of Serri (Reference Serri1981). Abundances of large ion lithophile elements (LILEs) such as Ba (4 ppm), Rb (0.2–0.4 ppm) and other incompatible elements such as Zr (3.1–5.1 ppm), Y (3.8–5.5 ppm) and Nb (< 0.1 ppm) are also low, suggesting their cumulate origin (Table 1).
Major (wt%), trace (ppm) and rare earth element (ppm) analyses of the plagiogranite and gabbro

The medium- to coarse-grained gabbroic rocks (FK-26 and FK-27) comprise plagioclase, clinopyroxene, olivine and amphibole. They exhibit granular and poikilitic textures. The plagioclases form either large euhedral laths or small crystals; the latter is generally poikilitically enveloped by pyroxene and amphibole. The pyroxenes are fresh and have sharp borders. They are subhedral to euhedral in crystal shape and observed as either individual crystals or intergrown with plagioclases. The amphiboles are altered to chlorite and rarely epidote. The olivines are very rare in thin-sections and altered to iddingsite. Accessories are zircons (Fig. 5e, f).
5. U–Pb and Sm–Nd geochronology
5.a. U–Pb data
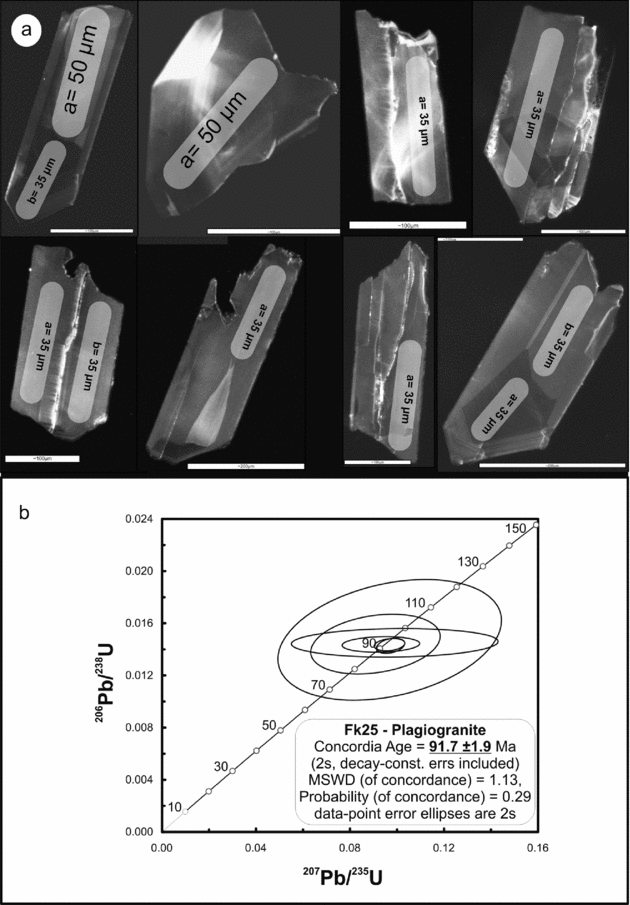
The analysed zircons form 150–400 μm long prismatic, euhedral, colourless transparent crystals. All analysed zircon crystals were broken from one or two edge(s) of the grain. One grain is seen as only a small fragment of the edge of the crystal. The CL images reveal that all zircons consist of only one type of domain with more or less well-developed oscillatory zoning, which implies co-magmatic crystallization of the zircon in the plagiogranite melt (Fig. 7a). Twenty prismatic and/or rounded zircons were dated by LA-MC-ICP-MS. Eight of the zircons yield a concordia age of 91.7 ± 1.9 Ma within the analytical uncertainties (Fig. 7b). The rest of the measurements were not used due to data reduction procedures (i.e. high error, excess Pb, U or Pb loss). The analytical results and standard corrected ratios are given in Table 2.
LA-MC-ICP-MS results of the plagiogranite (FK-25) analysis

(a) The cathodoluminescence images of the zircons and (b) the concordia diagram for the plagiogranite sample (FK-25).

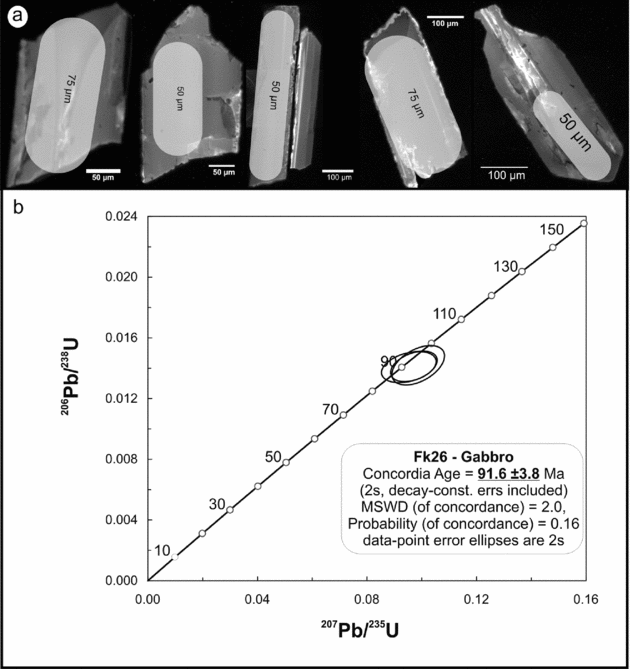
The zircons in the gabbro section of the Kızıldağ ophiolite form 200–400 μm long prismatic, euhedral, brownish, semi-translucent crystals. The CL images reveal that all zircons consist of only one type of domain with badly developed oscillatory zoning (Fig. 8a). The REE distributions within the zircon grains are homogeneous or very roughly zoned. Six zircon grains, which are fragments of elongated crystals, were separated and analysed by LA-MC-ICP-MS. The results and standard corrected ratios are given in Table 3. The results clustered around 90–100 Ma with a shift to a high 207Pb/235U ratio showing Pb loss during crystallization or a subsequent magmatic event. The zircons dated by LA-MC-ICP-MS yielded a concordia age of 91.6 ± 3.8 Ma within the analytical uncertainties (Fig. 8b).
LA-MC-ICP-MS results of the gabbro (FK-26) analysis

(a) The cathodoluminescence images of the zircons and (b) the concordia diagram for the gabbro sample (FK-26).

5.b. Sm–Nd data
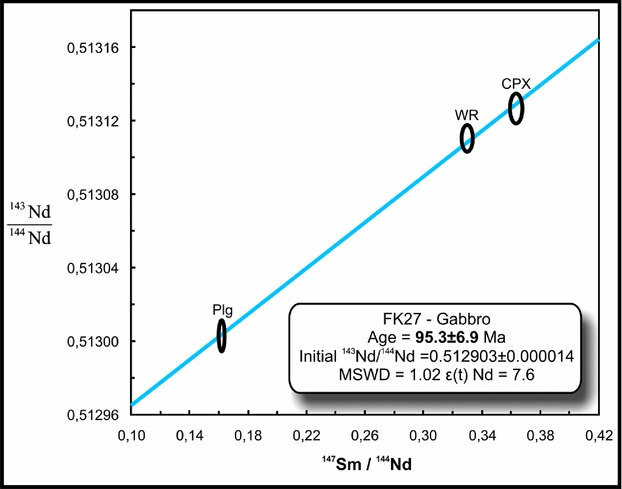
The Sm–Nd analytical data for the whole-rock and two mineral separates of the gabbro sample FK-27 are listed in Table 4 and plotted in a Sm–Nd isochron diagram (Fig. 9). Element concentrations (Table 4) and Sm v. Nd fractionation between the two minerals analysed, with respect to the Sm–Nd system's most relevant major mineral phases, i.e. plagioclase and clinopyroxene, typically follow the trend of LILE depleted mafic rocks from ophiolite complexes (e.g. Jacobsen & Wasserburg, Reference Jacobsen and Wasserburg1979), showing a rather normal relative internal spread between the two components of >50% (147Sm/144Nd is between 0.16 and 0.36). Two-point Sm–Nd isochron regression of the Pl–Cpx pair alone yields an age of 93.7 ± 7.6 Ma (2σ) (εNd = +7.6). Inclusion of the data point for the whole rock results in a best-fit isochron (MSWD = 1.02; n = 3), with t = 95.3 ± 6.9 Ma and an identical initial Nd isotope composition of εNd = +7.6 (Fig. 9).
ID-TIMS results of the gabbro (FK-27) analysis

The Sm–Nd isochron diagram for the gabbro sample (FK-27).

6. Discussion
The southern Neotethyan suture zone comprises a series of evolutionary stages: (a) Mid–Late Triassic rifting to spreading of the southern Neotethys, separated from North Africa (Gutnic et al. Reference Gutnic, Monod, Poisson and Dumont1979; Robertson & Woodcock, Reference Robertson, Woodcock and Panayiotou1980; Şengör, Satir & Akkök,. Reference Şengör, Satir and Akkök1984; Yılmaz, Reference Yİğİtbaş, Genç and Yılmaz1993; Yılmaz, Yiğitbaş & Genç, Reference Yılmaz, Yİğİtbaş and Genç1993); (b) Late Cretaceous northward subduction-accretion of ophiolites and arc-related units (Robertson, Reference Robertson2002; Parlak et al. Reference Parlak, Höck, Kozlu and Delaloye2004, Reference Parlak, Rizaoğlu, Bağci, Karaoğlan and Höck2009; Bağcı, Parlack & Höck, Reference Bağci, Parlak and Höck2005, Reference Bağci, Parlak and Höck2008; Robertson et al. Reference Robertson, Ustaömer, Parlak, Ünlügenç, Tasli and Inan2006, Reference Robertson, Parlak, Rizaoğlu, Ünlügenç, Inan, Tasli, Ustaömer, Ries, Butler and Graham2007; Rızaoğlu et al. Reference Rizaoğlu, Parlak, Höck, Işler, Robertson and Mountrakis2006, Reference Rizaoğlu, Parlak, Höck, Koller, Hames and Billor2009); (c) Mid Eocene subduction-related extension (Yiğitbaş, Genç & Yılmaz, Reference Yılmaz1993; Robertson et al. Reference Robertson, Ustaömer, Parlak, Ünlügenç, Tasli and Inan2006, Reference Robertson, Parlak, Rizaoğlu, Ünlügenç, Inan, Tasli, Ustaömer, Ries, Butler and Graham2007); (d) Early–Middle Miocene collision and southward thrusting over the Arabian Foreland (Robertson et al. Reference Robertson, Ustaömer, Parlak, Ünlügenç, Tasli and Inan2006, Reference Robertson, Parlak, Rizaoğlu, Ünlügenç, Inan, Tasli, Ustaömer, Ries, Butler and Graham2007).
Palaeomagnetic studies show that the Kızıldağ and the Baer–Bassit ophiolites are interpreted as part of the Troodos microplate (Morris et al. Reference Morris, Anderson, Robertson and Al-Riyami2002; Inwood et al. Reference Inwood, Morris, Anderson and Robertson2009b ). Inwood et al. (Reference Inwood, Morris, Anderson and Robertson2009b ) documented that all the rocks of the Kızıldağ ophiolite were rotated anticlockwise by 90°. Its rotation is around 50–60° prior to emplacement in Maastrichtian time and a further 30–40° of anticlockwise rotation during thrusting. In contrast to the Kızıldağ and the Troodos ophiolites, intraoceanic and emplacement-related rotations in the Baer–Bassit ophiolite were extensively modified by variable post-emplacement rotations that have been attributed to initiation and development of a major sinistral strike-slip fault zone, linking the Cyprus subduction zone to the Dead Sea Transform system (Morris et al. Reference Morris, Anderson, Robertson and Al-Riyami2002; Morris & Anderson, Reference Morris and Anderson2002).
Robertson (Reference Robertson2004) discussed several alternatives to explain formation of metamorphic soles such as ridge collapse, steady-state subduction and transform fault initiation. The ridge collapse model within a wide ocean is not applicable to many of the metamorphic soles beneath the Eastern Mediterranean, Oman and Jurassic Eastern Albanian ophiolites because the compositions of the amphibolitic soles are not similar to the compositions of the lavas in the upper part of the overriding ophiolite (Parlak, Delaloye & Bingöl, Reference Parlak, Delaloye and Bingol1995; Searle & Cox, Reference Searle and Cox1999; Çelik & Delaloye, Reference Çelik and Delaloye2003, Reference Çelik and Delaloye2006; Robertson, Reference Robertson2004; Vergili & Parlak, Reference Vergili and Parlak2005; Parlak, Yılmaz & Boztuğ, Reference Parlak, Yılmaz and Boztuğ2006; Çelik, Reference Çelik2007, Reference Çelik2008). The steady-state subduction model requires that the age of peak metamorphism of the metamorphic soles and main magmatism of ophiolite generation should be coeval as in Oman (Gnos & Peters, Reference Gnos and Peters1993; Hacker & Gnos, Reference Hacker and Gnos1997; Searle & Cox, Reference Searle and Cox1999). Warren et al. (Reference Warren, Parrish, Waters and Searle2005) documented new U–Pb zircon ages from both the plagiogranites (95.3 ± 0.2 to 94.4 ± 0.2 Ma) and the metamorphic sole (94.48 ± 0.23 Ma) of the Oman ophiolite. This may suggest that formation of the Oman ophiolite fits well with the steady-state subduction model. The transform fault initiation model is based on the evidence from the Troodos ophiolite. High-temperature metamorphic sole rocks were documented along the oceanic fracture zone from the Troodos ophiolite (i.e. Ayia Varvara metamorphics) (Spray & Roddick, Reference Spray and Roddick1981). This model is not plausible because a substantial tectonic overburden is required to cover pressure–temperature conditions unless a pre-existing transform fault zone later underwent regional tectonic convergence (Clube & Robertson, Reference Clube and Robertson1986; Malpas et al. Reference Malpas, Sporli, Black and Smith1992; Robertson, Reference Robertson2004).
The spatial and temporal relationships of many ophiolites in the Eastern Mediterranean regions are based on the 40Ar–39Ar ages from the metamorphic soles and the U–Pb zircon ages from the plutonic rocks (plagiogranite/gabbro). This suggests that metamorphic soles formed either (i) during intraoceanic thrusting shortly after ophiolite formation (Spray, Reference Spray, Gass, Lippard and Shelton1984; Jones & Robertson, Reference Jones and Robertson1991; Dimo-Lahitte, Monie & Vergely, Reference Dimo-Lahitte, Monie and Vergely2001; Robertson, Reference Robertson2004, Reference Robertson2006; Garfunkel, Reference Garfunkel and Robertson2006), (ii) coeval with ophiolites (Searle & Cox, Reference Searle and Cox1999; Liati, Gebauer & Fanning, Reference Liati, Gebauer and Fanning2004; Warren et al. Reference Warren, Parrish, Waters and Searle2005) or (iii) during the earliest stages of intraoceanic thrusting (Parlak et al. Reference Parlak, Karaoğlan, Rizaoğlu, Klötzli and Koller2012). Wakabayashi & Dilek (Reference Wakabayashi, Dilek, Dilek, Moores, Elthon and Nicolas2000) argued that older metamorphic soles may be the result of a collapse of an oceanic ridge. Later, these soles were tectonically transferred to the base of a separate lithosphere slab that formed above a subduction zone. The age differences were attributed to different cooling histories of the metamorphic soles and oceanic crustal rocks, and also different blocking temperatures of the U–Pb and Ar–Ar systems by several hundreds of degrees (Spray, Reference Spray, Gass, Lippard and Shelton1984; Hacker & Gnos, Reference Hacker and Gnos1997).
The 40Ar–39Ar geochronology on the amphibolites of the metamorphic sole rocks beneath the Tauride belt ophiolites (90.7 ± 0.5 to 93.0 ± 0.9 Ma for the Lycian, 93.0 ± 1.0 to 93.8 ± 1.7 Ma for the Antalya, 90.9 ± 1.3 to 91.5 ± 1.9 Ma for the Beysehir, 91.6 ± 0.3 to 96.0 ± 0.7 Ma for the Mersin, 90.6 ± 0.9 Ma for the Alihoca) and the Semail ophiolite (92.6 ± 0.6 to 94.9 ± 0.5 Ma) indicates a short time span (4–6 Ma) for their formation (Hacker, Reference Hacker1994; Hacker, Mosenfelder & Gnos, Reference Hacker, Mosenfelder and Gnos1997; Parlak & Delaloye, Reference Parlak and Delaloye1999; Dilek et al. Reference Dilek, Thy, Hacker and Grundvig1999; Çelik, Delaloye & Feraud, Reference Çelik, Delaloye and Feraud2006). On the other hand, the metamorphic sole rocks beneath the Baer–Bassit ophiolite and slivers of metamorphic rocks in the Mamonia complex of SW Cyprus yielded ages ranging from 71.7 ± 0.5 to 88.4 ± 0.4 Ma and 75.7 ± 0.3 to 88.9 ± 0.8 Ma, respectively (Chan et al. Reference Chan, Malpas, Xenophontos and Lo2007). They display a much wider time span (15–18 Ma) for their formation (Chan et al. Reference Chan, Malpas, Xenophontos and Lo2007). As the Kızıldağ and Baer–Bassit ophiolites were involved in oceanic transform faulting/rotation of hot young oceanic crust together with the Troodos ophiolite in the southern Neotethys (Morris et al. Reference Morris, Anderson, Robertson and Al-Riyami2002; Inwood et al. Reference Inwood, Morris, Anderson and Robertson2009b ), this could be one of the reasons to explain the longevity of metamorphism associated with these ophiolites.
The U–Pb dating of zircons by the LA-MC-ICP-MS method from the plagiogranite and cumulate gabbros of the Kızıldağ ophiolite yielded ages of 91.7 ± 1.9 Ma and 91.6 ± 3.8 Ma, respectively. Furthermore, the Sm–Nd isochron age from the cumulate gabbros yielded an age of 95.3 ± 6.9 Ma. The internal three-point Sm–Nd isochron age is interpreted to trace the time window of magmatic crystallization, without later disturbance of the isotopic system in question; the related initial Nd isotope ratio of close to +8, on the other hand, is close to depleted mantle composition, yielding evidence for the formation of the gabbroic protolith material from a source with a long-term depletion in LILEs. Although the results of the U–Pb zircon and three-point Sm–Nd ages overlap within the analytical uncertainties, the gabbroic section of the oceanic crust in the Kızıldağ ophiolite may have formed earlier than the plagiogranite that represents the final stages of oceanic crust evolution (Coleman & Donato, Reference Coleman, Donato and Barker1979; Lippard, Shelton & Gass, Reference Lippard, Shelton and Gass1986). This evidence suggests that the oceanic crust of the Kızıldağ ophiolite formed in a fore-arc setting, in a maximum time period of 6 Ma. If we assume that the Kızıldağ and Baer–Bassit ophiolites formed within the suprasubduction zone setting, then the U–Pb zircon ages from the Kızıldağ ophiolite (91.7 ± 1.9 and 91.6 ± 3.8 Ma) and the oldest 40Ar–39Ar age (88.4 ± 0.4 Ma) from the metamorphic sole rocks from the Baer–Bassit ophiolite may be comparable. One could notice that they are indistinguishable within the analytical uncertainties. This indicates the presence of young and hot oceanic lithosphere at the time of intraoceanic subduction/thrusting in the southern Neotethys. The geochemistry of amphibolites from the metamorphic soles of the Baer–Bassit ophiolite indicates that the seamount-type alkali basaltic volcanic rocks and associated sediments from the Arabian passive margin were dominantly metamorphosed during intraoceanic subduction (Al-Riyami et al. Reference Al-Riyami, Robertson, Xenophontos, Danelian and Dixon2002). The nature of the amphibolitic sole rocks rules out oceanic ridge collapse for the intraoceanic decoupling where the metamorphic sole formed.
7. Conclusions
The new U–Pb and Sm–Nd geochronological work carried out for the different rocks of the Kızıldağ ophiolite and the published 40Ar–39Ar ages on the metamorphic sole rocks of the genetically related Baer–Bassit ophiolite may suggest the following conclusions.
(i) The LA-MC-ICP-MS zircon U–Pb dating on the plagiogranite and the cumulate gabbros suggest that the oceanic crust of the Kızıldağ ophiolite formed in a fore-arc setting in a maximum time period of 6 Ma.
(ii) The U–Pb zircon ages from the Kızıldağ ophiolite (91.7 ± 1.9 and 91.6 ± 3.8 Ma) and the 40Ar–39Ar age (88.4 ± 0.4 Ma) from the metamorphic sole rocks from the Baer–Bassit are indistinguishable within the analytical uncertainties. This indicates the presence of young and hot oceanic lithosphere at the time of intraoceanic subduction/thrusting in the southern Neotethys.
(iii) The Sm–Nd isochron age (95.3 ± 6.9 Ma) is interpreted as the magmatic crystallization age. The initial Nd isotope ratio (+8) suggests the formation of the gabbroic rocks from a depleted mantle source.
(iv) The U–Pb zircon ages from the Kızıldağ (Hatay) (91.7 ± 1.9 to 91.6 ± 3.8 Ma), Troodos (Cyprus) (92.4 ± 0.7 to 90.3 ± 0.7 Ma), Baer–Bassit (Syria) and Semail (Oman) (97.3 ± 0.5 to 93.5 ± 0.5 Ma) ophiolites overlap each other within analytical uncertainties, suggesting that these ophiolites are contemporaneous and genetically/tectonically related within the same southern Neotethyan oceanic strand in the Late Cretaceous.
Acknowledgements
This work is a part of Ph.D. study of Fatih Karaoğlan. Financial support from TÜBİTAK (Project no: 106Y231) and Çukurova University Research Foundation (Project no: MMF2009D11) are gratefully acknowledged. We would like to thank Monika Horschinegg for performing the Sm–Nd analyses. The first author acknowledges International Research Fellowship Programme support from TUBITAK–BİDEB. We are grateful to Professor Alastair Robertson and an anonymous reviewer for their invaluable suggestions that improved the quality of the paper. The editorial handling by Dr Phil Leat is greatly acknowledged.