

Introduction
Cats, as obligate carnivores, have evolved to eat meat-only diets containing high levels of protein, moderate levels of fat and negligible levels of carbohydrate (Zoran, Reference Zoran2002; Kirk, Reference Kirk2006; Backus et al., Reference Backus, Cave and Keisler2007). Cats lack salivary amylase which is responsible for initiating carbohydrate digestion in the mouth (Kienzle, Reference Kienzle1993; NRC, 2006), have low levels of intestinal amylase, pancreatic amylase and intestinal disaccharidase activity and have only minimal function of hepatic glycogen synthetase and hepatic glucokinase (Zoran, Reference Zoran2002). Furthermore, the activity of hepatic glucokinase is not adaptive when diets varying in carbohydrate content are fed (Rogers and Morris, Reference Rogers and Morris1982; Zoran, Reference Zoran2002).
Cats are therefore adapted metabolically to utilise higher protein and lower carbohydrate diets. On such diets, cats utilise dietary protein to provide sufficient glucose to maintain blood glucose concentrations and to fuel glucose dependent tissues (Rogers and Morris, Reference Rogers and Morris1982; Hoenig, Reference Hoenig2002; Zoran, Reference Zoran2002). Despite the lack of carbohydrates in their natural hyper-carnivorous diet (e.g. a rat carcass only contains approximately 2% calories from carbohydrate; Rand and Marshall, Reference Rand and Marshall2005), current commercial cat diets typically contain large quantities of carbohydrates (often supplying more than 50% of total calories), due in part to the low cost of this macronutrient compared to meat protein (Zoran, Reference Zoran2002; Appleton et al., Reference Appleton, Rand, Priest, Sunvold and Vickers2004; Rand and Marshall, Reference Rand and Marshall2005).
Compared to other species, cats are believed to be insulin resistant due to slow rates of glucose disposal in food-deprived individuals (Mattheeuws et al., Reference Mattheeuws, Rottiers, Kaneko and Vermeulen1984; Nelson et al., Reference Nelson, Himsel, Feldman and And Bottoms1990). Long-term feeding of ‘unnaturally’ high carbohydrate commercial diets coupled with this insulin resistance could lead to weight gain, higher post-prandial glucose responses, hyperglycaemia, pancreatic β-cell overload, dampened insulin sensitivity and potentially diabetes mellitus in cats (Appleton et al., Reference Appleton, Rand, Priest, Sunvold and Vickers2004; Thiess et al., Reference Thiess, Becskei, Tomsa, Lutz and Wanner2004; Backus et al., Reference Backus, Cave, Ganjam, Turner and Biourge2010).
In lean healthy cats, there does not appear to be any evidence that high carbohydrate diets damage or overload the pancreatic β-cells, or impair insulin sensitivity (Backus et al., Reference Backus, Cave, Ganjam, Turner and Biourge2010). However, in humans (Karam et al., Reference Karam, Grodsky and Forsham1963; Genuth, Reference Genuth1973), dogs (Mattheeuws et al., Reference Mattheeuws, Rottiers, Kaneko and Vermeulen1984; Wolfsheimer et al., Reference Wolfsheimer, Kombert and And Jeansonne1993) and also cats (Nelson et al., Reference Nelson, Himsel, Feldman and And Bottoms1990; Appleton et al., Reference Appleton, Rand and Sunvold2001b), a relationship between obesity and impaired glucose tolerance has been documented. In humans, obesity has been shown to increase insulin resistance seen with non-insulin dependent diabetes mellitus (or Type 2 diabetes), and therefore weight loss has been shown to improve insulin sensitivity and glycaemic control (Beck-Nielsen et al., Reference Beck-Nielsen, Pedersen and And Lindskov1979; Campbell and Carlson, Reference Campbell and Carlson1993). In obese, non-diabetic humans (Kalkhoff et al., Reference Kalkhoff, Kim, Cerletty and And Ferrou1971; Olefsky et al., Reference Olefsky, Reaven and Farquhar1974) and dogs (Wolfsheimer et al., Reference Wolfsheimer, Kombert and And Jeansonne1993), a similar improvement in glucose tolerance has been reported following weight loss. The pathogenesis of diabetes mellitus in cats appears to most closely resemble type 2 diabetes mellitus in humans (Johnson et al., Reference Johnson, O'Brien, Betsholtz and Westermark1989; Henson and O'Brien, Reference Henson and O'Brien2006), and therefore there may be a relationship between obesity and impaired glucose tolerance and the development of diabetes in cats (Nelson et al., Reference Nelson, Himsel, Feldman and And Bottoms1990; Kirk et al., Reference Kirk, Feldman and Nelson1993).
Currently, obesity is the most common nutritional disease of domestic cats. A recent study reported that 39% of cats surveyed in Glasgow, Scotland were overweight or obese (Courcier et al., Reference Courcier, O'Higgins, Mellor and Yam2010). Obesity can be defined as an accumulation of excessive amounts of adipose tissue in the body, and cats more than 15% overweight are considered obese (German, Reference German2006; Colliard et al., Reference Colliard, Paragon, Lemuet, Benet and Blanchard2009). Obesity is a major risk factor for the development of other diseases which include feline diabetes mellitus (Butterwick, Reference Butterwick2000; Hoenig et al., Reference Hoenig, Thomaseth, Waldron and Ferguson2007; Vester et al., Reference Vester, Sutter, Keel, Graves and Swanson2009). A retrospective study conducted using veterinary medical databases in the United States, determined that cases of diabetes mellitus in cats have increased from 8 cases per 10,000 cats in 1970 to 124 cases per 10,000 cats in 1999 (Prahl et al., Reference Prahl, Guptill, Glickman, Tetrick and Glickman2007). However, numerous factors contribute to the development of obesity and diabetes mellitus in the cat, including sex, age, level of activity, diet composition and feeding regimen (Kirk, Reference Kirk2006; Laflamme, Reference Laflamme2006).
The role that the diet plays in obesity and diabetes mellitus in cats is of particular interest, since it is a variable that can be easily controlled and manipulated by the owner. Dietary recommendations for the management of obesity and diabetes mellitus in cats have been extrapolated from human and dog data and comprise the feeding of high fibre, low fat diets to decrease pre- and post-prandial serum glucose concentrations and the limiting of calorific intake (Nelson et al., Reference Nelson, Scott-Moncrief, Feldman, DeVries-Concannon, Kass, Davenport, Kiernan and Neal2000; Biourge, Reference Biourge2005; Bennett et al., Reference Bennett, Greco, Peterson, Kirk, Mathes and Fettman2006). Recently this approach has been re-evaluated for cats, and studies have demonstrated that the quantities of protein, fat, carbohydrate and fibre in the diet can each have an individual effect on post-prandial blood glucose concentrations (Anderson et al., Reference Anderson, Frank, Pazak, Ballan and Laflamme2000; Mazzaferro et al., Reference Mazzaferro, Greco, Turner and Fettman2003; Mori et al., Reference Mori, Sako, Lee, Nishimaki, Fukuta, Mizutani, Honjo and Arai2009).
In humans, the smaller the increase in glucose and insulin concentrations following a meal, the higher the perception of satiety (Holt et al., Reference Holt, Brand, Soveny and Hansky1992), and the lower the chance of overeating. Conversely, foods that produce relatively high glucose and insulin responses following their ingestion can lead to increased hunger, promote overeating and result in weight gain (Holt et al., Reference Holt, Brand, Soveny and Hansky1992; Appleton et al., Reference Appleton, Rand, Priest, Sunvold and Vickers2004). If weight gain continues and is large enough, obesity occurs and this is a significant risk factor for the development of diabetes mellitus (Porte, Reference Porte1991; Appleton et al., Reference Appleton, Rand and Sunvold2001b). In cats it has been hypothesised that similar effects occur, and therefore the ingestion of commercial high carbohydrate diets may promote obesity, increase the demand on β-cells for insulin secretion and ultimately predisposes the cat to hyperinsulinaemia, β-cell failure and the development of diabetes mellitus (Porte, Reference Porte1991). Recent research suggests that low carbohydrate high protein diets (which are also more closely aligned with the composition of the cat's natural diet), may be more beneficial for the health of diabetic and overweight cats by promoting better glycaemic control, a decreased demand for insulin secretion from the pancreas, improved maintenance of lean body mass during weight loss and increased satiety (Kirk, Reference Kirk2006; Laflamme, Reference Laflamme2006; Hoenig et al., Reference Hoenig, Thomaseth, Waldron and Ferguson2007). Therefore it may be possible to formulate cat foods to minimise post-prandial glucose and insulin responses, which may in turn aid in the prevention and management of health issues such as obesity and diabetes mellitus (Rand et al., Reference Rand, Fleeman, Farrow, Appleton and Lederer2004), as well as offering the cat a more physiologically appropriate diet. A better understanding of the impacts of dietary macronutrient components on blood glucose and feline metabolism may lead to a better synergy of dietary components targeted to prevent or manage obesity and diabetes mellitus.
The purpose of this study was to compare the effects of feeding diets with different macronutrient proportions at maintenance levels on the metabolism of adult cats. It was hypothesised that cats fed a high protein diet (HP) would show better glycaemic control, smaller fluctuations in post-prandial blood glucose concentrations and more stable bodyweights compared to those cats fed a high carbohydrate diet (HC).
Materials and Methods
Animals and Diets
Sixteen (n = 6 entire females, n = 10 neutered males), healthy adult domestic short-haired cats (Felis catus), aged from 1 to 9 (mean 4.56, SEM 2.79) years, and weighing between 3.21 and 5.74 kg (mean 4.54, SEM 0.20), were used in a three-week study.
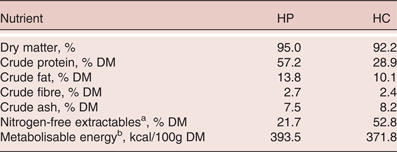
The cats were housed in two purpose-built colony cages at the Centre for Feline Nutrition, Massey University, Palmerston North, New Zealand in two groups of eight animals (n = 3 females and n= 5 males). The two groups of cats were randomly assigned to either a high protein (HP) or a high carbohydrate diet (HC). The HP diet comprised a low carbohydrate, high protein (as compared to the other diet) dry extruded test diet manufactured specifically for the study, and the HC diet comprised a standard commercial high carbohydrate, low protein, dry extruded diet (see Table 1). All management and study procedures were approved by the Massey University Animal Ethics Committee, Palmerston North, New Zealand (MUEAC Protocol Number 07/60).
Dry matter (DM) content and composition of the high protein, low carbohydrate (HP) and high carbohydrate, low protein (HC) diets used in the study (% DM basis).

a Calculated by difference (100 - crude protein - crude fat - crude fibre - crude ash).
b Determined using modified Atwater factors of crude protein = 3.5, crude fat = 8.5, NFE = 3.5 kcal ME/g DM (AAFCO, 2009).
Study Design
The cats were weighed at the beginning of the trial (d0) and at weekly intervals until the end of the trial (d21) to monitor their health and body condition. During the first seven days, the cats were gradually introduced and adapted to the assigned diets. The daily food allowance (adult maintenance energy requirement; MER) for each cat was determined using the equation: MER = 100 kcal x kg BW0.67 (NRC, 2006). These individual allowances (n = 8) were then pooled to calculate the total daily food allowance for each colony cage, and adjusted weekly based on the bodyweight of the cats. As cats were accustomed to being fed as a group it was believed that all cats would consume their allocated amounts of food each day. Fresh diet was weighed out (Mettler Toledo PM11-N, Mettler Toledo Incorporated, Columbus, USA), and offered daily and any refusals recorded. The cats were allowed free access to water throughout the study.
During the digestibility study (d7-d19), the cats were housed individually in metabolic cages (Hendriks et al., Reference Hendriks, Wamberg and Tartellin1999), and were fed their assigned diet to MER (NRC, 2006). Any food refusals were recorded to determine daily food intakes. During this period the cats were weighed weekly as above (i.e. d7 and d14). The diets were fed for 12 days, with the first seven days serving as an adaptation period to the metabolic cages, and the final five days for the total collection of faeces.
The total collection of faeces was carried out using litter trays which separated the urine and faeces (Hendriks et al., Reference Hendriks, Wamberg and Tartellin1999). The faeces were collected daily, weighed and frozen at -20°C, before being freeze-dried (FD18 freeze dryer, Cuddon Engineering, Christchurch, New Zealand), reweighed and ground through a 0.5mm screen using an ultra-centrifugal mill (Retsch ZM100, F.Kurt Retsch GmbH & Co., Haan, Germany). The faecal samples were analysed for dry matter, crude protein, crude fat, crude ash and gross energy as described below.
On days 20 and 21, post-prandial changes in glucose concentrations were determined. Sixteen hours after the last meal, a baseline blood sample was obtained from each cat and analysed for blood glucose concentration. One hour later, the cats were offered a single meal (25% daily MER), and allowed 10 min to consume it, after which any refusals were recorded.
Additional blood samples were collected 30, 60, 90, 120, 180, 240, 300, 360 and 420 min after the consumption of the meal. Blood samples were collected using the marginal ear vein prick technique (Casella et al., Reference Casella, Wess and Reusch2002), where the pinna was warmed, petroleum jelly was smeared over the puncture site and a needle lancet used to pierce the skin and produce a small drop of blood which was collected. Pressure was then applied to prevent further bleeding. Samples were taken alternately from the left and right pinnae during the sampling sequence to minimise vein damage. At the completion of blood sampling, the cat was offered the remaining 75% daily MER allowance.
The blood samples were applied to a hand-held glucometer (Accuchek, Roche Diagnostics, Auckland, New Zealand) to determine glucose concentration (mmol/l). Glucometer readings have been previously determined to consistently underestimate true values. To calculate the correction factor, serial dilutions of a blood sample were spiked with glucose to create a standard curve, which was then compared to the same samples, submitted for glucose determinations to the New Zealand Veterinary Pathology laboratory (Palmerston North, New Zealand). This determined that the concentrations determined by the glucometer needed to be multiplied by a correction factor of 1.3 (Cave, N.J., personal communication).
Chemical Analyses
All chemical analyses were conducted in duplicate. The dry matter content of the diet and faecal samples were determined by oven drying at 105°C; and crude ash, determined by burning the samples at 550°C for 16 h. Nitrogen was determined by the Dumas method (LECO FP-2000 CNS Carbon, Nitrogen, and Sulphur analyser; St Joseph, MI, USA) with crude protein content calculated by applying a conversion factor of 6.25. Crude fat was determined using an acid hydrolysis/Mojonnier extraction (AOAC, 1995), and gross energy (GE; kcal/g) was determined using bomb calorimetry. Crude fibre was determined using the gravimetric method (AOAC, 1995), and nitrogen-free extractables by difference (Table 1).
Calculation and Statistical Analysis
Apparent faecal digestibility values (%) were calculated as:
 $$\eqalign{&\lpar \lpar \hbox{nutrient intake} \lpar \hbox{g/d}\rpar - \hbox{faecal nutrient output} \lpar \hbox{g/d}\rpar \rpar /\cr &\qquad \hbox{\quad nutrient intake} \lpar \hbox{g/d}\rpar \rpar^{\ast} 100}$$
Statistical analyses were conducted using SAS v9.1 (SAS Institute Inc, Cary, NC., USA). All results are presented as mean ± SEM and the level of significance was set at p < 0.05. The apparent digestibility of each nutrient of the two diets was compared statistically using one-way ANOVA. Comparisons were included in the model to analyse differences between male and female cats within and between dietary groups.
Due to differences in baseline glucose concentrations for the cats fed the two diets, the data are also presented as changes from baseline concentrations for each diet so that the differences between the dietary treatments can be better interpreted. The mean corrected concentrations of blood glucose were calculated at each time-point for the two dietary groups. Post-prandial responses were compared for maximum increase (Cmax), time to peak increase (Tmax), and incremental area under the glucose curves (AUC) for both diets, and gender of cats. The AUC were calculated using the trapezoidal method, for the 420 minute period after the meal, using the Microsoft Excel-based program PK functions (Usansky JI, Desai A, Tang-Liu D, Department of Pharmacokinetics and Drug Metabolism, Allergan, Irvine, CA, USA). These parameters were then analysed using ANOVA to determine any significant differences between and within the diets and/or sex, and between baseline and maximum values for each variable. Differences between diets at each of the time-points for concentration of glucose were analysed using repeat measures ANOVA to determine any differences between the diets at any of the time-points.
Results
The mean bodyweights of the cats fed the HP and HC diets at the start of the study were 4.44 kg and 4.64 kg, respectively. The cats fed the HC diet gained weight over the study (mean final body weight, 4.71 kg) and the cats fed the HP diet lost weight over the study (mean final bodyweight, 4.41 kg). The initial bodyweight differences between the two groups were not significant; however, within each dietary group, a time effect on bodyweight was evident (p < 0.05). The changes in bodyweight measured from baseline values for each diet were significantly (p < 0.01) different between the two diets and also between the female and male cats (p < 0.01).
The daily caloric intake (ME) of the cats fed the HP and HC diets were 52.2 (±1.3) and 55.3 (±2.0) kcal/kg BW respectively. These mean caloric intakes (ME) were not significantly (p > 0.05) different between the two diets and sexes fed either of the diets.
Two of the eight cats receiving the HC diet exhibited soft faeces and intermittent diarrhoea, making it impossible to complete an accurate total collection and therefore no apparent digestibility results were determined for these two animals. No such problems were observed with the eight cats fed the HP diet. No further investigation was carried out into the cause of the diarrhoea as it subsided once the cats were taken off the diet.
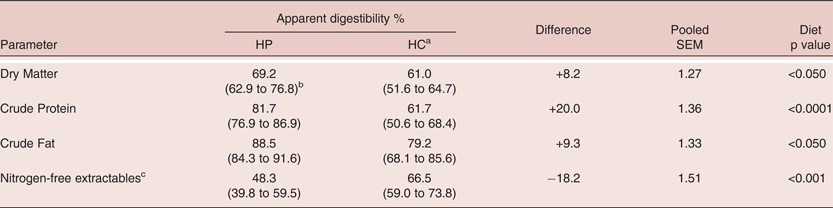
The mean daily faecal output from cats fed the HP diet was significantly (p < 0.01) lower than that from the cats fed the HC diet (35.8g versus 56.6g, respectively). There was no effect (p > 0.05) of sex on faecal output for either of the diets. The apparent nutrient digestibility of the two diets are summarised in Table 2. The apparent digestibility values for dry matter, crude protein, fat and energy of the HP diet were higher (p < 0.05) than the HC diet. However, the apparent digestibility of nitrogen-free extractables (carbohydrates) was lower (p < 0.001) in the HP diet compared to the HC diet. No significant (p > 0.05) diet x sex interactions were observed for any of the digestibility parameters.
Mean (and range) of apparent total tract nutrient digestibility for macronutrients in high protein, low carbohydrate (HP) and high carbohydrate, low protein (HC) diets fed to domestic cats (n = 8 for HP and n = 6 for HC).
a Two cats receiving HC diet exhibited soft faeces/intermittent diarrhoea making it impossible to carry out a total collection. Therefore no apparent digestibility results were determined for these two animals
b Values in parentheses refer to range of apparent digestibility values.
c Calculated by difference
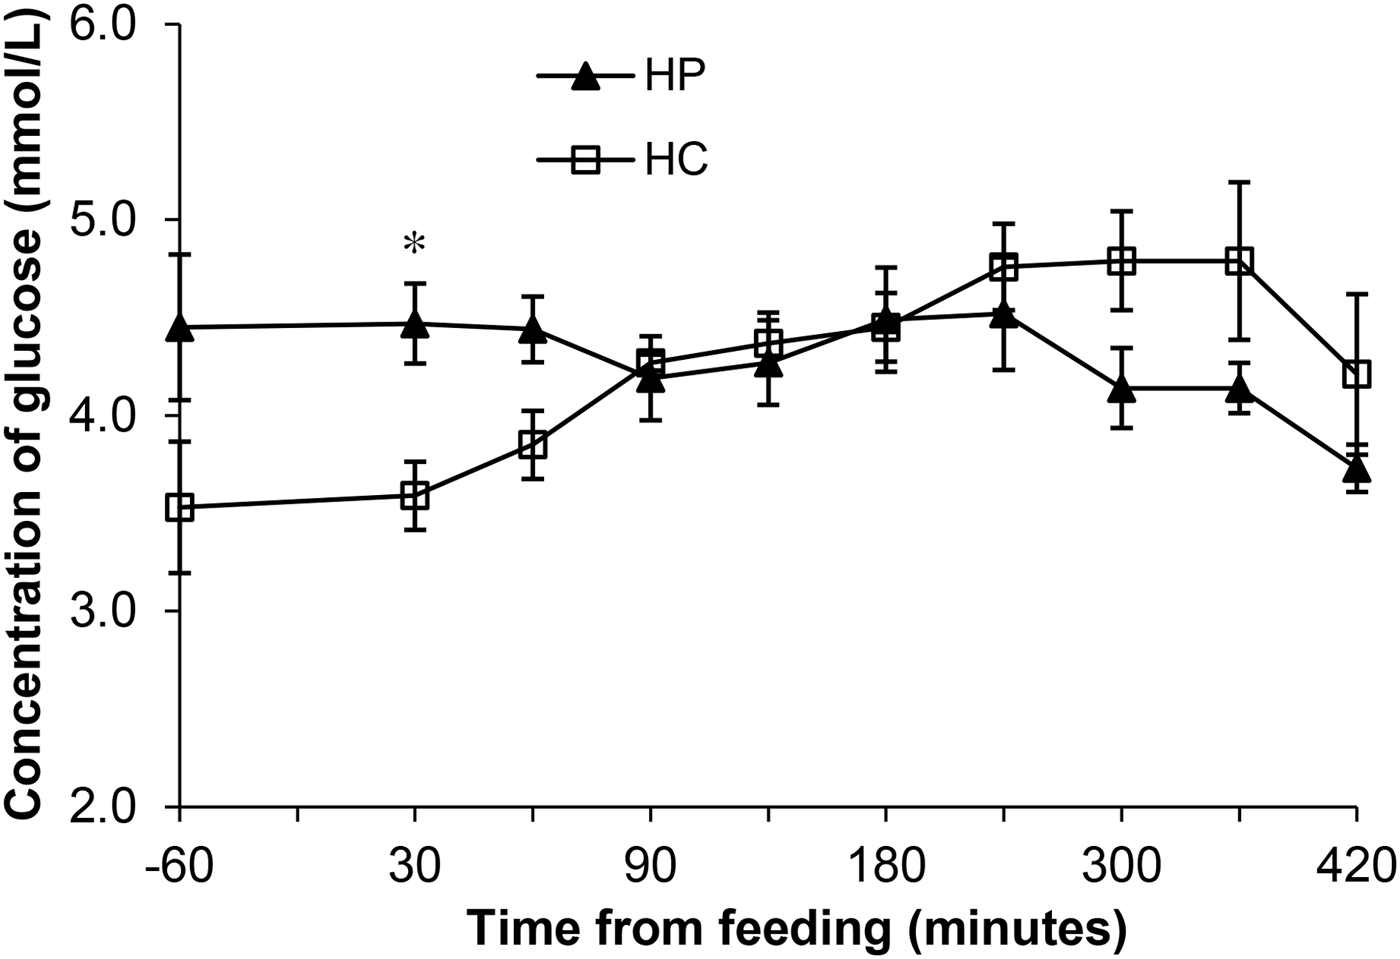
The post-prandial changes in plasma glucose concentrations in response to consumption of a single meal of the two diets are shown in Figure 1. The blood glucose levels in the cats on the different diets were different at baseline and 30 min after consumption of the meal (p < 0.05), making it difficult to ascertain differences in post-prandial glucose responses between the diets.
Mean (± SEM) concentration of glucose determined from serial blood samples collected from cats before and after a single meal of either a high protein, low carbohydrate diet (HP) or high carbohydrate, low protein diet (HC) diet (*p < 0.05 between the two diets).
The AUC, Cmax and Tmax did not differ between the two diets and no age or gender effects were seen. The peak blood glucose concentration (mmol/l), time to peak concentration (min) and area under the curve ((mmol/l)/min) were greater for the HC diet compared to the HP diet (5.35 vs 4.97, 303.75 vs 292.5 and 1862 vs 1585, respectively).
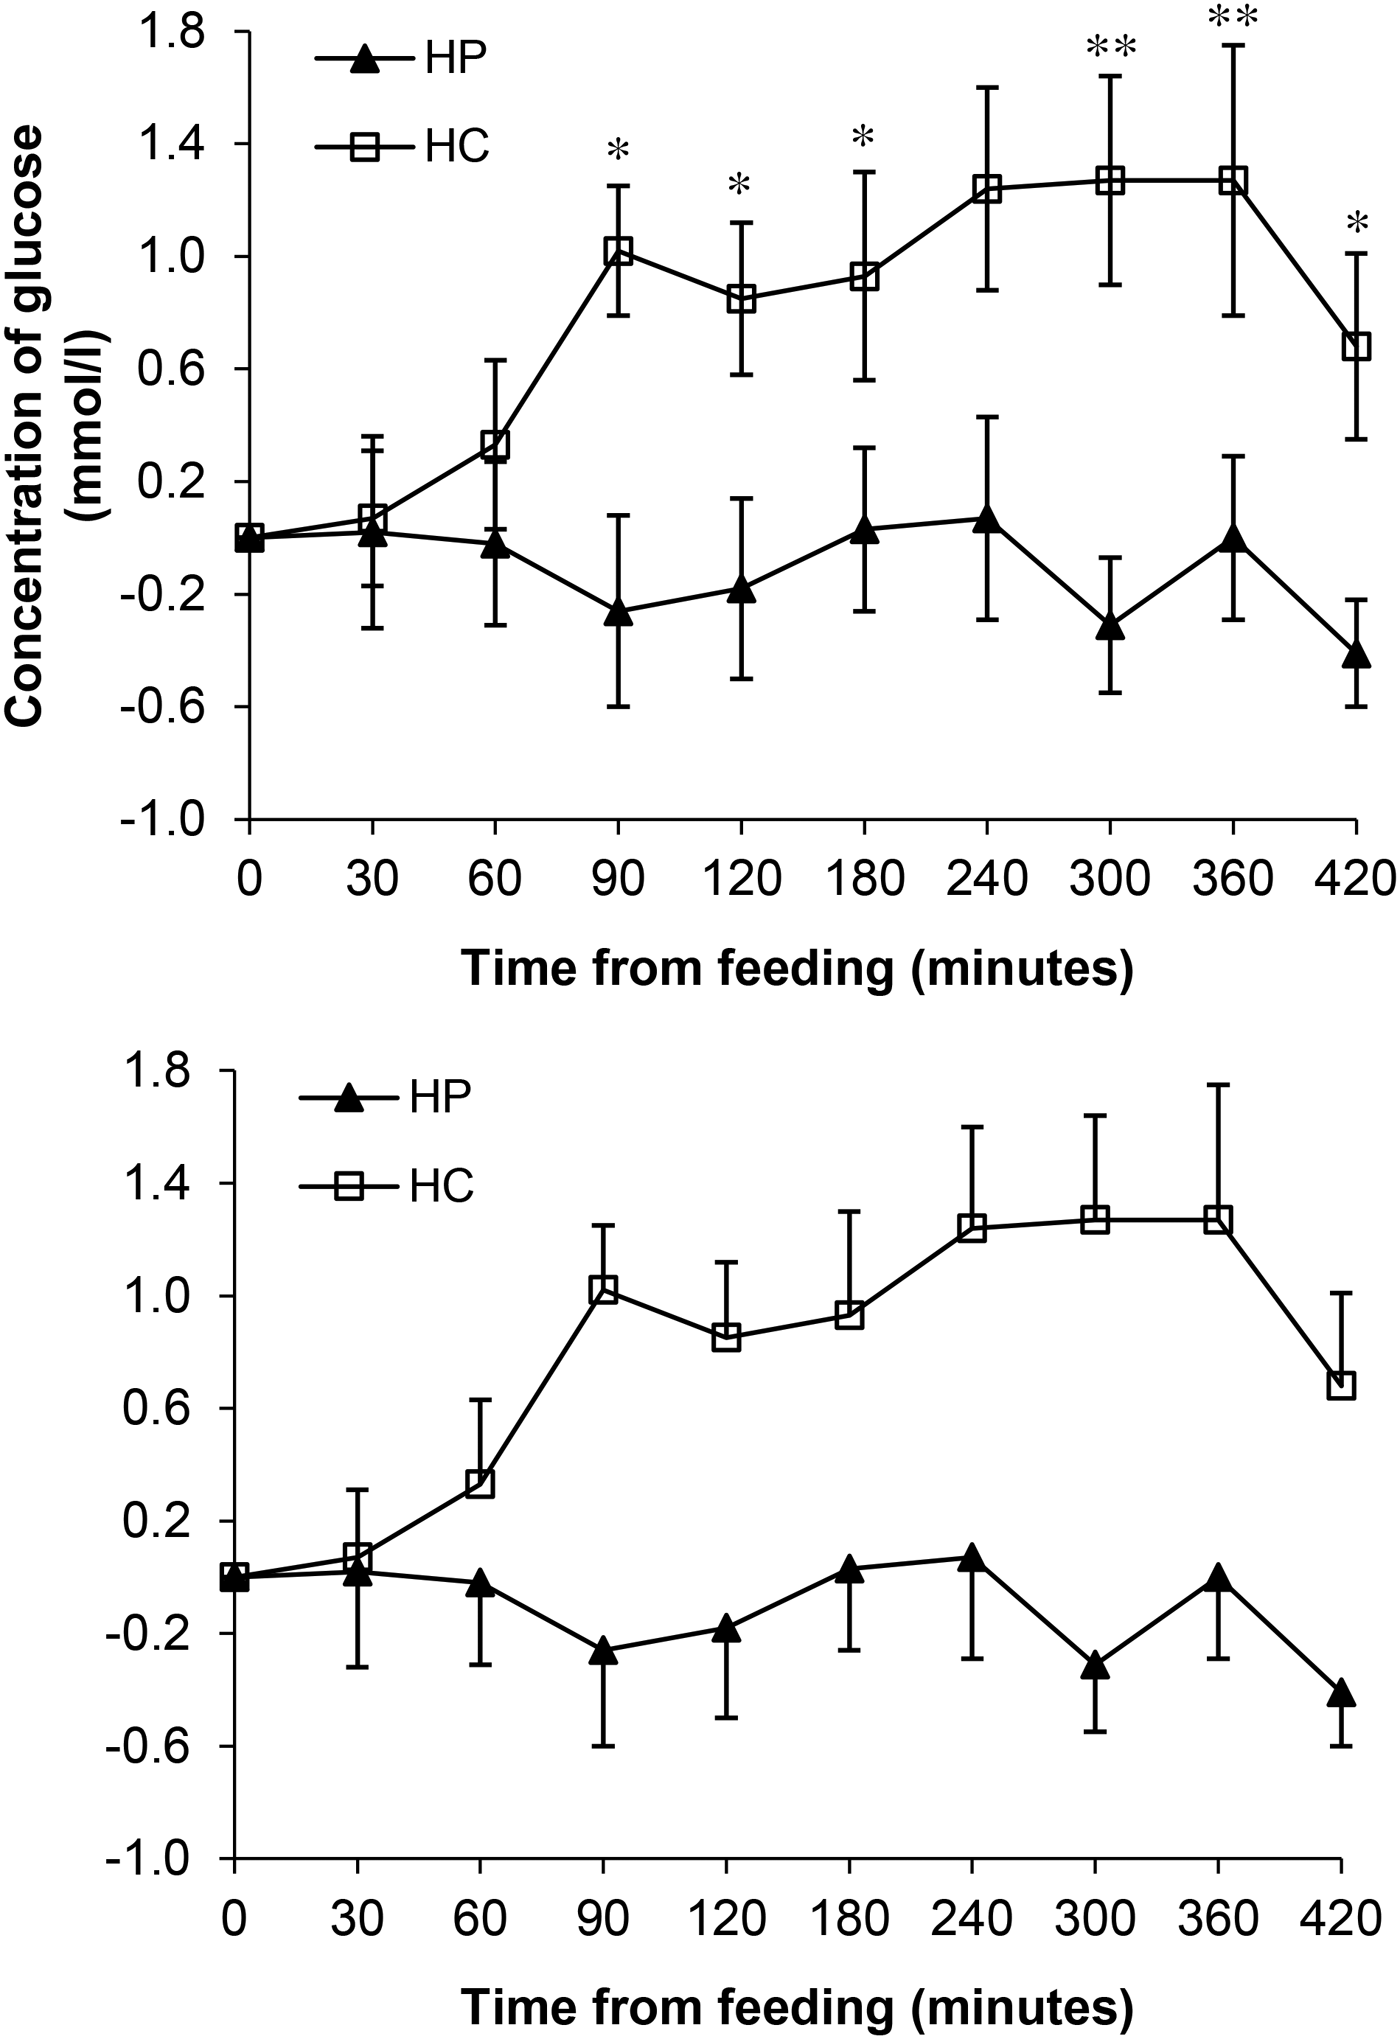
The changes in blood glucose concentration from baseline values for cats fed HC diet and HP diets are shown in Figure 2. The increases were significant (p < 0.05) from baseline at 90 min after feeding the HC diet, and continued to increase further (p < 0.01) between 240 and 360 min after the meal. In contrast, no significant changes (p > 0.05) from baseline were seen for the cats fed the HP diet. No effects (p > 0.05) of age or gender were observed.
Change in mean (± SEM) glucose concentration from baseline in cats following the consumption of a single meal of either a high protein, low carbohydrate diet (HP) or high carbohydrate, low protein diet (HC) diet (*p < 0.05; **p < 0.01 between the two diets).
Discussion
Cats are strict carnivores adapted to high protein, low carbohydrate diets (Rand and Marshall, Reference Rand and Marshall2005; Backus et al., Reference Backus, Cave and Keisler2007), rather than to the common high carbohydrate commercial diets currently available. It is therefore relevant to determine the effects of feeding diets that vary in macronutrient profile in cats. As hypothesised, in the present study, feeding a high protein, low carbohydrate dry diet (HP) resulted in higher apparent digestibility of dry matter, energy, crude protein and crude fat, smaller fluctuations in blood glucose concentrations and therefore a slower, steadier post-prandial release of glucose into the bloodstream than a commercial high carbohydrate, low protein diet (HC).
The higher apparent digestibility of the HP diet for all nutrients except carbohydrates indicated that cats appeared to have absorbed a greater concentration of nutrients from this diet, although nutrient absorption was not measured in this study. These differences in digestibility may be due to the quality and therefore digestibility of the ingredients, particularly the protein and carbohydrate sources used in the diet formulations. A study by de-Oliveira et al. (Reference de-Oliveira, Carciofi, Oliveira, Vasconcellos, Bazolli, Pereira and Prada2008) reported that the digestibility of a diet containing brewer's rice was higher than that of diets containing cassava flour, corn, peas, sorghum or lentils as the starch source. It must be noted that the total collection method does not preclude the effect of hindgut microbiota acting on the macronutrients remaining post-ileum.
Although the mean bodyweights for each dietary group were not different at the start of the study, cats fed the HC diet gained weight and those fed the HP diet lost weight over the study. The changes in bodyweight calculated from the baseline for each diet were significantly different between the two diets and, as expected, between the male and female cats. This finding is important as diets causing weight gain may subsequently lead to obesity if fed long term and obesity is a significant risk factor for the development of diabetes mellitus.
The marginal ear vein prick technique was chosen to determine post-prandial glycaemic responses in the current work because of its speed, reduced invasiveness and the minimal stress to the animal. The alternative method of fitting cats with IV catheters to take repeated blood samples is a costly and invasive procedure. It was hoped by using the marginal ear vein prick technique, we could evaluate its effectiveness for use in future studies with cats and other animals. This technique proved to be effective for determining blood glucose concentrations, causing minimal stress, providing repeat samples quickly and effectively and therefore offering a viable alternative to catheterisation for future studies. We recommend the use of the marginal ear vein prick technique for determining glycaemic responses, but it must be noted that no comparison with samples taken via IV catheters was made and a correction factor was needed to be applied to the results obtained from the glucometer.
The reason for this difference between blood glucose concentrations determined by glucometer and those determined using laboratory analysis is likely due to differences in reference methods, frequency of calibration and methodology used. The glucometer uses ion-selective electrode technology whereas laboratory analysis uses auto analysers involving enzymatic assays. The autoanalyser is calibrated regularly and therefore is more likely to give an accurate result, whereas the glucometer is generally used for monitoring purposes, therefore the values determined using this method are more relative, and not necessarily as accurate. However the results determined in our study differed from the laboratory values by a consistent amount therefore a common correction factor was applied to adjust for the discrepancy.
A number of studies in humans and animals have been carried out comparing the blood glucose concentrations determined using hand-held glucometers and laboratory analyses The results reported in human studies vary, with some reporting no significant differences between the two methods (Lacara et al., Reference Lacara, Domagtoy, Lickliter, Quattrocchi, Snipes, Kuszaj and And Prasnikar2007) and others reporting differences, with the hand-held meters producing elevated concentrations (Ho et al., Reference Ho, Yeung and Young2004; Hoedemaekers et al., Reference Hoedemaekers, Klein Gunnewiek, Prinsen, Willems and Van der Hoeven2008). In contrast, data from dogs and cats by Wess and Reusch (Reference Wess and Reusch2000a,Reference Wess and Reuschb,Reference Wess and Reuschc), showed that in the majority of cases the hand-held glucometers produced lower blood glucose concentration readings than the laboratory analyses, which agreed with our study. However, they concluded, along with Cohen et al. (Reference Cohen, Nelson, Kass, Christopher and Feldman2009) that hand held glucometers were sufficiently accurate to use in cats and dogs and produced concentrations which were highly correlated with laboratory concentrations.
Appleton et al. (Reference Appleton, Rand, Priest and And Sunvold2001a) reported a reference range for fasting plasma glucose concentrations in cats from 2.1 to 5.8 mmol/l. Cats in the current study, did not have fasting glucose levels below this range, however two cats on each diet had fasting levels above the upper limit of this range (i.e. 5.8 mmol/l). However, the mean fasting blood glucose concentrations for each group of cats on each diet were within this normal range.
In contrast to the fasting blood glucose range reported by Appleton et al. (Reference Appleton, Rand, Priest and And Sunvold2001a), NRC (2006) suggested a normal range for blood glucose concentrations in cats from 3.9 to 6.7 mmol/l, (after Swenson, Reference Swenson and Swenson1989). In the present study, 7 out of the 8 cats on both of the diets had blood glucose concentrations below the lower limit of 3.9 mmol/l at one or more time points, and one cat in the HC group had a blood glucose concentration above the upper limit of 6.7 mmol/l. When comparing the mean blood glucose concentrations at each time point for the HP diet, all values were within the range. In comparison, cats in the HC had mean fasting blood glucose concentrations and concentrations at 30 min post-prandial which were lower than the lower limit of this range. At these time points the blood glucose concentrations were also significantly different between the two diets.
Until recently, the majority of research regarding the influence of diet composition on feline glycaemic responses has involved the use of diabetic rather than healthy cats (Mori et al., Reference Mori, Sako, Lee, Nishimaki, Fukuta, Mizutani, Honjo and Arai2009). Such studies by Frank et al. (Reference Frank, Anderson, Pazak, Hodgkins, Ballam and Laflamme2001) and Mazzaferro et al. (Reference Mazzaferro, Greco, Turner and Fettman2003) reported that feeding diabetic cats low carbohydrate diets (6.9 to 8.1% on a DM basis) improved hyperglycaemia, led to a decrease in required insulin dosage and an increase in the rate of diabetic remission. A study by Bennett et al. (Reference Bennett, Greco, Peterson, Kirk, Mathes and Fettman2006) determined that 68% of the diabetic cats fed a low carbohydrate diet (12% of ME from carbohydrates) reverted back to a non-insulin dependent state, compared to only 41% of the cats fed the moderate carbohydrate diet (26% of ME from carbohydrates).
Published data on the effect of diet composition on glycaemic and insulinaemic responses in normal healthy cats are limited and contradictory. A study by Hoenig et al. (Reference Hoenig, Alexander and Pazak2000) fed high protein (58.2% DM) and low protein (33.1% DM) diets to cats and found no significant difference in postprandial glucose responses between the two diets. In contrast, a study by Farrow et al. (Reference Farrow, Rand and Sunvold2002) found that a high carbohydrate diet (47% of ME from carbohydrates) fed to cats produced significantly higher mean and maximal blood glucose concentrations and AUC compared to high protein (46% of ME from protein on an energy basis) and high fat diets (47% of ME from fat). A more recent study by Mori et al., (Reference Mori, Sako, Lee, Nishimaki, Fukuta, Mizutani, Honjo and Arai2009) determined the post-prandial glycaemic responses of healthy cats fed one of three diets; diet 1 (low protein, high fat, high carbohydrate and low fibre); diet 2 (high protein, high fat, low carbohydrate and high fibre) and diet 3 (low protein, low fat, high carbohydrate and high fibre). There were no significant differences between post-prandial blood glucose and pre-prandial fasting blood glucose levels for diets 1 and 3, but there was a significant decrease for diet 2. This diet was high in protein, and contained 50-60% less carbohydrate than the other two diets. The discrepancies between these studies may relate to differences in the sample size, duration of feeding or sources of protein, fat and carbohydrate used in diet formulations.
The current study demonstrated differences in glycaemic responses in healthy cats fed diets varying in macronutrient composition. Interestingly, the cats fed the HC diet had lower fasting blood glucose concentrations than those fed the HP diet, but also exhibited higher post-prandial Cmax and blood glucose concentrations that remained higher at the final time point (420 min). Despite previous reports that sex and age influence blood glucose concentrations and the development of diabetes mellitus (Prahl et al., Reference Prahl, Guptill, Glickman, Tetrick and Glickman2007; Kley et al., Reference Kley, Hoenig, Glushka, Jin, Burgess, Waldron, Jordan, Prestegard, Ferguson, Wu and Olson2009), no effect of sex or age was seen on the blood glucose concentrations determined in the current study.
The glycaemic load associated with the dry, high carbohydrate diets commonly fed to cats today provide a physiological and metabolic challenge to them (Zoran, Reference Zoran2002; Rand et al., Reference Rand, Fleeman, Farrow, Appleton and Lederer2004). Consequently, long term feeding of these diets may lead to the development of obesity and/or diabetes mellitus. Therefore, formulating a diet which is aligned with the carnivorous requirements of the cat and which minimises increased blood glucose and insulin concentrations following ingestion would be hugely beneficial to maintain cats at a healthy bodyweight and prevent the development of obesity and diabetes mellitus. Such a diet should be useful as a management tool for diabetic cats. The HP diet tested in this study may be beneficial for these purposes, as it was shown to provide more stable blood glucose concentrations, produce smaller fluctuations in blood glucose after ingestion and result in no increase in the bodyweight of cats over the 3-week trial.
Conclusions
The high protein low carbohydrate diet (HP) developed for the present study was beneficial for blood glucose control and weight management in cats. The HP diet, being high in protein and low in carbohydrate, is closer aligned to their natural carnivorous diet (Zoran, Reference Zoran2002; Kirk, Reference Kirk2006; Backus et al., Reference Backus, Cave and Keisler2007), and also conferred several advantages, including higher nutrient digestibility, maintenance of bodyweight, smaller fluctuations in blood glucose concentrations and therefore a slower, more sustained release of glucose into the bloodstream. Future studies are warranted to test this diet over a longer duration. The marginal ear vein prick technique used in this study proved to be a viable alternative to catheterisation, being quick, cost effective, low invasive and causing minimal stress to the cats. The method was effective for blood glucose determination and therefore would be a useful low invasive method of testing glycaemic control in cats.