Introduction
Watching the motion of atoms in real time has been a dream for scientists for a long time. The structural dynamics of atoms (i.e., the change of spatial coordinates of the valence electrons and the cores) is one of the key elements for the understanding of catalytic reactions, light to energy conversion such as water splitting, and phase transitions in materials science. Motion on the atomic level is relevant in processes such as film growth, and the inherent fundamental processes of adsorption, desorption, or diffusion of atoms as well as friction and lubrication—the examples are numerous.
The time scale for atomic motion is determined by Newton’s Second Law through the mass of atoms and the strength of bonds. This time scale can be roughly estimated from one-quarter of a period of the highest frequency phonon modes, which is representative for the motion of atoms of mass, m, and interatomic potential, V(r), in the solid phase, where r is the interatomic distance. With typical phonon frequencies in the THz regime, this translates to the motion of atoms being on a femtosecond time scale.
We are especially interested in the ultrafast and nonequilibrium dynamics of atoms at surfaces. For this, we have explored a prototypical one-dimensional (1D) atomic wire system on a surface, namely one atomic layer of indium atoms on a silicon (111) surface. This system exhibits an inherent Peierls instabilityReference Peierls1,Reference Jahn and Teller2 (i.e., a structural instability accompanied by a periodicity doubling along the wire), which was used in this work to demonstrate how ultrafast motion of atoms from one structural state to another can be monitored in the time domain. To watch such processes on the relevant atomistic level requires techniques capable of following the dynamics on a femtosecond time scale and on a sub-Angström length scale. This should finally answer the question—how fast do atoms move?
Time-resolved electron diffraction
The method of choice to satisfy these requirements is time-resolved diffraction with wavelengths of less than 2 Å. For studies of structural dynamics in bulk materials or thick films, ultrafast x-ray diffraction is a well-established method employing both tabletop setups as well as free-electron laser facilities.Reference Siders, Cavalleri, Sokolowski-Tinten, Tóth, Guo, Kammler, Horn-von Hoegen, Wilson, von der Linde and Barty3–Reference Lindenberg, Johnson and Reis11 Owing to their higher scattering cross section, high-energy electron diffraction has been employed in transmission geometry through freestanding thin electron-transparent crystalline films.Reference Siwick, Dwyer, Jordan and Miller12–Reference Morimoto and Baum19 Utilizing relativistic energies of a few MeV allows the study of thicker films and avoids space-charge broadening.Reference Weathersby, Brown, Centurion, Chase, Coffee, Corbett, Eichner, Frisch, Fry, Gühr, Hartmann, Hast, Hettel, Jobe, Jongewaard, Lewandowski, Li, Lindenberg, Makasyuk, May, McCormick, Nguyen, Reid, Shen, Sokolowski-Tinten, Vecchione, Vetter, Wu, Yang, Dürr and Wang20,Reference Sokolowski-Tinten, Li, Reid, Weathersby, Quirin, Chase, Coffee, Corbett, Fry, Hartmann, Hast, Hettel, Horn-von Hoegen, Janoschka, Lewandowski, Ligges, Meyer zu Heringdorf, Shen, Vecchione, Witt, Wu, Dürr and Wang21
For studies at surfaces, electrons are useful because their elastic scattering cross section is 4–6 orders of magnitude larger than for x-rays, thus ensuring enhanced surface sensitivity. The practicability of such an experiment was demonstrated by the early pioneering work of MourouReference Mourou and Williamson22 and Elsayed-AliReference Elsayed-Ali and Mourou23,Reference Elsayed-Ali and Herman24 with subnanosecond temporal resolution. Aeschlimann et al. improved the temporal resolution to a few tenths of picoseconds, studying the transient heating and cooling of a platinum surface.Reference Aeschlimann, Hull, Cao, Schmuttenmaer, Jahn, Gao, Elsayed-Ali, Mantell and Scheinfein25 Ruan and Zewail applied the technique for early studies of structural dynamics at Si surfaces.Reference Ruan, Vigliotti, Lobastov, Chen and Zewail26–Reference Ruan, Lobastov, Vigliotti, Chen and Zewail28
Electron diffraction patterns yield a rich variety of structural information all available at once, including:Reference Cavalleri29
• the change in geometry or periodicity at the surface from the appearance or disappearance of spots;
• the lattice parameter or strain state of the surface from the spot position;
• the temperature through the Debye–Waller effect (i.e., decrease in spot intensity due to increased thermal motion); and
• the atomic geometry of atoms in the unit cell from the rise or drop of spot intensity.
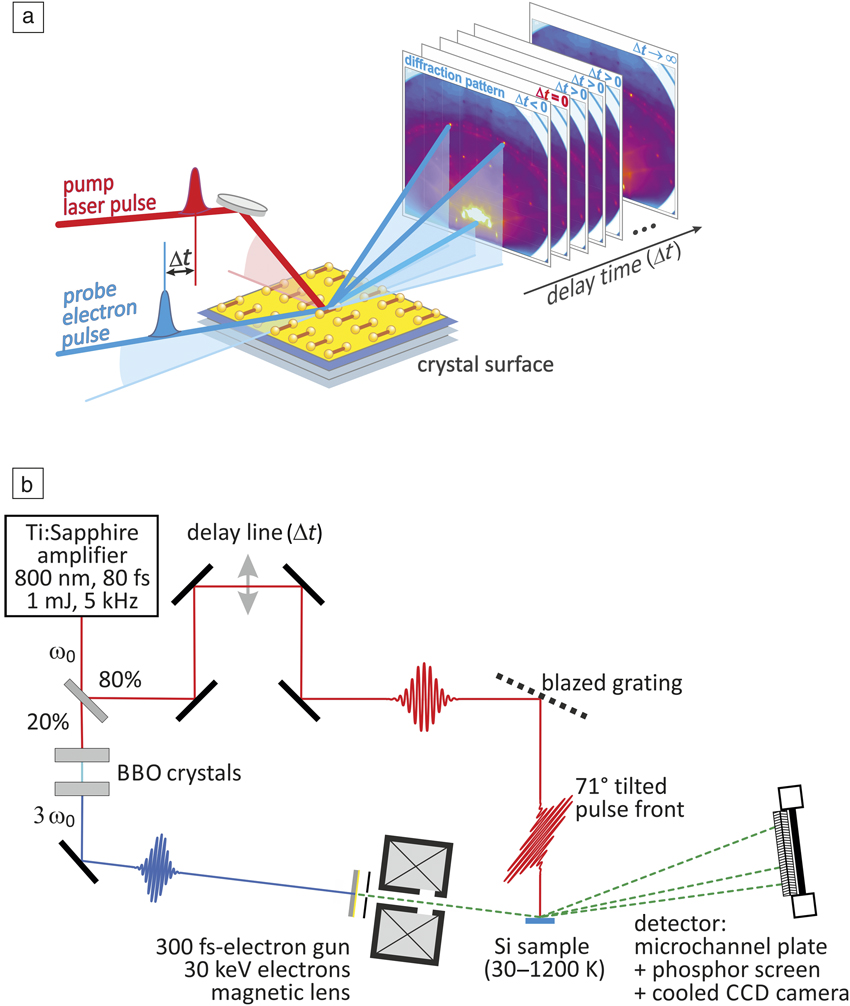
The ultrafast dynamics on a femtosecond time scale in the time domain is generally studied using a pump-probe setup: the system under investigation is excited by an appropriate femtosecond optical pump pulse and the surface transient response is subsequently probed after some time delay, Δt, by an ultrashort probe pulse (Figure 1). In our case, this is a femtosecond electron pulse in a reflection high-energy electron diffraction (RHEED) setup. For reversible systems without sensitivity to radiation damage, this procedure can be repeated in a stroboscopic fashion many times for the benefit of improved signal-to-noise ratio. The systematic variation of Δt provides an ultrafast movie of the changes in the transient diffraction pattern. The camera or two-dimensional detector can be slow and usually integrates over many pump-probe pulses. Thus, the convolution of pump and probe pulse—and not the shutter speed of the camera—sets the limits for the ultimate temporal resolution of the experiment.
(a) Pump-probe scheme of the ultrafast reflection high-energy electron diffraction experiment. The excitation of the surface by a femtosecond (fs)-laser pulse (red) is followed by a time-delayed ultrashort electron pulse (blue). Diffraction patterns are taken for various time delays Δt. (b) Schematics of the experimental setup with a femtosecond-laser amplifier at frequency ω0, delay line, tilted pulse front scheme, sample, frequency tripling with nonlinear beta barium borate (BBO) crystals, electron gun, and detector with microchannel plate, phosphor screen, and charge-coupled device (CCD) camera.Reference Hanisch-Blicharski, Janzen, Krenzer, Wall, Klasing, Kalus, Frigge, Kammler and Horn-von Hoegen30

We used a Ti:Sapphire laser amplifier at a repetition rate of 5 kHz, providing infrared light with a central wavelength of 800 nm (i.e., a photon energy of 1.55 eV) as a primary source for the excitation of the sample. The pulse duration is 80 fs (full width at half maximum [FWHM]) with a pulse energy of 1 mJ. With our setup, we achieve a pump-laser fluence up to 12 mJ/cm2 on the sample.
The experimental setup is sketched in Figure 1b.Reference Hanisch-Blicharski, Janzen, Krenzer, Wall, Klasing, Kalus, Frigge, Kammler and Horn-von Hoegen30 With a R20/T80 beam splitter, the laser pulse is divided. The 80% part is used for photoexcitation of the surface and is time delayed by means of an optomechanical delay line of a length of 50 cm; thus, providing negative (probe prior to excitation at Δt < 0) to positive (probe after excitation at Δt > 0) time delays –300 ps < Δt < 3000 ps.
The 20% part of the laser pulse is frequency tripled in two barium borate crystals. The ultraviolet (UV) pulse of 4.65 eV passes a MgF2 window and generates a femtosecond-electron pulse through single-photon photoemission from a back-illuminated 10-nm Au photocathode. The electrons are accelerated in a high extraction field of 7.5 keV/mm toward the anode to an energy of 30 keV. The need to minimize temporal broadening of the electron pulse through space-charge repulsion and vacuum dispersion requires the use of fast electrons.Reference Janzen, Krenzer, Zhou, von der Linde and Horn-von Hoegen31,Reference Janzen, Krenzer, Heinz, Zhou, Thien, Hanisch, Meyer zu Heringdorf, von der Linde and Horn-von Hoegen32
Initially, the resulting electron pulse has the same time structure as the laser pulse. However, space-charge effects and initial energy spread results in temporal broadening of the pulse.Reference Siwick, Dwyer, Jordan and Miller33 Both effects are strongly reduced for high-energy electrons with energy E > 5 keV. In our experiment, a fortunate matching of work function reduction of the thin Au photocathode and the frequency tripled photon energy results in narrow initial energy spread of only ΔE < 0.1 eV,Reference Janzen, Krenzer, Heinz, Zhou, Thien, Hanisch, Meyer zu Heringdorf, von der Linde and Horn-von Hoegen32 ultimately causing an electron pulse length on the sample of less than 300 fs (FWHM).
The necessity of using high-energy electrons with E > 5 keV prohibits normal incidence of the electrons for the diffraction experiment. With dominant forward scattering and a mean free path on the order of a few nanometers, these electrons are no longer surface sensitive. The large vertical momentum transfer for backscattering under normal incidence at such high electron energies would give rise to a huge Debye–Waller effect (i.e., a back-reflection diffraction pattern is impossible). Surface sensitivity is only achieved for a grazing angle of incidence between 1°–5° in a RHEED geometry.Reference Ichimiya and Cohen34,Reference Braun35 Under these conditions, the electrons only probe the surface layer and are highly sensitive to changes in surface reconstruction, atomic positions, step edges, or vibrational motion. In a seminal effort, Ropers and co-workers have miniaturized a photo activated low energy electron gun to a length of only 200 µm. Thus, they were able to control space-charge broadening and vacuum dispersion effects, achieving a temporal resolution of 1.4 ps even for electron energies as low as E = 50 eV.Reference Vogelgesang, Storeck, Horstmann, Diekmann, Sivis, Schramm, Rossnagel, Schäfer and Ropers36
A magnetic lens between the anode and sample focuses the electron beam onto the detector. The diffraction pattern is amplified by a microchannel plate, imaged on a phosphor screen and recorded by a 16-bit low noise, long exposure charge-coupled device (CCD) camera. The RHEED pattern is distorted due to the intersection of the edge of the Ewald sphere with the surface reciprocal space rods. All reflection spots are located along the so-called Laue circles. From the width of the diffraction spots, we conclude a maximum transversal coherence length of 5 nm × 54 nm.
A major challenge for the RHEED geometry is the so-called velocity mismatch between electrons under grazing incidence and laser pulses under normal incidence. While the surface is excited in only 80 fs, the electrons under grazing incidence at a velocity of one-third of the speed of light need 10 ps to traverse a sample of a typical width of 1 mm.
A titled pulse front schemeReference Baum and Zewail37 is employed to compensate for this velocity mismatch—the intensity front of the pump pulse is tilted by means of a blazed grating by almost 71°. This setup compensates for the slower motion of the electrons and ensures constant time delay across the entire width of the sample.Reference Zhou, Streubühr, Kalus, Frigge, Wall, Hanisch-Blicharski, Kammler, Ligges, Bovensiepen, von der Linde and Horn-von Hoegen38
Ultimately, a temporal response function of the entire experimental setup of 350 fs (FWHM) was obtained for N = 400 electrons per pulse, as determined through the transient response of an inverse Peierls transition.Reference Frigge, Hafke, Witte, Krenzer, Streubühr, Samad Syed, Mikšić Trontl, Avigo, Zhou, Ligges, von der Linde, Bovensiepen, Horn-von Hoegen, Wippermann, Lücke, Sanna, Gerstmann and Schmidt39 Due to enhanced space-charge broadening,Reference Siwick, Dwyer, Jordan and Miller33 the temporal resolution degrades with increasing number, N, of electrons to 900 fs and 1.4 ps for N = 1000 and N = 9000, respectively.
The samples were prepared and studied under ultrahigh vacuum conditions at a background pressure of 2 × 10⁻¹⁰ mbar. Narrow Si(111) samples of 2-mm width were mounted on a cryostat, which allows cooling to 90 K with liquid N2 and 30 K with liquid He. Si samples were prepared by degassing at 600°C, followed by a short flash anneal close to the melting point, thus removing the native oxide. Indium atomic wires were repeatedly prepared in situ through deposition of one monolayer of In (7.8 × 10¹⁴ atoms per cm2) via molecular beams from small Knudsen cell evaporators in the same chamberReference Kury, Hild, Thien, Günter, Meyer zu Heringdorf and Horn-von Hoegen40 onto the (111) surface of a single crystal of silicon at 450°C. Self-assembly leads to a highly ordered array of atomic-scale indium wires.Reference Yeom, Takeda, Rotenberg, Matsuda, Horikoshi, Schaefer, Lee, Kevan, Ohta, Nagao and Hasegawa41–Reference Kumpf, Bunk, Zeysing, Su, Nielsen, Johnson, Feidenhans’l and Bechgaard44
The Peierls system Si(111)-In(8 × 2)↔(4 × 1)
For this study, we have chosen the indium atomic wire system on a silicon (111) surface due to its unique and peculiar properties. This prototypical surface system exhibits an inherent Peierls instability, resulting in a first-order phase transition between an insulating (8 × 2) ground state and a metallic (4 × 1) high-temperature state. This structural transition can be nonthermally driven through an optical excitation and, subsequently, is trapped for nanoseconds in a supercooled metastable state.
The metallic high-temperature phase of this atomic wire system is composed of two parallel zigzag chains of indium atoms with a (4 × 1) unit cell,Reference Wippermann and Schmidt45,Reference Schmidt, Wippermann, Sanna, Babilon, Vollmers and Gerstmann46 as sketched in Figure 2a. The corresponding low-energy electron diffraction (LEED) pattern is shown in the right panel of Figure 2a with its threefold symmetry arising from three rotational domains at the hexagonal (111) surface.
(a) (Left) The metallic high-temperature (4 × 1) state is composed of In atoms arranged in double zigzag chains.Reference Wippermann and Schmidt45,Reference Schmidt, Wippermann, Sanna, Babilon, Vollmers and Gerstmann46 The electronic band structure, E, as a function of electrons momentum, k ||, is filled (bold red line) up to the Fermi energy level, E F. (Right) At a sample temperature T 0 = 140 K, the low-energy electron diffraction (LEED) pattern depicts the (4 × 1) reconstruction in three rotational domains.Reference Wall, Krenzer, Wippermann, Sanna, Klasing, Hanisch-Blicharski, Kammler, Schmidt and Horn-von Hoegen47 (b) (Left) The insulating (8 × 2) ground state exhibits a Peierls distortion with the formation of a charge-density wave (CDW) and opening of a bandgap as depicted in the schematics of the band structure.Reference Park, Yeom, Min, Park and Lyo48 The In atoms are rearranged in distorted hexagons.Reference Wippermann and Schmidt45,Reference Schmidt, Wippermann, Sanna, Babilon, Vollmers and Gerstmann46 (Right) At a sample temperature T 0 = 80 K, the (8 × 2) LEED pattern exhibits periodicity doubling along and perpendicular to the wires. The eightfold spots and twofold streaks are indicative of the ground-state structure.Reference Wall, Krenzer, Wippermann, Sanna, Klasing, Hanisch-Blicharski, Kammler, Schmidt and Horn-von Hoegen47 (c) Reflection high-energy electron diffraction (RHEED) intensity of (upper) the (8 × 2) spot and (lower) the (4 × 1) spot as a function of temperature. Upon heating (red triangles), the intensity of the (8 × 2) spot drops to the background at T c. Cooling (blue triangles) at the same rate leads to the transition back into the (8 × 2) reconstruction. The intensity of the (4× 1) spot rises upon heating at the critical temperature  $T_{\rm{c}}^ +$ and decreases at
 $T_{\rm{c}}^ -$, reflecting the change in atom position in the unit cell. The temperature cycling of both spots exhibits a hysteresis of ΔT hys = 11 K as indicated by the two horizontal arrows.Reference Kim and Cho49 (d) Potential energy surface, E, for T = 0 K obtained through density functional theory as a function of a generalized reaction coordinate, R grc, which describes the transition from the (4 × 1) to the (8 × 2) phase. The bandgap energy E gap and barrier energy E barrier are indicated. The blue and red dots indicate the (8 × 2) ground state and the metastable (4 × 1) state, respectively.Reference Wall, Krenzer, Wippermann, Sanna, Klasing, Hanisch-Blicharski, Kammler, Schmidt and Horn-von Hoegen47

Upon cooling, the system undergoes a reversible transition to the insulating ground state at a critical temperature T c = 130 K, which is accompanied with the opening of a bandgap of energy E gap = 0.1 eV47,48 and the formation of a charge-density wave (CDW). In the ground state, the zigzag chains of indium atoms are broken, and they rearrange into distorted hexagonsReference Wippermann and Schmidt45,Reference Schmidt, Wippermann, Sanna, Babilon, Vollmers and Gerstmann46 (Figure 2b). During the phase transition, the maximum change in the geometric position of the In atoms in the surface unit cell is only 0.1 Å.Reference Kim and Cho49 This Peierls-like transition is characterized by symmetry breaking in both dimensions, which is facilitated through soft shear- and rotational-phonon modes, with frequencies of νshear = 0.54 THz and νrot = 0.81 THz, respectively.Reference Wippermann and Schmidt45 The surface periodicity doubles along and normal to the wires and the size of the unit cell increases to (8 × 2). This change becomes obvious in the LEED pattern in the right panel of Figure 2b through the appearance of additional spots at eightfold position between the fourfold spots. The appearance of twofold streaks emerges from the missing correlation of the twofold periodicity in neighboring wires.
During slow temperature cycling, we observed hysteresis of the high-temperature (4 × 1) and low-temperature (8 × 2) states upon heating and cooling, as shown in Figure 2c. The width of the hysteresis is independent of the cooling/heating rate dT/dt.Reference Klasing, Frigge, Hafke, Wall, Krenzer, Hanisch-Blicharski and Horn-von Hoegen50 Such behavior is evidence of a first-order phase transition (i.e., a noncontinuous transition) with both states separated by a small energy barrier, which is an inevitable prerequisite for the existence of supercooled metastable states.
Photo-induced transition
To trigger the fastest possible structural dynamics in material systems, intense laser pulses (1010 to 1012 W/cm2) on a femtosecond time scale (20 to 100 fs) must be employed. The sudden and massive optical excitation of the electron system transiently changes the potential energy surface for the atom positions in the lattice. This provokes accelerating forces on the atoms, causing the structural transition.
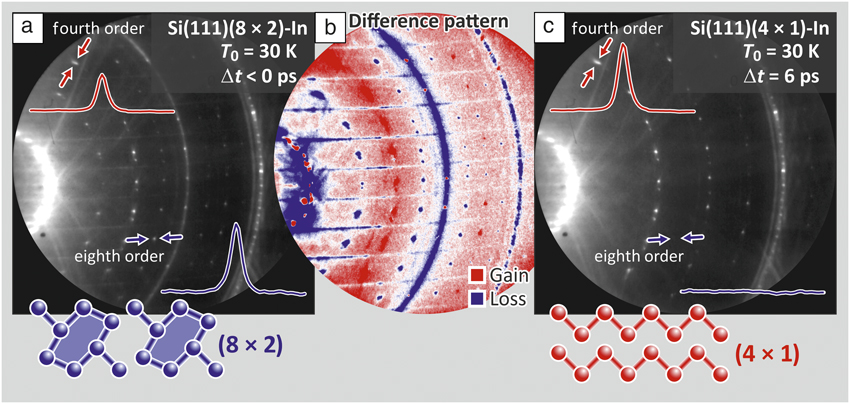
The photo-induced transition in this material system is shown in Figure 3a, which depicts the RHEED pattern of the (8 × 2) ground state prior to optical excitation at negative pump-probe delays Δt < 0 at a temperature T 0 = 30 K (i.e., well below T c = 130 K). The pattern taken at Δt = 6 ps (i.e., after optical excitation through a femtosecond-laser pulse) with a fluence of Φ = 6.7 mJ/cm2 is shown in Figure 3b and exhibits clear differences. The transient changes of spot intensity become more obvious in the difference pattern in Figure 3c depicting intensity gains (red) and losses (blue) in a false color representation. All eightfold spots and twofold streaks (indicative for the ground state) disappeared while fourfold spots (indicative for the high-temperature state) gained intensity. This is also reflected by the clear changes in the two representative spot profiles shown for an (8 × 2) and (4 × 1) spot in blue and red, respectively. This clearly demonstrates that the structural transition can be driven by ultrashort optical excitation.
Reflection high-energy electron diffraction (RHEED) patterns at a sample temperature of T 0 = 30 K prior to and after optical excitation through a femtosecond-laser pulse. (a) Pattern exhibiting the (8 × 2) ground state. Spot profiles of a fourfold and an eightfold spot are shown in red and blue, respectively. (b) The difference pattern in false color representation exhibits systematic changes: all (4 × 1) spots gain intensity (red) while the (8 × 2) and twofold streaks disappear (blue).Reference Frigge, Hafke, Witte, Krenzer, Streubühr, Samad Syed, Mikšić Trontl, Avigo, Zhou, Ligges, von der Linde, Bovensiepen, Horn-von Hoegen, Wippermann, Lücke, Sanna, Gerstmann and Schmidt39 (c) The pattern after excitation at a time delay Δt = 6 ps has changed to (4 × 1). All (8 × 2) spots and twofold streaks have disappeared, as evident from the changes in spot profile, indicating the structural transition.

Supercooled excited state
The excited (4 × 1) state is stable for nanoseconds and only slowly recovers the (8 × 2) ground state, as seen in Figure 4f, where the intensity of a (4 × 1) spot is plotted for long pump-probe delays, Δt. This finding is quite surprising since excitations of the electron system typically last for only a few tens to a few hundred femtoseconds. Here, however, we observe a lifetime of the excited (4 × 1) state that is 105 times longer. Thus, an explanation through an electronic excitation can be excluded. As we will show later, the indium surface layer cools via heat transport with a cooling time constant τcool = 30 ps to the substrate temperature of T 0 = 30 K. We can thus safely exclude a slow thermal recovery of the (8 × 2) ground state.
Time evolution of the diffraction intensities following the femtosecond (fs) photoexcitation as a function of pump-probe delay, Δt. Sample temperature is T 0 = 30 K. Solid lines are exponential fits to the data. (a) The transient intensity of an (8 × 2) spot at a laser fluence of Φ = 6.7 mJ/cm2 vanishes at an excitation rate of τexc = 370 fs with respect to the background level. (b) Transient intensity of the (00) spot reflecting the structural transition from (8 × 2) to (4 × 1) state at a rate of τexc = 350 fs. (c) Characteristic soft hexagon rotary and shear phonon modes with energies  $E_{{\rm{hex}}}^{{\rm{theo}}}$ and
 $E_{{\rm{shear}}}^{{\rm{theo}}}$ and oscillation periods
 $T_{{\rm{hex}}}^{}$ and
 $T_{{\rm{shear}}}^{}$, respectively, which facilitates the transition.Reference Wippermann and Schmidt45 (d–e) Transient intensity of a fourth-order spot and the thermal diffuse background at a laser fluence of Φ = 6.7 mJ/cm2, respectively.Reference Frigge, Hafke, Witte, Krenzer, Streubühr, Samad Syed, Mikšić Trontl, Avigo, Zhou, Ligges, von der Linde, Bovensiepen, Horn-von Hoegen, Wippermann, Lücke, Sanna, Gerstmann and Schmidt39 (e) The transient dip in the intensity of the fourth-order spot ΔI DW (yellow shaded area, DW = Debye–Waller) at Δt = 6 ps indicates surface heating by ΔT = 80 K, which coincides with the transient increase in diffuse background intensity. The fourth-order spot intensity is described (solid red curve) by the superposition of the two dashed lines, representing incoherent thermal motion (heating and subsequent cooling with time constants of τheat = 2.2 ps and τcool = 30 ps, respectively) and (d) the structural transition with τexc = 350 fs.Reference Frigge, Hafke, Witte, Krenzer, Streubühr, Samad Syed, Mikšić Trontl, Avigo, Zhou, Ligges, von der Linde, Bovensiepen, Horn-von Hoegen, Wippermann, Lücke, Sanna, Gerstmann and Schmidt39,Reference Frigge, Hafke, Witte, Krenzer and Horn-von Hoegen57 (f) Metastable state for long time scales. The supercooled (4 × 1) state recovers slowly on a τrec = 3 ns time scale.Reference Wall, Krenzer, Wippermann, Sanna, Klasing, Hanisch-Blicharski, Kammler, Schmidt and Horn-von Hoegen47

In contrast, this long-lived (4 × 1) state is explained through the nature of the phase transition: in general, a first-order transition exhibits a barrier between the two states hindering the immediate recovery of the ground state. This picture is corroborated through density functional theory calculations of the potential energy surface (PES). Figure 2d depicts this PES as function of a generalized reaction coordinate, R grc, obtained by superimposing the soft shear and rotary phonon eigenvectors that transform between the (4 ×1) and the (8 × 2) phases.Reference Wippermann and Schmidt45,Reference Schmidt, Wippermann, Sanna, Babilon, Vollmers and Gerstmann46 We found the transition from the (4 × 1) phase to the (8 × 2) structure to be hampered by an energy barrier of E barrier = 40 meV. At temperatures below T c, this barrier hinders the immediate recovery to the (8 × 2) ground state. A long-lived metastable and supercooled excited phase is stabilized and trapped in a state far from equilibrium for up to 10 ns.Reference Wall, Krenzer, Wippermann, Sanna, Klasing, Hanisch-Blicharski, Kammler, Schmidt and Horn-von Hoegen47
Analogous to a supercooled liquid, we observe freezing (i.e., the transition back to the [8 × 2] ground state) facilitated by condensation nuclei in the form of preexisting adsorbates or step edges. The system recovers to the ground state like a row of falling dominoes—one unit cell after the other falls back from (4 × 1) to (8 × 2) at a speed of the 1D recovery front of 80 m/s.Reference Wall, Krenzer, Wippermann, Sanna, Klasing, Hanisch-Blicharski, Kammler, Schmidt and Horn-von Hoegen47
Initial dynamics at the quantum limit
To determine the ultimate speed of the photo-induced structural transition, we determined, in the time domain, the diffraction spot intensities as function of pump-probe delay Δt (Figure 4). Figure 4a shows that the eighth-order diffraction intensity (indicative for the ground state) is quenched in less than 1 ps. Owing to the much higher signal-to-noise ratio as compared to the eighth-order spots, we analyzed the dynamics of the more intense (00) spot, which follows the same trend as the eighth-order spots (Figure 4b). The (00) spot decreases with a time constant of τexc = 350 fs for a laser fluence of Φ = 6.7 mJ/cm2, as shown in Figure 4b (i.e., the structural transition is completed in only ∼700 fs). No oscillatory signatures of the optical phonons connected to any periodic lattice distortion are observed, in contrast to studies on other CDW materials.Reference Perfetti, Loukakos, Lisowski, Bovensiepen, Berger, Biermann, Cornaglia, Georges and Wolf51–Reference Hellmann, Rohwer, Kalläne, Hanff, Sohrt, Stange, Carr, Murnane, Kapteyn, Kipp, Bauer and Rossnagel54
This structural transition from the initial insulating (8 × 2) state to the final metallic (4 × 1) state is driven by transient changes of the ground-state PES. The scenario is sketched in Figure 5, where the top and bottom series of drawings represent the transient PES and the changes of electronic band structure, respectively. Figure 5a depicts the insulating ground state of the system; the surface state valence band is populated and separated by a bandgap from the empty surface state conduction band. Photoexcitation of the electron system leads, through electron–hole generation (sketched in Figure 5b, bottom), to a depopulation of those states at the top of the valence band, which are responsible for the energy gain through the Peierls distortion (see Figure 5c, bottom). This results in a transient change of the PES, as sketched in Figure 5b–c, top, for Δt = 0.3 ps. Inevitably, the system undergoes a strongly accelerated displacive structural transition toward the minimum of the transient energy landscape. The experimentally determined value of the excitation time constant τexc = 350 fs is approximately one-quarter of the periods of the equilibrium rotational and shear modes, T rot = 1.2 ps and T shear = 1.8 ps, respectively.Reference Wippermann and Schmidt45
Transient changes of potential energy surface (upper row) and simplified band structure (lower row) as a function of time delay, Δt. Bold and thin lines in the schematic band structure indicate occupied and unoccupied states, respectively; red lines indicate excited states. (a) Ground-state potential energy surface, E(R grc), calculated through density functional theory (DFT) as a function of generalized reaction coordinate, R grc, prior to excitation. The band structure E(k ||) as a function of electron momentum k || exhibits a bandgap around the Fermi energy level, E F. (b) Photoexcitation and generation of electron–hole pair, excitation of the electron system, transient change in the potential energy surface (PES), and the resulting force  ${{\bf{F}}_\parallel }$ on the indium atoms. (c) Accelerated displacive structural transition; critically damped motion due to energy dissipation to manifold of surface optical phonon modes with energy, ħωopt (ωopt, angular frequency of optical phonons; ħ, reduced Planck’s constant). (d) System is trapped in an excited high-temperature state; electron and lattice systems are thermalized through emission of acoustic phonons of energy, ħω (ω, angular frequency of acoustic phonons). The bandgap is closed. (e) The system has cooled down and exhibits the ground-state PES; however, the system is trapped in a metastable, supercooled state; an energy barrier hinders the immediate recovery of the ground state for nanoseconds.Reference Zhou, Streubühr, Kalus, Frigge, Wall, Hanisch-Blicharski, Kammler, Ligges, Bovensiepen, von der Linde and Horn-von Hoegen38,Reference Wippermann and Schmidt45

The observed sharp switching from the (8 × 2) to the (4 × 1) phase is explained through fast mode conversion, dephasing, and strong damping of the two characteristic phonon modes that facilitate the transition.Reference Wippermann and Schmidt45 The initially excited rotary and shear modes rapidly transfer their energy to a manifold of phonon modes present at the (8 × 2) reconstructed surface (see Figure 5c, top). These surface modes originate from Brillouin zone backfolding due to the 16× larger surface unit cell of the (8 × 2) as compared with a truncated bulk (1 × 1) unit cell. Consequently, the transition proceeds in the regime of critical damping and cannot be faster than in this limit.Reference Frigge, Hafke, Witte, Krenzer, Streubühr, Samad Syed, Mikšić Trontl, Avigo, Zhou, Ligges, von der Linde, Bovensiepen, Horn-von Hoegen, Wippermann, Lücke, Sanna, Gerstmann and Schmidt39 All of the indium atoms move in a spatially coherent manner—the structural transition proceeds in the quantum limit, in which the atomic motion is directed and deterministic and not determined by rates.Reference Ruan, Vigliotti, Lobastov, Chen and Zewail26
We further analyze the time-dependent intensity of the (4 × 1) diffraction spot (Figure 4d–e). Its temporal evolution is determined by two opposing trends. First, the initial increase within less than 1 ps is due to the structure factor enhancement of the (4 × 1) phase reflecting the change in atomic position. Second, the subsequent decrease in intensity is explained by the Debye–Waller effect and results from the excitation of incoherent surface vibrations.Reference Debye55,Reference Waller56 This leads to a transient minimum at 6 ps, which is confirmed by the rise in the thermal diffuse background and its temporal evolution (gray circles in Figure 4e). We find time constants of 2.2 ps and 30 ps for heating and cooling of the indium atoms, respectively. This situation is sketched in Figure 5d–e for Δt = 6 ps and Δt > 100 ps.
From the stationary Debye–Waller behavior of the high-temperature (4 × 1) phase and its extrapolation to lower temperatures, we determined the maximum transient temperature T max = T 0 + ΔT max = 30 K + 80 K = 110 K at Δt = 6 ps, which is well below T c = 130 K.Reference Frigge, Hafke, Witte, Krenzer and Horn-von Hoegen57 We therefore conclude that the structural transition occurs with τexc = 350 fs, well before the initial excitation has thermalized (within 6 ps), and so is nonthermally driven.
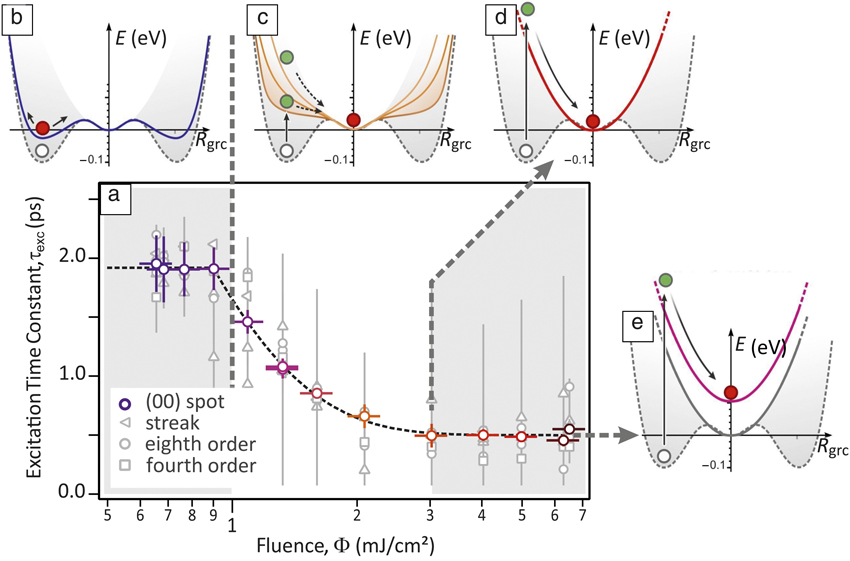
The structural transition time constant, τexc, depends on the laser fluence (Figure 6a). The shortest time constant of τexc = 350 fs is observed for Φ ≥ 3 mJ/cm2 and the maximum of τexc = 1.9 ps occurs for Φ < 1 mJ/cm2. The transition is incomplete, that is, remnants of (8 × 2) diffraction spots and streaks are observed for Φ < 2 mJ/cm2. The fluence dependence of the transition time constant, τexc, corroborates our picture of an accelerated displacive transition driven by transient changes of the PES. Below the threshold of Φ < 1 mJ/cm2, the transition is not driven since the barrier in the PES between (8 × 2) and (4 × 1) states cannot be overcome (Figure 6b). For an intermediate regime, 1 mJ/cm2 < Φ < 3 mJ/cm2 the energy of the (8 × 2) state has increased so much that the slope of the PES steepens with increasing fluence. Accordingly, the transition time shortens (Figure 6c). The maximum slope of the PES occurs at Φ ≥ 3 mJ/cm2, and the transition occurs as quickly as possible (Figure 6d). With increasing fluence, the transient PES shifts to higher energies without changing the slope (Figure 6e), as has been inferred from a thorough density functional calculation.Reference Frigge, Hafke, Witte, Krenzer, Streubühr, Samad Syed, Mikšić Trontl, Avigo, Zhou, Ligges, von der Linde, Bovensiepen, Horn-von Hoegen, Wippermann, Lücke, Sanna, Gerstmann and Schmidt39
(a) Fluence Φ dependence of the excitation time constant, τexc, of the driven structural transition plotted by open colored circles; gray circles indicate individual diffraction spots. Below Φ ≤ 1 mJ/cm2, the (8 × 2) state is not driven into the excited (4 × 1) state. (b) The ground state (dashed gray line and white dot) exhibits an excitation of the charge-density wave (blue solid line shows the transient potential energy surface [PES], red dot indicates excited state). (c) For the intermediate regime 1 mJ/cmReference Jahn and Teller2 < Φ < 3 mJ/cm2, the accelerated displacive structural transition into the excited (4 × 1) state takes place (green dots indicate system after photoexcitation). The slope of the PES (orange lines for different excitation levels) increases and speeds up the transition. (d–e) The transition speed saturates for Φ ≥ 3 mJ/cm2. The slope of the transient PES is at a maximum, and the system rushes into the metastable (4 × 1) state (red dot).Reference Frigge, Hafke, Witte, Krenzer, Streubühr, Samad Syed, Mikšić Trontl, Avigo, Zhou, Ligges, von der Linde, Bovensiepen, Horn-von Hoegen, Wippermann, Lücke, Sanna, Gerstmann and Schmidt39 The potential energy, E, is plotted as function of the generalized reaction coordinate, R grc.

Conclusions
With these results, we have demonstrated that it is now possible to watch the motion of atoms on the relevant Angstrom space and femtosecond time scales using time-resolved RHEED. This technique will provide fundamental new insight into the understanding of nonthermal excitations of the lattice system. We will be able to determine the mechanisms of how atoms are set into motion and where the forces arise. This knowledge of the atom coordinates as a function of time is crucial for understanding chemical reactions, light-induced water-splitting reactions, and ultrafast switching processes in driven structural transitions.
Finally, we are able to answer the question as to how fast atoms move; a rough estimate indicates a surprisingly low speed of only 50 km/h. The acceleration of ∼1014 m/s2, however, is more than a trillion times larger than that of a sports car.
Acknowledgments
This work was supported by the Deutsche Forschungsgemeinschaft through SFB616 “Energy dissipation at surfaces,” FOR1700 “Metallic nanowires on the atomic scale: Electronic and vibrational coupling in real world systems,” SFB1242 “Non-equilibrium dynamics of condensed matter in the time domain,” FOR1405 “Dynamics of electron transfer processes within transition metal sites in biological and bioinorganic systems,” and the High Performance Computing Center Stuttgart and the Paderborn Center for Parallel Computing.

Michael Horn-von Hoegen has been a full professor in the Department of Physics at Duisburg-Essen University, Germany, since 1999. He studied physics at Hannover University, Germany. He received his PhD degree in 1988 and Habilitation degree in 1994 in experimental physics from Hannover University. From 1989 to 1990, he was an IBM postdoctoral fellow at the IBM T.J. Watson Research Center. From 2002 to 2013, he was scientific director of the collaborative research center SFB 616 “Energy Dissipation at Surfaces.” His current research focuses on ultrafast phenomena on surfaces, with emphasis on structural dynamics of driven phase transitions, electron–phonon coupling, and nanoscale heat transport. Horn-von Hoegen can be reached by email at mhvh@uni-due.de.