1. Introduction
Trondhjemite–tonalite–granodiorite (TTG) rocks are juvenile plutonic suites of intermediate to felsic compositions (essentially primitive granitoids) that have some geochemical similarities to adakites; TTGs have also been referred to as low-Mg adakites (Rapp et al. Reference Rapp, Shimizu, Norman and Applegate1999; Condie, Reference Condie2005). Adakites have been described as arc-volcanic and plutonic rocks characterized by relatively high Mg no., high Sr/Y, high La/Yb and low Zr/Sm ratios, relatively enriched in compatible transition elements (such as Mg, Ni, Cr and V), with their chemistry reflecting extensive interaction of the ascending melt (of a subducted oceanic slab) with mantle peridotite, unlike magmas that produce TTGs (Defant & Drummond, Reference Defant and Drummond1990; Martin, Reference Martin1999; Rapp et al. Reference Rapp, Shimizu, Norman and Applegate1999; Condie, Reference Condie2005; Martin et al. Reference Martin, Smithies, Rapp, Moyen and Champion2005; Castillo, Reference Castillo2006, Reference Castillo2008, Reference Castillo2012; Moyen, Reference Moyen2009; Cox et al. Reference Cox, Foden and Collins2019). As summarized by Condie (Reference Condie2005), although adakites have some similar geochemical characteristics to TTGs, adakites are more mafic and have Mg no. > 0.5, Sr > 500 ppm (often > 1000 ppm), Cr > 50 ppm and Ni > 20 ppm. Given the volume of TTG lithologies, forming about 50% of preserved Archean terrains, and their significance in understanding the origin and early evolution of continental masses, numerous studies of TTGs have been carried out (e.g. Barker, Reference Barker and Barker1979; Martin, Reference Martin1987; Condie, Reference Condie1998; Smithies & Champion, Reference Smithies and Champion2000; Souza et al. Reference Souza, Potrel, Lafon, Althoff, Pimentel, Dall’Agnol and Oliveira2001; Foley et al. Reference Foley, Tiepolo and Vannucci2002; Condie, Reference Condie2005; Martin et al. Reference Martin, Smithies, Rapp, Moyen and Champion2005; Bédard, Reference Bédard2006; Moyen et al. Reference Moyen, Stevens, Kisters, Belcher, Van Kranendonk, Smithies and Bennet2007; Nair & Chacko, Reference Nair and Chacko2008; Senshu et al. Reference Senshu, Maruyama, Rino and Santosh2009; Huang et al. Reference Huang, Niu, Xu, Yang and Zhong2010; Moyen, Reference Moyen2011; Nagel et al. Reference Nagel, Hoffmann and Münker2012; Moyen & Martin, Reference Moyen and Martin2012; van Hunen & Moyen, Reference van Hunen and Moyen2012; Almeida et al. Reference Almeida, Dall’Agnol and Rocha2017).
A valuable body of experimental work on the generation of tonalitic–trondhjemitic melts has become available since the pioneering earlier studies of Green & Ringwood (Reference Green and Ringwood1968), Green (Reference Green1972) and Marsh & Carmichael (Reference Marsh and Carmichael1974). Rapp et al. (Reference Rapp, Watson and Miller1988) showed that 10–20% partial melting of low-K tholeiite via Hb-dehydration melting (at 16–22 kbar and 1100°C) produced high-Al TTG liquids. Wolf & Wyllie (Reference Wolf and Wyllie1989) demonstrated that vapour-absent (dehydration) melting of low-K olivine tholeiitic composition (natural amphibolites) at 10 kbar and 750–975°C produced high-Al tonalities with a Hb–Gnt-rich residue. Drummond & Defant (Reference Drummond and Defant1990) indicated that partial melting of a subducted basaltic slab under eclogitic to garnet–amphibolitic conditions (P = 23–26 kbar; T = 700–775°C) generates high-Al TTG suites. Several other experimental studies showed that melting of eclogites and amphibolites have produced melts of TTG compositions (e.g. Rapp et al. Reference Rapp, Watson and Miller1991; Winther, Reference Winther1996; Wylie et al. Reference Wylie, Wolf, van der Laan, De Wit and Ashwal1997; Prouteau et al. Reference Prouteau, Scaillet, Pichavant and Maury2001) and, as amphibole disappears relatively quickly during melting, the liquid produced would be in equilibrium with an amphibole-free assemblage (Gnt+Cpx), which is actually eclogitic (Moyen & Stevens, Reference Moyen, Stevens, Benn, Mareschal and Condie2006; Laurie & Stevens, Reference Laurie and Stevens2012). Since these and other experimental studies confirmed that melting of a subducted basaltic slab produces TTG suites, there is a strong link between TTGs and active subduction (e.g. Moyen & Martin, Reference Moyen and Martin2012). Accordingly, this study can be used to track subduction in the northernmost part of the Arabian–Nubian Shield (ANS) during the very late stages of the East African Orogen (EAO), for which the tectonic regime is still highly debatable.
Unaltered magmatic complexes exposed in NE Africa and Arabia form the best well-preserved Neoproterozoic terrains worldwide. These terrains encompass the vast ANS, which in itself is composed of amalgamated island-arc terranes and ophiolitic sutures, representing the northern segment of the EAO (Stern, Reference Stern1994) that extends from Mozambique, Madagascar, Ethiopia, Somalia and Eritrea, N-wards into Sudan, western Arabia, eastern Egypt, Sinai, southern Israel and Jordan. East and west Gondwana were sutured along the EAO. The ANS forms the largest crustal segment of the Pan-African mobile belt that girdles Africa; some authors, including Hoffman (Reference Hoffman1999) and Meert & Lieberman (Reference Meert and Lieberman2008), considered these Pan-African terrains to represent valuable archives of what has been considered as one of the most remarkable orogenic episodes in all of Earth’s history. It has been well-established that most TTG suites are of Archean–Palaeoproterozoic age, whereas Neoproterozoic TTGs are generally very scarce, with only a very few studies reported in the literature on TTG rocks occurring within the ANS. In this respect, a rare Neoproterozoic TTG suite has been identified at Mount Abu Fannani of eastern Egypt (Fig. 1), which is the subject of this contribution. Numerous investigations of other magmatic complexes within the northern part of the ANS have been carried out (e.g. Bentor, Reference Bentor1985; Abdel-Rahman & Doig, Reference Abdel-Rahman and Doig1987; Abdel-Rahman & Martin, Reference Abdel-Rahman and Martin1987; Abdel-Rahman, Reference Abdel-Rahman1990, Reference Abdel-Rahman1995, Reference Abdel-Rahman1996, Reference Abdel-Rahman2010, Reference Abdel-Rahman2016, Reference Abdel-Rahman2019; El-Shazly & El-Sayed, Reference El-Shazly and El-Sayed2000; Loizenbauer et al. Reference Loizenbauer, Walbrecher, Fritz, Neumayr, Khudeir and Kloetzli2001; El-Sayed et al. Reference El-Sayed, Obeid, Furnes and Moghazi2004; Eliwa et al. Reference Eliwa, Kimura and Itaya2006; Abdel-Rahman et al. Reference Abdel-Rahman, Polat, Dilek, Fryer, El-Sharkawy and Sakran2009; Bea et al. Reference Bea, Abu-Anbar, Montero, Peres and Talavera2009; Be’eri-Shlevin et al. Reference Be’eri-Shlevin, Katzir and Whitehouse2009, Reference Be’eri-Shlevin, Samuel, Azer, Ramo, Whitehouse and Moussa2011; Johnson et al. Reference Johnson, Andresen, Collins, Fowler, Fritz, Ghebrab, Kusky and Stern2011; Maurice et al. Reference Maurice, Basta and Khiamy2012; Fritz et al. Reference Fritz, Abdelsalam, Ali, Bingen, Collins, Fowler, Ghebreab, Hauzenberger, Johnson, Kusky, Macey, Muhongo, Stern and Viola2013; Jarrar et al. Reference Jarrar, Theye, Yaseen, Whitehouse, Pease and Passchier2013; Eyal et al. Reference Eyal, Be’eri-Shlevin, Eyal, Whitehouse and Litvinovsky2014, Reference Eyal, Eyal, Litvinovsky, Jahn, Calvo and Golan2019; Robinson et al. Reference Robinson, Foden, Collins and Payne2014; Elisha et al. Reference Elisha, Kylander-Clark and Katzir2017, Reference Elisha, Katzir, Kylander-Clark, Golan and Coble2019).
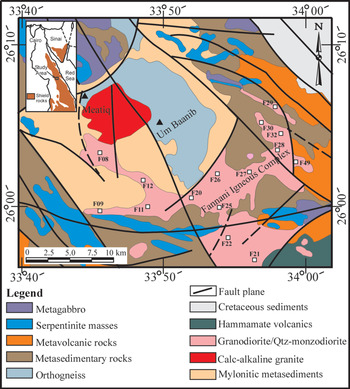
Geological map of the region containing the Meatiq metamorphic core complex of eastern Egypt, showing the exposures of the investigated Fannani Igneous Complex that cross-cuts rock units of both the metasedimentary succession and the ophiolitic assemblage, as well as the Um Baanib orthogneiss dome. The map is modified from El-Ramly (Reference El-Ramly1972), El-Gaby et al. (Reference El-Gaby, El-Nady and Khudeir1984) and Neumayr et al. (Reference Neumayr, Mogessie, Hoinkes and Puhl1996). Sample locations are marked by squares. Inset is a location map.

These, along with other investigations, have indicated that the nature of the tectonomagmatic environment in the northern segment of the EAO at c. 600 Ma is debatable. While some authors interpreted the Ediacaran magmatic activity in the ANS to have occurred in a post-collisional to extensional regime (e.g. Be’eri-Shlevin et al. Reference Be’eri-Shlevin, Samuel, Azer, Ramo, Whitehouse and Moussa2011; Jarrar et al. Reference Jarrar, Theye, Yaseen, Whitehouse, Pease and Passchier2013; Elisha et al. Reference Elisha, Kylander-Clark and Katzir2017, Reference Elisha, Katzir, Kylander-Clark, Golan and Coble2019; Eyal et al. Reference Eyal, Eyal, Litvinovsky, Jahn, Calvo and Golan2019), others suggested that such magmatism is subduction-related and developed during the very late orogenic stages of the EAO (e.g. Bentor, Reference Bentor1985; Doebrich et al. Reference Doebrich, Al-Jehani, Siddiqui, Hayes, Wooden and Johnson2007; Johnson et al. Reference Johnson, Andresen, Collins, Fowler, Fritz, Ghebrab, Kusky and Stern2011; Abu El-Enen & Whitehouse, Reference Abu El-Enen and Whitehouse2013; Robinson et al. Reference Robinson, Foden, Collins and Payne2014). The occurrence of TTG suites is considered to be one of the best markers for active subduction, and the discovery of this rare Ediacaran TTG suite of the Fannani Igneous Complex (FIC) can be used to shed light on this debatable and controversial issue. In addition, this study will provide basic petrological, geochemical and isotopic data on the FIC, determine its age of emplacement, and assess the petrogenetic processes involved. The data will also be used to evaluate the role of Pan-African TTG magmatism in shield evolution and in Neoproterozoic Gondwana assembly in the context of the regional geodynamic framework. In brief, the investigated TTG suite may have significant tectonomagmatic implications, and can help to redraw the sequence of events during the very late stages of the EAO.
2. The geological context
2.a. Regional geology and nature of host rocks
Shield rocks that make up most of the ANS consist predominantly of Pan-African orogenic plutonic and coeval volcanic assemblages developed essentially during the Neoproterozoic Era (c. 870–520 Ma; Shackleton, Reference Shackleton1996; Wilson et al. Reference Wilson, Grunow and Hanson1997). These assemblages occur within a mobile belt representing accreted island-arc terrains. As a result of the EAO, subduction and piling of thrust sheets were probably the principal processes of crustal accretion that was followed by some post-tectonic magmatism associated with mountain decay in east Africa and Arabia during the Neoproterozoic Era (e.g. Johnson et al. Reference Johnson, Andresen, Collins, Fowler, Fritz, Ghebrab, Kusky and Stern2011). The occurrence of several older (c. 810–700 Ma) ophiolitic sutures (e.g. Berhe, Reference Berhe1990; Ali et al. Reference Ali, Azer, Gahlan, Wilde, Samuel and Stern2010) across the ANS, including the Fawakhir ophiolite that hosts the FIC, is consistent with shield development on an oceanic crust by the juxtaposition of a series of island arcs (Abdel-Rahman, Reference Abdel-Rahman1995, Reference Abdel-Rahman1996; Blasband et al. Reference Blasband, White, Broijmans, De Boorder and Visser2000; Loizenbauer et al. Reference Loizenbauer, Walbrecher, Fritz, Neumayr, Khudeir and Kloetzli2001; Jarrar et al. Reference Jarrar, Stern, Saffarinai and Al-Zubi2003; Johnson & Woldehaimanot, Reference Johnson and Woldehaimanot2003; El-Sayed et al. Reference El-Sayed, Obeid, Furnes and Moghazi2004; Abdel-Rahman et al. Reference Abdel-Rahman, Polat, Dilek, Fryer, El-Sharkawy and Sakran2009; Johnson et al. Reference Johnson, Andresen, Collins, Fowler, Fritz, Ghebrab, Kusky and Stern2011; El-Bialy, Reference El-Bialy2013; Robinson et al. Reference Robinson, Foden, Collins and Payne2014, Reference Robinson, Foden and Collins2015; Elisha et al. Reference Elisha, Kylander-Clark and Katzir2017, Reference Elisha, Katzir, Kylander-Clark, Golan and Coble2019; Cox et al. Reference Cox, Foden and Collins2019; Eyal et al. Reference Eyal, Eyal, Litvinovsky, Jahn, Calvo and Golan2019).
The region encompassing the FIC hosts one of the few metamorphic domes exposed in eastern Egypt, known as the ‘Meatiq’ core complex. Several studies focusing on the structural, tectonic and metamorphic evolution of this Meatiq core complex have been carried out by a large number of authors (Hume, Reference Hume1934; Neubauer, Reference Neubauer1962; Schurmann, 1966; Akaad & Noweir, Reference Akaad and Noweir1969; Akaad & Shazly, Reference Akaad and Shazly1972, Reference Akaad and Shazly1975; El-Gaby, Reference El Gaby1976; El-Shazly & Essawy, Reference El-Shazly and Essawy1978; Habib et al. Reference Habib, Ahmed and El Nady1985; Greiling et al. Reference Greiling, Abdeen, Dardir, El Akhal, El Ramly, Kamal El Din, Osman, Rashwan, Rice and Sadek1994; Neumayr et al. Reference Neumayr, Mogessie, Hoinkes and Puhl1996, Reference Neumayr, Hoinkes, Puhl, Mogessie and Khudeir1998; El-Sayed et al. Reference El-Sayed, Furnes and Mohamed1999; Loizenbauer et al. Reference Loizenbauer, Walbrecher, Fritz, Neumayr, Khudeir and Kloetzli2001; Andresen et al. Reference Andresen, El-Rus, Myhre, Boghdady and Corfu2009, Reference Andresen, Augland, Boghdady, Lundmark, Elnady, Hassan and Abu El-Rus2010; Fritz et al. Reference Fritz, Loizenbauer and Wallbrecher2014). The Meatiq dome is made up of granitic orthogneiss occurring at the structurally lowest part, overlain by a dominant metasedimentary succession consisting of quartz-rich schists intercalated with metapelitic schists. The metasedimentary succession is tectonically overlain by Fawakhir ophiolitic nappes and island-arc volcanic rocks (e.g. El-Sayed et al. Reference El-Sayed, Furnes and Mohamed1999) that were obducted along low-angle thrust planes (El-Gaby et al. Reference El-Gaby, List, Tehrani and Said1990; Neumayr et al. Reference Neumayr, Mogessie, Hoinkes and Puhl1996; Loizenbauer et al. Reference Loizenbauer, Walbrecher, Fritz, Neumayr, Khudeir and Kloetzli2001).
The Meatiq rocks were described as variably cataclastic orthogneiss (granite gneisses) locally hosting amphibolite lenses, mylonites, phyllonites, augen schists and mylonitic amphibolites (Habib et al. Reference Habib, Ahmed and El Nady1985). Andresen et al. (Reference Andresen, Augland, Boghdady, Lundmark, Elnady, Hassan and Abu El-Rus2010) indicated that the core of the dome consists of coarse-grained, foliated orthogneisses (the Um Baanib orthogneiss), which structurally upwards become gradually more mylonitized and fine-grained, forming a garnet-bearing mylonitic carapace. The orthogneiss was considered by El-Ramly et al. (Reference El-Ramly, Greiling, Kröner and Rashwan1984) and Greiling et al. (Reference Greiling, Kröner, El Ramly, Kröner and Greiling1984) to represent variably deformed calc-alkaline juvenile igneous rocks associated with the EAO. Sturchio et al. (Reference Sturchio, Sultan and Batiza1983) proposed a protolith age of c. 626 Ma for the orthogneiss, whereas Loizenbauer et al. (Reference Loizenbauer, Walbrecher, Fritz, Neumayr, Khudeir and Kloetzli2001) interpreted it to be as old as 780–800 Ma, possibly involving even older material, and suggested that the gneiss-forming event occurred at c. 660–640 Ma. According to Fritz et al. (Reference Fritz, Wallbrecher, Khudeir, Abu El Ela and Dallmeyer1996), the updoming of the Meatiq basement is constrained by 40Ar/39Ar dating of micas at 595.9 ± 0.5 Ma. Andresen et al. (Reference Andresen, El-Rus, Myhre, Boghdady and Corfu2009) carried out a comprehensive geochronological study on the Meatiq metamorphic dome and surrounding metasedimentary and ophiolitic rock units; they considered the formation of this gneiss dome to be a young (631 Ma) structural feature formed as a result of NE–SW shortening contemporaneous with folding of the nearby Hammamat sediments at c. 605–600 Ma during oblique collision of East and West Gondwana. Andresen et al. (Reference Andresen, El-Rus, Myhre, Boghdady and Corfu2009) also included a sample from the FIC, which they referred to as “Abu Ziran syn-tectonic diorite”, considering it to have an age of 609.0 ± 1.0 Ma to 605.8 ± 0.9 Ma. A study on magmatic and solid state structures of these Abu Ziran rocks was carried out by Fritz et al. (Reference Fritz, Loizenbauer and Wallbrecher2014); they indicated that extensional shear was developed at c. 585 Ma, and that extension was accompanied by exhumation of the Meatiq dome, which took place soon after the solidification of the so-called ‘Abu Ziran’ granitic rocks. The Meatiq gneiss dome was intruded by a younger calc-alkaline granitic phase (the ‘Arieki’ granite) dated by Andresen et al. (Reference Andresen, El-Rus, Myhre, Boghdady and Corfu2009) at 590.5 ± 3 Ma.
Several investigations were carried out on the Fawakhir ophiolitic assemblage; it is considered to occur as tectonically dismembered sheets, blocks and fragments, and is represented by ultramafic serpentinites variably altered into talc-carbonates, metagabbros, massive but locally sheeted mafic dykes, and locally pillowed metabasalts (Akaad & Noweir, Reference Akaad and Noweir1969; Nasseef et al. Reference Nasseef, Bakor and Hashad1980; Church, Reference Church, El Gaby and Greiling1988; Abdel-Rahman et al. Reference Abdel-Rahman, Polat, Dilek, Fryer, El-Sharkawy and Sakran2009). These rock units were described as ophiolitic melange (e.g. Shackleton et al. Reference Shackleton, Ries, Graham and Fitches1980; Ries et al. Reference Ries, Shackleton, Graham and Fitches1983) embedded in the metasedimentary succession, were first dated at 813–777 Ma (Pb–Pb, zircon) by Loizenbauer et al. (Reference Loizenbauer, Walbrecher, Fritz, Neumayr, Khudeir and Kloetzli2001), and were interpreted to represent a segment of oceanic crust formed in a marginal (back-arc) basin, similar to the Wadi Ghadir ophiolite occurring further south (El-Gaby et al. Reference El-Gaby, List, Tehrani, El Gaby and Greiling1988; El-Sayed et al. Reference El-Sayed, Furnes and Mohamed1999). In contrast, Andresen et al. (Reference Andresen, El-Rus, Myhre, Boghdady and Corfu2009) implied that the Fawakhir ophiolite possibly formed in a fore-arc setting, and reported a (more realistic) U–Pb zircon thermal ionization mass spectrometry (TIMS) age of 736.5 ± 1.2 Ma. Abdel-Rahman et al. (Reference Abdel-Rahman, Polat, Dilek, Fryer, El-Sharkawy and Sakran2009) considered it to be a Penrose-type ophiolite sequence, indicating that its magmas appear to have been derived from a depleted (normal mid-ocean ridge basalt, or N-MORB, -like) mantle source. Despite the abovementioned in-depth structural, tectonic and metamorphic studies that were carried out on the various rock formations of the region encompassing the FIC, no detailed petrological-geochemical studies on the FIC are available in the literature.
2.b. Field relationships and megascopic appearance
The FIC occurs along the Qusair–Qena road, and is located some 70 km to the west of the Red Sea coastal city of Qusair at latitude 26° 00′ N, longitude 33° 50′ E. It forms low-lying, deeply eroded terrains, with its outcrops displaying highly irregular and relatively complex margins, and with tongues extending into the enclosing metasedimentary and metavolcanic units (Fig. 1). The exposures of this magmatic body extend to an overall length of about 30 km but with a highly variable width, estimated to be about 12 km on average. Due to the lack of vegetation and overburden, the FIC is well-exposed. Overall, it is made up essentially of monotonous greyish-white, medium- to coarse-grained, predominantly granodioritic rocks, showing non-porphyritic as well as porphyritic textures, but with a minor quartz-monzodioritic variety occurring further east within this intrusion. Mineralogical and textural variations between granodiorites and the much less abundant quartz-monzodioritic variety are gradational, and essentially related to differences in the proportion of mafic minerals. Parts of the FIC exhibit weak magmatic-flow textures represented by the alignment of some hornblende, biotite and/or idiomorphic plagioclase crystals. Late aplitic dykes derived from the FIC magma, as well as some rare quartz veins, are occasionally present in this complex. In general, the overall textural and mineralogical primary magmatic features of the FIC are well-preserved.
The FIC was essentially intruded between ophiolitic melange embedded in a metasedimentary succession consisting of low (greenschist) grade metamorphosed volcano-sedimentary sequences and Fawakhir ophiolitic lithologies (736 Ma; Andresen et al. Reference Andresen, El-Rus, Myhre, Boghdady and Corfu2009) to the south, and high-grade orthogneiss (631 Ma; Andresen et al. Reference Andresen, El-Rus, Myhre, Boghdady and Corfu2009) mantled by dominantly mylonitic metasediments, consisting of quartz-rich schists intercalated with metapelitic schists, forming the Meatiq gneiss dome to the north (Fig. 1). Thus, the FIC was emplaced at the southern periphery of this Meatiq dome and cross-cuts right into its centre, but at its southern margin it intruded the serpentinite and/or metagabbro ophiolitic assemblage, as well as the metasedimentary succession.
Field relationships reflect that the FIC exhibits both faulted contacts, as well as discordant irregular contacts with its host rocks, with some mafic xenoliths (from host rocks) occurring within this intrusion near its northern margin. Furthermore, the emplacement of the FIC caused contact metamorphism along its southern as well as northern margins, with a very narrow thermal aureole developed at its northern contact with the relatively high-grade host rocks of the Meatiq dome, and a relatively wider thermal aureole developed within the lower-grade metasedimentary succession in the south. The FIC and its host rocks are dissected by several NW-trending and ENE-trending faults. A total of 14 rock samples were collected across this magmatic complex, covering its entire length of about 30 km from west to east with its variable width and irregularly shaped boundaries.
3. Petrography
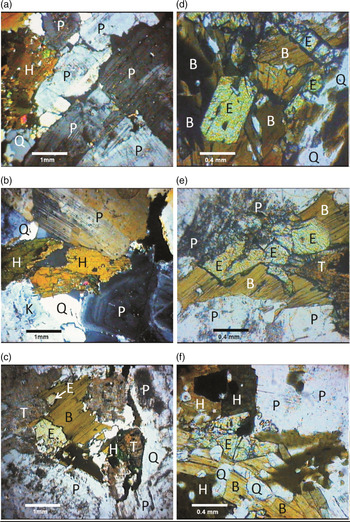
The FIC contains medium- to coarse-grained, equigranular to inequigranular rocks (Fig. 2), having both a non-porphyritic as well as a porphyritic variety. In the latter variety, plagioclase is the main phenocryst phase. As shown in Figure 2, the rocks consist of variable contents of plagioclase (37–52 vol%), quartz (18–29 vol%), K-feldspar (8–21 vol%), amphibole (2–25 vol%), biotite (2–16 vol%), epidote (1–4 vol%), muscovite (0–4 vol%) and opaque Fe–Ti oxides (2 vol%), and traces of accessory titanite, apatite, zircon and rare allanite. Plagioclase forms predominantly large idiomorphic grains (Fig. 2a–c), occasionally showing hypidiomorphic overgrowth features; it is rarely zoned, and exhibits Albite-, Carlsbad- and complex twinning. The K-feldspar is a relatively less abundant phase forming allotriomorphic perthitic grains. Amphibole is commonly pleochroic (yellowish beige to bluish green; Fig. 2a, b), forming idiomorphic to hypidiomorphic large grains, occasionally showing simple twinning and containing inclusions of quartz, titanite, magnetite and apatite. Biotite forms idiomorphic to hypidiomorphic grains (Fig. 2c–f) and exhibits greenish, beige and reddish-brown colours. Muscovite occurs in some of the more felsic lithologies and represents a minor constituent of these rocks. Epidote is present in most of the FIC samples (Fig. 2c–f), occurring predominantly as idiomorphic crystals, and also in the form of allotriomorphic rounded grains. Titanite is an abundant accessory phase that forms wedge-shaped to rectangular as well as allotriomorphic grains (Fig. 2c, e). Zircon and apatite are somewhat less common, and occur as tiny crystals. Allanite is rarely present within some epidote grains. Opaque phases are represented by magnetite and ilmenite. Most samples are generally fresh, with only a few samples showing minor alteration of some plagioclase grains to kaolinite or sericite and some amphibole and/or biotite to secondary chlorite. Signs of rock–fluid interaction at the post-magmatic or subsolidus stage are therefore rare.
Photomicrographs showing textures and mineralogical constituents of rocks of the FIC, as well as various features of magmatic epidote occurring in association with various mineral phases. (a–c) Abundant idiomorphic prismatic plagioclase crystals with allotriomorphic to hypidiomorphic quartz, K-feldspar, hornblende and biotite occupying the interstitial space, thus forming equigranular to inequigranular mosaic in various samples (F-26 (a) and F-25 (b) under cross-polarized light, with F-27 (c) under plane-polarized light). Photomicrograph (c), in particular, shows an abundance of the accessory phase titanite, and some idiomorphic epidote grains armouring around pristine biotite and displaying predominantly sharp euhedral contacts against it. (d) Well-developed monoclinic epidote crystals, showing sharp idiomorphic contacts with biotite (sample F-26; plane-polarized light). (e) Several blocky idiomorphic epidote grains showing sharp euhedral contacts with biotite, but embayed against plagioclase; accessory titanite is also present (sample F-27; plane-polarized light). (f) Cross-section of idiomorphic epidote crystal intergrown with quartz and in sharp contact with biotite, but embayed against both hornblende and plagioclase (sample F-26; plane-polarized light). Note the predominantly fresh appearance and unaltered nature of the various mineral phases present in all photomicrographs. P – plagioclase; Q – quartz; K – K-feldspar; B – biotite; H – hornblende; E – epidote; T – titanite.

Magmatic epidote has been reported in a number of igneous complexes (e.g. Evans & Vance, Reference Evans and Vance1987; Farrow & Barr, Reference Farrow and Barr1992; Franz & Smelik, Reference Franz and Smelik1995; Barr et al. Reference Barr, White and Culshaw2001; Dahlquist, Reference Dahlquist2001; Popov et al. Reference Popov, Nikiforova and Bogatov2001; Bédard, Reference Bédard2003; Bea et al. Reference Bea, Abu-Anbar, Montero, Peres and Talavera2009; Abdel-Rahman, Reference Abdel-Rahman2016; Cox et al. Reference Cox, Foden and Collins2019). As indicated above, most samples of the FIC contain epidote, occurring as high-relief, weakly pleochroic, greenish-yellow, idiomorphic grains, commonly having patchy colour distribution (Fig. 2c–f). Epidote varies from 1 to 4 vol% of the rock. Many idiomorphic epidote grains exhibit well-developed crystals showing typical monoclinic crystal forms (Fig. 2d). It predominantly shows sharp euhedral contacts against biotite (Fig. 2c–f), but exhibits embayed to myrmekitic grain boundaries when in contact with feldspars and quartz (Fig. 2e, f). Epidote intergrown with quartz within resorption textures growing into the amphibole is also present. Textural features of the FIC epidote reported here (Fig. 2) are similar to those interpreted by Zen & Hammarstorm (Reference Zen and Hammarstorm1984) and Schmidt & Poli (2004) to represent features typical of magmatic epidote. Thus, epidote present in the FIC is inferred to be of igneous origin. The fresh appearance of plagioclase and the lack of biotite or amphibole alternation in rocks of the FIC further support this inference. Magmatic epidote reported in this study represents a somewhat rare occurrence within the vast ANS. In fact, only a few occurrences of magmatic epidote within this shield have previously been reported. In their study on Mount Moneiga quartz-dioritic pluton (844 Ma) in southern Sinai, Bea et al. (Reference Bea, Abu-Anbar, Montero, Peres and Talavera2009) reported the presence of some magnetite-plagioclase aggregates having a core of epidote that “seems to be of magmatic origin”. Abdel-Rahman (Reference Abdel-Rahman2016) documented the presence of magmatic epidote in the TTG suite of the Mons Claudianus batholith (664 Ma) of eastern Egypt. Cox et al. (Reference Cox, Foden and Collins2019) reported magmatic epidote in adakites from the eastern part of the ANS. It should be noted that only a few studies have been carried out on adakites occurring within the ANS (e.g. Eliwa et al. Reference Eliwa, Kimura and Itaya2006; Cox et al. Reference Cox, Foden and Collins2019). Using the proportions of their mineralogical constituents (quartz, alkali-feldspar, plagioclase) on the IUGS classification diagram of Le Bas & Streckeisen (Reference Le Bas and Streckeisen1991), 11 rock samples of the FIC plot in the field of granodiorite and only 3 (F-25, F-26 and F-32) plot in the quartz-monzodiorite field (Fig. 3).
The IUGS classification diagram (after Le Bas & Streckeisen Reference Le Bas and Streckeisen1991) for rocks of the Fannani Igneous Complex (FIC); all data points plot in the fields of granodiorite and quartz-monzodiorite.

4. Analytical methods
4.a. Geochemistry: major elements
Chemical data have been obtained on 14 representative samples from the FIC. Concentrations of the major elements were determined on whole-rock powders fused with lithium-metaborate in discs by X-ray fluorescence spectrometry (Phillips PW1400 Spectrometer model 691, at McGill University) using a Rh tube operated at 40 kV and 70 mA. Loss on ignition (LOI) was determined by heating powdered samples for 50 minutes at 1000°C.
4.b. Trace elements
Concentrations of trace elements including V, Ni, Rb, Sr, Ba, Zr, Nb, Y, Ga, Th and U for the same 14 whole-rock samples were determined on pressed pellets by X-ray fluorescence (operating conditions: Rh radiation, 70 kV, 40 mA). The analytical precision, as calculated from 20 replicate analyses of one sample, is better than 1% for most major elements and better than 5% for most trace elements. The detection limit for the trace elements analysed is 1 ppm.
4.c. Rare earth elements, hafnium and tantalum
Hafnium, tantalum and 14 rare earth elements (REEs) were analysed for five representative samples from the FIC. The concentrations of these elements were determined by inductively coupled plasma mass spectrometry (ICP-MS) at the Activation Laboratories (Ontario, Canada). Solutions of fused samples are spiked with three internal standards to cover the entire mass range. These are further diluted and are introduced into a Perkin Elmer-SCIEX Elan 6000 ICP-MS using a proprietary sample introduction methodology. The primitive mantle values used for normalization are those of Sun & McDonough (Reference Sun, McDonough, Saunders and Norry1989).
4.d. Radiogenic isotope ratios
4.d.1. U–Pb zircon (TIMS) analysis
An absolute age for the FIC was determined on a pristine rock sample (F-27) using the U–Pb zircon TIMS method. Zircon grains were separated from the sample, and the grains were treated before the analysis. In order to overcome the effects of radioactive-decay-induced crystal defects and associated lead loss resulting in discordant analyses, zircon grains are pre-treated by the method of thermal annealing and chemical leaching (Mattinson, Reference Mattinson2005). This method involves heating of the zircon inside a furnace at 900°C for 60 hours. The annealed grains selected for analysis were subsequently loaded into fluorinated ethylene propylene (FEP) Teflon microcapsules and leached in concentrated hydrofluoric acid (HF) at 180°C within high-pressure vessels for 12 hours. The partially dissolved sample is then transferred into Savillex FEP breakers for rinsing. The leached material is decanted with several millilitres of ultra-pure water and by fluxing successively with 4 N HNO3 and 6 N HCl on a hot plate and/or in an ultrasonic bath. After final rinsing with ultra-pure water, zircon grains are loaded back into microcapsules, spiked with mixed 205Pb–233U–235U tracer solution and dissolved completely in concentrated HF at 220°C for 48–60 hours. Essentially, the high-U parts of the zircon crystals that are associated with Pb loss are preferentially removed, leaving a residue of relatively low-U content. Isotope compositions were measured on the VG Sector 54 multi-collector TIMS at the Activation Laboratories (Ontario, Canada). The measured isotopic ratios were corrected for mass-dependent isotope fractionation in the mass spectrometer, as well as for U and Pb contributions from the spike, laboratory blanks and initial Pb in the sample. Common-Pb corrections were calculated by using the model of Stacey & Kramers (Reference Stacey and Kramers1975) and the interpreted age of the sample. All common Pb in the analyses was assigned to procedural blank with a measured composition of 206Pb/204Pb = 18.31 ± 0.53, 207Pb/204Pb = 15.38 ± 0.35, 208Pb/204Pb = 37.45 ± 1.1 (2σ); total procedural blanks were < 0.5 pg for Pb and < 0.1 pg for U. It should be noted that the ID TIMS method was used for analysis and isotopic measurements were made against a calibrated isotopic tracer, with precisely determined concentrations and isotopic compositions as given in Condon et al. (Reference Condon, Schoene, McLean, Bowring and Parrish2015) and McLean et al. (Reference McLean, Condon, Schoene and Bowring2015). Age calculations are based on the decay constants of Steiger & Jäger (Reference Steiger and Jäger1977).
4.d.2. Sm–Nd isotope analysis
Five representative whole-rock samples from the FIC have been used for the Sm–Nd isotopic analysis carried out at the Activation Laboratories (Ontario, Canada). Rock powders of these samples were dissolved in a mixture of HF, HNO3 and HClO4. Before the decomposition, the samples were totally spiked with 149Sm–146Nd mixed solution. The REEs were separated using conventional cation-exchange techniques. Both Sm and Nd were separated by extraction chromatography on HDEHP-covered Teflon powder. The various Sm–Nd isotopic ratios were measured using a Triton-MC mass spectrometer. Accuracy of the measurements of Sm and Nd contents were ±0.5%, and for 147Sm/144Nd ±0.5% (2σ). The various 143Nd/144Nd ratios measured for rocks of the FIC are relative to the value of 0.511860 of the La Jolla Nd standard.
4.d.3. Rb–Sr isotope analysis
For the Rb–Sr isotopic analysis, five whole-rock samples were dissolved in a mixture of HF, HNO3 and HClO4. Before the decomposition, the samples were totally spiked with 85Rb–84Sr mixed solution. Rb and Sr were separated using conventional cation-exchange techniques. Total blank are 0.01–0.05 ng for Rb and 0.3–0.7 ng for Sr. The various Rb–Sr isotopic ratios were measured using a Triton-MC mass spectrometer. The accuracy of the measurements of Rb and Sr contents were ±0.5% and for 87Rb/86Sr ±1.0% (2σ). The Sr isotopic ratios were normalized to the 88Sr/86Sr ratio of 8.37521.
5. Analytical results
5.a. Major- and trace-element geochemistry
Chemical data for 14 representative whole-rock samples from the FIC, expressed as major-element oxides (in wt%) and trace elements (in ppm) are given in Table 1. The concentrations of the rare earth elements (REEs) as well as Hf and Ta (in ppm) are listed in Table 2. Also given in Tables 1 and 2 are averages of Proterozoic TTG compositions from various regions worldwide, as compiled by Condie (Reference Condie2005). The chemical data show that rocks of the FIC span a wide range of compositions including SiO2 (58.3–73.8 wt%), Al2O3 (13.5–18.6 wt%), CaO (0.92–5.2 wt%), Sr (88–1239 ppm), Rb (36–109 ppm) and Ba (251–929 ppm) (Tables 1, 2; Fig. 4). The rocks contain relatively low concentrations of MgO (average, 1.2 wt%) and TiO2 (0.6 wt%), and low concentrations of high-field-strength elements (HFSEs) such as Nb (average, 14 ppm), Hf (6.1 ppm) and Ta (1.1 ppm), but are moderately enriched in Zr (250 ppm). Overall, depletion in Mg, Ti, Nb, Ta, Hf and the HREEs is a noticeable feature in the FIC rocks (Tables 1, 2).
Major- and trace-element composition (in wt% and ppm, respectively) of representative TTG samples from the Fannani Igneous Complex (Egypt). Fe2O3* is total iron expressed as Fe2O3. Rock types based on the IUGS classification are granodiorite (GRD) and quartz monzodiorite (QMD)

Rare earth element composition (in ppm) of representative TTG samples from the Fannani Igneous Complex (Egypt). Rock types based on the IUGS classification are granodiorite (GRD) and quartz monzodiorite (QMD)

Variations of selected major and trace elements versus silica for rocks of the Fannani complex. Most data points show linear well-defined trends (with some limited scatter), suggesting a continuous process of evolution via internal differentiation.

On Harker-type diagrams, variations of silica versus some major- and trace-elements produce linear trends showing gradual decrease in Al2O3, CaO, Fe2O3 (as total iron), TiO2, Sr and Ga with increasing silica contents, but with the alkalis and Y showing a slight positive correlation (Fig. 4). This is consistent with a sequence of crystallization (as deduced from textural observations) characterized by early formation of plagioclase (Fig. 2a, b), which also dominated the phenocryst phases in porphyritic varieties, followed by hornblende. The generally well-defined trends, with only limited scatter of data points, suggest a continuous process of evolution via internal differentiation. As indicated in the petrography section (Section 3), using the mineralogical constituents (quartz, albite, K-feldspar) in the IUGS classification diagram of Le Bas & Streckeisen (Reference Le Bas and Streckeisen1991), rocks of the FIC plot largely in the fields of granodiorite (11 samples), with only three samples classified as quartz-monzodiorite (Fig. 3). Data points of the FIC occupy the fields of tonalite, trondhjemite granodiorite and granite (TTG; Fig. 5a) of O’Connor (Reference O’Connor1965) and Barker (Reference Barker and Barker1979). The rocks also plot within or around the field of quartz-diorite and continental trondhjemite (Fig. 5b), that is, distinct from the ophiolite-related oceanic plagiogranite field delineated by Coleman & Peterman (Reference Coleman and Peterman1975). In addition, most elemental averages of the investigated rocks (Tables 1, 2) compare rather well with averages of Proterozoic TTGs from various regions (reported in Condie, Reference Condie2005). Elemental ratios of the FIC rocks are also somewhat similar to those of Proterozoic TTGs, which exhibit averages of K2O/Na2O = 0.56 (it is 0.61 in the FIC), Sr/Y = 37 (27 in the FIC) and Nb/Ta = 9.9 (11.8 in the FIC).
(a) Normative An–Ab–Or classification diagram for the FIC, showing that it is made up of tonalite–trondhjemite–granodiorite (TTG) lithologies; fields are after O’Connor (Reference O’Connor1965) and Barker (Reference Barker and Barker1979). (b) The Rb versus Sr variation diagram indicating that the FIC rocks plot within or near the field of quartz-diorite and continental trondhjemite, and are clearly distinct from oceanic plagiogranites (fields are after Coleman & Peterman, Reference Coleman and Peterman1975).

Many authors, including Barker et al. (Reference Barker, Peterman and Friedman1976), Barker & Arth (Reference Barker and Arth1976), Barker (Reference Barker and Barker1979) and Defant & Drummond (Reference Defant and Drummond1990), have distinguished between a low-Al TTG-type (having < 15 wt% Al2O3 at 70 wt% SiO2, < 200 ppm Sr, slightly enriched LREE, flat HREE with a negative Eu-anomaly) and a high-Al type (having Al2O3 contents > 15 wt% at 70 wt% SiO2, high Sr > 300 ppm, low Yb < 1.8 ppm, low Nb < 11 ppm, low to moderate K/Rb ratios < 750, enriched LREEs, depleted HREEs, and have no, or only a slight, Eu anomaly). Rocks of the FIC do exhibit these chemical signatures, including high Al2O3 contents of 16.6 wt% at 70 wt% silica, thus representing a high-alumina TTG suite.
As shown in Figure 6a, all rock samples of the FIC are peraluminous in nature, with the exception of only one metaluminous sample. Overall, the FIC rocks are subsolvus (as revealed by their two feldspar mineralogy), having typical calc-alkaline affinities (Fig. 6b), and exhibit characteristic features of ‘I-type’ suites. Furthermore, the K/Rb versus Rb/Sr diagram (Fig. 7a) shows that the FIC rocks occupy the field of ‘orogenic’ complexes of Abdel-Rahman & El-Kibbi (Reference Abdel-Rahman and El-Kibbi2001), and the (Y + Nb) versus Rb diagram (Fig. 7b) indicates that these rocks are typical of ‘volcanic-arc granites’ of Pearce et al. (Reference Pearce, Harris and Tindle1984). On various inter-element variation diagrams, such as Rb/Sr versus both Rb/Zr and Sr (Fig. 8a, b), and Rb/Y versus Nb/Y (Fig. 8c), data points of the FIC show, despite some scatter, generally smooth covariations with linear trends, suggesting that internal differentiation produced the more-evolved lithologies of the investigated TTG suite.
(a) Molecular Al2O3/(CaO + Na2O + K2O) versus molecular Al2O3/(Na2O + K2O) (or molar A/CNK versus A/NK) variation diagram showing that the Fannani rocks are predominantly peraluminous in nature. (b) A–F–M diagram showing that lithologies of the Fannani complex exhibit a well-defined calc-alkaline trend.

(a) K/Rb versus Rb/Sr diagram showing that all data points of the FIC exhibit very low (< 0.6) Rb/Sr ratios, characteristic of orogenic complexes. The boundary (marked by the dashed line at Rb/Sr = 1) separating the fields of orogenic and anorogenic granites is after Abdel-Rahman & El-Kibbi (Reference Abdel-Rahman and El-Kibbi2001). The fields of the anorogenic peralkaline granites of the Amis complex of Namibia, of the Sibae complex and the Kharif-Dob complex of eastern Egypt are after Schmitt et al. (Reference Schmitt, Emmermann, Trumbull, BuÈhn and Henjes-Kunst2000), Abdel-Rahman & El-Kibbi (Reference Abdel-Rahman and El-Kibbi2001) and Abdel-Rahman (Reference Abdel-Rahman2006), respectively. The fields of the orogenic Andean granites and the Pan-African calc-alkaline granites are after Atherton et al. (Reference Atherton, McCourt, Sanderson, Taylor, Atherton and Tarney1979) and Abdel-Rahman & Martin (Reference Abdel-Rahman and Martin1987), respectively. (b) Rb versus (Y + Nb) diagram showing that the FIC rocks plot in the field of volcanic-arc granites (VAG). Other fields are collisional granites (COLG), within-plate granites (WPG) and oceanic-ridge granites (ORG), and are after Pearce et al. (Reference Pearce, Harris and Tindle1984).

Inter-element variation diagrams of (a) Rb/Sr versus Rb/Zr, (b) Rb/Sr versus Sr and (c) Rb/Y versus Nb/Y for the FIC rocks (see text for details).

5.b. Rare earth elements, hafnium and tantalum
Concentrations of the REEs as well as Ta and Hf in the FIC rocks are given in Table 2; these rocks exhibit moderate REE values (∑REE = 123 ppm, on average). The rocks are LREE enriched over HREE, as the latter show marked depletion (e.g. Yb = 1.55 ppm, on average), and this seems to be a characteristic feature for most TTG rocks in general (having Yb < 1.8 ppm). The primitive-mantle normalized REE patterns (Fig. 9a) are parallel to sub-parallel, moderately fractionated (mean (La/Yb)N = 12.8)), and exhibit notable non-fractionated or flat HREEs. The REE profiles show no, or insignificant, Eu anomalies (Fig. 9a). Lack of Eu anomaly is consistent with the early crystallization of Na-rich plagioclase and its relative abundance in the FIC rocks (Fig. 2a, b). As noted by Drummond & Defant (Reference Drummond and Defant1990), the lack of Eu anomaly appears to be a universal feature for high-Al TTGs. Rocks of the FIC exhibit low contents of Ta and Hf, with values ranging from 0.28 to 2.1 ppm and from 3.0 to 9.2 ppm, respectively. These values, along with the concentrations of the REEs, are comparable to those of Neoproterozoic TTG averages (Table 2). Overall features of some trace elements and REEs are summarized in a primitive-mantle-normalized spidergram for the FIC (Fig. 9b). The normalized multi-element profiles show moderate enrichment in some incompatible elements, and some depletion in HREEs and Nb; the profiles exhibit pronounced negative Nb anomaly, which is a typical feature of high-alumina TTG rocks.
(a) Primitive-mantle-normalized REE patterns of representative samples from the FIC, showing profiles that lack Eu anomalies and exhibit non-fractionated or flat HREEs. (b) Primitive-mantle-normalized multi-element profiles (or spidergram), showing marked depletion in Nb and Sr. Normalization values are taken from Sun & McDonough (Reference Sun, McDonough, Saunders and Norry1989).

Halla et al. (Reference Halla, van Hunen, Heilimo and Hölttä2009) subdivided TTG rocks into two groups (low-HREE and high-HREE), with the former characterized by low Mg, high Al, high Sr, high Nb/Ta ratio, low Yb and low HREE. The chemical composition of the FIC (with its marked HREE depletion and averages of MgO = 1.23 wt%, Al2O3 = 15.6 wt%, Sr = 479 ppm, Yb = 1.55 ppm, Nb/Ta = 11.8) indicate that it belongs to the low-HREE TTG group of Halla et al. (Reference Halla, van Hunen, Heilimo and Hölttä2009). The later authors suggested that chemical traits of the low-HREE group of TTGs generally indicate high-pressure melting conditions. Halla et al. (Reference Halla, van Hunen, Heilimo and Hölttä2009) concluded that melting in the lower part of a thick basaltic oceanic crust could produce TTGs of the low-HREE type.
5.c. Age of crystallization and isotopic characteristics
5.c.1. U–Pb zircon radiometric isotopes
The TIMS method was used for the U–Pb zircon radiometric age dating of the FIC; analytical results are given in Table 3, with uncertainties quoted at the 2σ level. The three zircon fractions used for analysis are composed of single grains, and the zircon crystals are all colourless, transparent elongate prisms with well-formed tetragonal dipyramidal terminations. The data are plotted on a Concordia diagram (Fig. 10a). The three zircon grains analysed (Z-1, Z-3 and Z-5) are very slightly discordant and produced 206Pb/238U TIMS ages of 607.5 ± 1.21 Ma, 607.4 ± 0.53 Ma and 607.4 ± 1.44 Ma, respectively (Table 3). A precise 206Pb/238U mean age of 607.4 ± 1.95 Ma (mean square weighted deviation or MSWD = 0.038) has been obtained on these three zircon grains (Fig. 10a; Table 3), and is considered the age of crystallization of the FIC. The very slightly discordant ages obtained on the zircon grains analysed probably reflect some minor Pb-loss, rather than the time of magma emplacement. An earlier geochronological investigation on rocks that host the FIC (the Meatiq orthogneiss and surrounding rock formations) was carried out by Andresen et al. (Reference Andresen, El-Rus, Myhre, Boghdady and Corfu2009). Their work included a rock sample from the Fannani TTG suite (which they referred to as syn-tectonic diorite), and obtained U–Pb zircon crystallization ages of 609.0 ± 1.0 Ma and 605.8 ± 0.9 Ma. The age determined in the present study (607.4 ± 1.95 Ma) is nearly identical to the middle of the age range obtained by those authors.
Results of U–Pb isotopic analysis (TIMS method) of zircon from the FIC (Egypt) for sample F-27

a Zircon fractions are composed of single grains that are thermally annealed and pre-treated.
b Total weight of common Pb in analyses.
c Measured ratio corrected for spike and fractionation only.
d Radiogenic Pb.
e Corrected for fractionation, spike, blank and initial common Pb.
f Errors are 2-sigma.
g Age calculations are based on the decay constants of Steiger & Jäger (Reference Steiger and Jäger1977).
h Error in the dates reported at 2 sigma.
Mass fractionation correction of 0.25%/amu ± 0.04%/amu (atomic mass unit) was applied to single-collector daily analyses.
Total procedural blank < 0.5 pg for Pb and < 0.1 pg for U.
Blank isotopic composition: 206Pb/204Pb = 18.31 ± 0.53, 207Pb/204Pb = 15.38 ± 0.35, 208Pb/204Pb = 37.45 ± 1.1.
Common-Pb corrections were calculated using the model of Stacey & Kramers (Reference Stacey and Kramers1975) and the interpreted age of the sample.
(a) U–Pb concordia diagram for the FIC. Raw data are given in Table 3 (see text for details). (b) Initial Sr ratios (87Sr/86Sr(i)) versus ϵNd(t) diagram for representative TTG rocks of the FIC (squares). These initial Sr ratios and ϵNd(t) values have been recalculated to the FIC crystallization age (607.4 Ma) and are given in Table 4. Also plotted in this diagram are some general ranges of values of several types of rock suites from selected tectonic settings: MORB, Japan arc, Lesser Antilles, Sunda Arc, Banda Arc and Sierra Nevada batholith (California). Data for these suites are taken from Faure (Reference Faure1986).

It should be noted that TTGs of ages within the Ediacaran period (c. 635–541 Ma), such as that of the FIC, are extremely rare in Earth; the FIC example provided here indicates further that TTGs are not strictly an Archean phenomenon, but rather extend to much younger geological times. In fact, Archean and Early Proterozoic cratons occurring within various continents worldwide are dominated by TTG lithologies; their presence in Neoproterozoic shields is uncommon, however, which adds to the significance of this study in contributing to knowledge of Neoproterozoic crustal development. Furthermore, the presence of such a young TTG suite (607.4 Ma) has significant implications for the understanding of shield evolution within the northern-most segment of the ANS, in the context of Ediacaran geodynamic regime and the regional tectonic framework along the EAO (see Discussion, Section 6).
5.c.2. Sm–Nd and Rb–Sr whole-rock isotopic characteristics
Analytical results of neodymium and strontium isotopes of five representative whole-rock samples from the FIC are given in Table 4. Reported also in Table 4 are the initial isotopic ratios and epsilon values for both Nd and Sr. These initial isotopic ratios (143Nd/144Nd)(i) and (87Sr/86Sr)(i), as well as values of ϵNd(t) and ϵSr(t) for the FIC, have been recalculated to the age of its magma emplacement (607.4 Ma) determined in this study. The decay constants used for these recalculations are those recommended by the IUGS: 147Sm/143Nd = 6.54×10⁻¹² a−1 (Lugmair & Marti, Reference Lugmair and Marti1978) and 87Rb/87Sr = 1.42×10⁻¹¹ a−1 (Steiger & Jäger, Reference Steiger and Jäger1977). The values of ϵNd(t) and of ϵSr(t) for the analysed FIC samples are recalculated relative to CHUR with present-day 147Sm/144Nd = 0.1967, 143Nd/144Nd = 0.512638 and with present-day 87Rb/86Sr = 0.0736, 87Sr/86Sr = 0.70391 (Allégre et al. Reference Allégre, Hart and Minster1983; Faure, Reference Faure1986).
Results of Nd and Sr isotopic analyses of representative TTG samples from the Fannani Igneous Complex (Egypt). Initial isotopic values (ϵNd(t), ϵSr(t)) are recalculated relative to CHUR with present-day 147Sm/144Nd = 0.1967, 143Nd/144Nd = 0.512638, 87Rb/86Sr = 0.0736 and 87Sr/86Sr = 0.70391 (Allégre et al. Reference Allégre, Hart and Minster1983; Faure, Reference Faure1986). These values, along with initial ratios (143Nd/144Nd(i), 87Sr/86Sr(i)), have been recalculated to the FIC crystallization age (607.4 Ma) determined in this study. Decay constants used for these recalculations (recommended by the IUGS) are: 87Rb/87Sr = 1.42×10⁻¹¹ a–1 (Steiger & Jäger, Reference Steiger and Jäger1977) and 147Sm/143Nd = 6.54×10⁻¹² a–1 (Lugmair & Marti, Reference Lugmair and Marti1978)

The Fannani rocks exhibit measured 143Nd/144Nd isotopic compositions ranging from 0.512536 to 0.512696, with age-corrected ϵNd(t) values ranging from +5.12 to +7.16. Such high positive initial ϵNd(t) values reflect Pan-African juvenile (mantle-derived) magmatism. The FIC rocks also exhibit measured 87Sr/86Sr isotopic compositions ranging from 0.703464 to 0.710911, with age-corrected 87Sr/86Sr(i) ratios ranging from 0.70263 to 0.70283 (Table 4). The regression line deduced from whole-rock Rb–Sr isotopic data yields an initial 87Sr/86Sr ratio of 0.70284 ± 0.00024 for the FIC rocks. As shown in the 87Sr/86Sr(i) versus ϵNd(t) standard diagram (Fig. 10b), the isotopic compositions of the FIC do fall along the mantle array and are clustered within the field of ocean-arc basalts of the Japan-arc, near the MORB field. The Nd–Sr isotopic data of the FIC are therefore similar to those of ocean-arc mafic lavas. This, along with the low initial 87Sr/86Sr ratio (0.70284), is suggestive of a mantle-derived source with no or only insignificant contribution from an older continental component (see petrogenesis in Section 6.c).
6. Discussion
6.a. Tectonic implications for the FIC: did active oceanic subduction extend beyond 620 Ma?
It is well-established that the ANS is composed of a series of juvenile island-arc terranes and developed as a result of the Mozambique Ocean closure (leading to the assembly of Gondwana at c. 850–540 Ma; Meert & Torsvik, Reference Meert and Torsvik2003; Tohver et al. Reference Tohver, D’Agrella and Trindade2006) during a long period of island-arc and microcontinent accretion (e.g. Johnson et al. Reference Johnson, Andresen, Collins, Fowler, Fritz, Ghebrab, Kusky and Stern2011; Fritz et al. Reference Fritz, Abdelsalam, Ali, Bingen, Collins, Fowler, Ghebreab, Hauzenberger, Johnson, Kusky, Macey, Muhongo, Stern and Viola2013; Robinson et al. Reference Robinson, Foden, Collins and Payne2014, Reference Robinson, Foden and Collins2015). Under question is the timing of cessation of the oceanic-arc late orogenic phase of the EAO and the initiation of a post-collisional and/or extensional regime in northern ANS. While some authors claim that oceanic-arc tectonomagmatic regimes continued to be active until c. 650–620 Ma, after which time post-collisional magmatism began, others suggested that subduction orogenic activities and associated arc-magmatism extended beyond 620 Ma. Studies supporting the view that cessation of the oceanic-arc regime occurred at c. 620 Ma include those of Eyal et al. (Reference Eyal, Litvinovsky, Jahn, Zanvilevich and Katzir2010, Reference Eyal, Be’eri-Shlevin, Eyal, Whitehouse and Litvinovsky2014, Reference Eyal, Eyal, Litvinovsky, Jahn, Calvo and Golan2019), Be’eri-Shlevin et al. (Reference Be’eri-Shlevin, Samuel, Azer, Ramo, Whitehouse and Moussa2011), Fritz et al. (Reference Fritz, Abdelsalam, Ali, Bingen, Collins, Fowler, Ghebreab, Hauzenberger, Johnson, Kusky, Macey, Muhongo, Stern and Viola2013), Jarrar et al. (Reference Jarrar, Theye, Yaseen, Whitehouse, Pease and Passchier2013) and Elisha et al. (Reference Elisha, Kylander-Clark and Katzir2017, Reference Elisha, Katzir, Kylander-Clark, Golan and Coble2019). In contrast, a number of other investigations indicated that active subduction extended beyond 620 Ma (Bentor, Reference Bentor1985; Vail, Reference Vail1990; Küster & Harms, Reference Küster and Harms1998; Reference Teklay, Berhe, Reimold, Armstrong, Asmerom and WatsonTeklay et al. 2002a ; Doebrich et al. Reference Doebrich, Al-Jehani, Siddiqui, Hayes, Wooden and Johnson2007; Bea et al. Reference Bea, Abu-Anbar, Montero, Peres and Talavera2009; Andresen et al. Reference Andresen, Augland, Boghdady, Lundmark, Elnady, Hassan and Abu El-Rus2010; Johnson et al. Reference Johnson, Andresen, Collins, Fowler, Fritz, Ghebrab, Kusky and Stern2011; Abu El–Enen & Whitehouse, 2013; Fritz et al. Reference Fritz, Loizenbauer and Wallbrecher2014; Robinson et al. Reference Robinson, Foden, Collins and Payne2014). The later authors stated that the final stages of Gondwana assembly (c. 570–530 Ma) are recorded in the northern EAO and are split into two orogenic episodes. The results of this study represent significant contributions to this highly debatable issue, as explained in the following.
6.a.1. Tectonomagmatic implications of the TTG suite of the FIC
It is very clear that the timing of the cessation of subduction and initiation of a post-collisional and/or extensional regime in northern ANS is far from certain. The discovery of this rare Ediacaran TTG suite of the FIC can be used to shed light on this controversial issue. Results of this study show that the high-Al TTG rocks of the FIC form a typical I-type subsolvus suite, of clearly orogenic calc-alkaline affinities with its data points falling exclusively in the field of volcanic-arc granites (Figs 6, 7), and exhibits traits typical of those of I-type, arc-related magmatism. Moreover, the low initial 87Sr/86Sr ratio (0.70284) of the FIC, its ϵNd(t) values (+5.12 to +7.16) that fall along the mantle array within the field of Japan-arc basalts (Fig. 10b) and are suggestive of a juvenile magma, along with the progression from intermediate to felsic calc-alkaline lithologies (SiO2 range of 58–74 wt%), are all consistent with an arc setting. The Neoproterozoic island-arc terranes of NE Africa, encompassing several ophiolitic sutures and numerous magmatic complexes (including the FIC), were developed and incorporated into the ANS during various stages of the EAO, and through collisional events during the closure of the Mozambique Ocean (Fig. 11), which ultimately resulted in the collision of East and West Gondwana (c. 870–520 Ma; Shackleton, Reference Shackleton1996; Wilson et al. Reference Wilson, Grunow and Hanson1997). Slab melts accompanying ocean closure, possibly of a subducted Mozambique oceanic crust, may have generated Neoproterozoic TTG magmas such as those of the FIC and many similar magmatic complexes, contributing to welding and consolidating a united (East and West) Gondwana via various stages of the EAO. The Ediacaran age obtained in this study for the TTG suite of the FIC (607.4 Ma) places it within the late orogenic stage that witnessed the closure of the Mozambique Ocean, suggesting that oceanic subduction extended to, and was still operative through, the very late stages of the East African Orogeny. Accordingly, this rare Ediacaran TTG suite of the FIC provides powerful evidence for tracking subduction in the northern segment of the ANS.
Block diagram showing the closure of the Mozambique Ocean during the late orogenic stage that generated some tonalitic magmas, producing the FIC and similar Pan-African igneous complexes that contributed to the final amalgamation of Gondwana (modified from Meert & Lieberman, Reference Meert and Lieberman2008).

6.b. Source characteristics, pressure, temperature and melting conditions
Chemical and isotopic data show that rocks of the FIC belong to the high-Al low-HREE TTG group, represent a volcanic-arc orogenic suite of a peraluminous calc-alkaline nature, and exhibit traits showing strong arc-geochemical signatures that are suggestive of a mafic source (a subducted basaltic oceanic crust). Numerous studies have consistently indicated that TTG magmas are essentially produced by partial melting of eclogite or garnet amphibolite, having a precursor of a subducted basaltic oceanic crust (Rapp, Reference Rapp1994; Rollinson, Reference Rollinson1997; Condie, Reference Condie2005; Halla et al. Reference Halla, van Hunen, Heilimo and Hölttä2009; Almeida et al. Reference Almeida, Dall’Agnol, Oliveira, Macambirab, Pimenteld, Rämöe, Guimarãesa and Leite2011, Reference Almeida, Dall’Agnol and Rocha2017). As demonstrated by several authors, trace elements such as Sr, Y, Nb, Ta and the REEs are sensitive to the mineral assemblage of the source rock (e.g. Rapp et al. Reference Rapp, Shimizu and Norman2003; Xiong et al. Reference Xiong, Adam and Green2005; Moyen & Stevens, Reference Moyen, Stevens, Benn, Mareschal and Condie2006; Moyen, Reference Moyen2009; Almeida et al. Reference Almeida, Dall’Agnol and Rocha2017). For example, Foley et al. (Reference Foley, Tiepolo and Vannucci2002, Reference Foley, Vannucci, Tiepolo, Oberti and Zanetti2004) and Schmidt et al. (Reference Schmidt, Dardon, Chazot and Vannucci2004) showed that partial melting of rutile-bearing eclogite produces liquids with high Nb/Ta ratios (> 16.7 value of primitive mantle; Condie, Reference Condie2005). However, TTG assemblages exhibit low Nb/Ta ratios. Using data from Martin (Reference Martin1999), Condie (Reference Condie2005) argued that depletion in HREE and the low Nb/Ta ratios (5–15; average, 11) in high-Al TTGs require both garnet and low-Mg amphibole in the restite, indicating melting in the Hb-eclogite stability field at depths of 40–80 km (i.e. P = 16–26 kbar), with a temperature range of 700–800°C.
Rocks of the FIC do exhibit low Nb/Ta ratios (in the range 10.6–12.8; average, 11.8) that fall well below primitive mantle values (i.e. < 16.7), and are similar to the average of Proterozoic TTGs in general (average, 9.9; Condie, Reference Condie2005). On the Nb/Ta versus Zr/Sm variation diagram, the FIC rocks, which represent a high-Al TTG suite, plot away from the ‘adakite’ field (Fig. 12), implying a mantle source that lacks rutile. This is consistent with the study of Foley et al. (Reference Foley, Tiepolo and Vannucci2002) that showed that rutile-bearing eclogites cannot serve as sources for most TTG magmas. The Fannani TTG rocks also exhibit low Mg no. (average, 0.39) and low contents of Ni and Sr (average, 17 ppm and 479 ppm, respectively) compared with adakites that possess higher values of Mg no. (> 0.5), Ni (> 20 ppm) and Sr (> 500 and often > 1000 ppm; Condie, Reference Condie2005). In addition, rocks of the FIC also have relatively high Zr/Sm ratios (in the range 36–61; average, 46) compared with adakites that have an average ratio of less than that of the primitive mantle (i.e. < 25.2). High concentrations of compatible transition elements (such as Mg, Ni and V) in adakites (unlike TTGs; Condie, Reference Condie2005) are generally ascribed to the interaction of slab melts with the overlying mantle wedge. It should also be noted that interactions between tonalitic melts and mantle peridotites produce ‘sanukitoid’ magmas enriched in compatible transition elements (Smithies & Champion, Reference Smithies and Champion2000; Martin et al. Reference Martin, Smithies, Rapp, Moyen and Champion2005). Accordingly, the generation of TTG melts does not involve interaction with the mantle wedge (e.g. Moyen & Stevens, Reference Moyen, Stevens, Benn, Mareschal and Condie2006; Almeida et al. Reference Almeida, Dall’Agnol, Oliveira, Macambirab, Pimenteld, Rämöe, Guimarãesa and Leite2011). This is consistent with the present study, as the low contents of these compatible transition elements (average, 1.2 wt% MgO, 17 ppm Ni, 41 ppm V) in the TTG rocks of the FIC (which are not related to sanukitoid magmas) reflect that there is no geochemical evidence to support interaction between the FIC magma and a mantle wedge.
The Nb/Ta versus Zr/Sm diagram of Condie (Reference Condie2005) showing the adakite field in relation to compositional fields representing melting of both rutile eclogite and rutile-free eclogite. Rock samples of the FIC plot away from the adakite field. It should be noted that these rocks plot mainly in the melting field of rutile-free eclogite (see Section 6, Discussion). The melting fields are from Foley et al. (Reference Foley, Tiepolo and Vannucci2002), and the dashed lines represent primitive mantle values of Sun & McDonough (Reference Sun, McDonough, Saunders and Norry1989).

A possible rutile-free eclogitic source for the TTG suite of the FIC (based on its low Nb/Ta and high Zr/Sm ratios) is indicative of pressures below 15 kbar. In addition, its relatively high Sr contents (average, 479 ppm) as well as Sr/Y ratios (average, 27), along with its REE profiles showing depleted and flat HREEs (Fig. 9), are suggestive of melting in the presence of garnet and amphibole; its melt must have been in equilibrium with garnet. This is also consistent with a P range of 10–15 kbar as demonstrated in a number of experimental studies (e.g. Wolf & Wylie, 1994; Rapp & Watson, Reference Rapp and Watson1995; Moyen & Stevens, Reference Moyen, Stevens, Benn, Mareschal and Condie2006). A rutile-free eclogitic source for the FIC (as inferred above) is indicative of pressures below 15 kbar. In a 10–15 kbar P range of melting, plagioclase breaks down, releasing Sr, while Y and Yb would be locked in garnet. The presence of magmatic epidote in the FIC (Fig. 2) suggests a mesozonal crustal level of emplacement with a crystallization pressure of about 5.5 kbar (e.g. Schmidt & Thompson, Reference Schmidt and Thompson1996; Abdel-Rahman, Reference Abdel-Rahman2016).
Melting temperatures needed to produce liquids of TTG compositions at various pressures as determined experimentally were in the ranges of 750–975°C at P = 10 kbar (Wolf & Wyllie, Reference Wolf and Wyllie1989), 700–800°C (Martin, Reference Martin1999; Condie, Reference Condie2005), 1100°C at P = 16–22 kbar (Rapp et al. Reference Rapp, Watson and Miller1988), and 900–1100°C at P = 10–25 kbar (Moyen & Stevens, Reference Moyen, Stevens, Benn, Mareschal and Condie2006). Almeida et al. (Reference Almeida, Dall’Agnol, Oliveira, Macambirab, Pimenteld, Rämöe, Guimarãesa and Leite2011) indicated that tonalite liquids are obtained at c. 1000°C (P < 15 kbar), and require higher temperatures as pressure rises (c. 1200°C at 30 kbar), while trondhjemitic liquids are generated at temperatures below 1000°C. Assuming a pressure in the middle of a 10–15 kbar P range at the melting site, it is doubtful that such a P range corresponding to the stability domain of garnet (necessary to explain the low La/Yb ratio of the Fannani TTG rocks) could have been attained at 700–800°C, and an assumed melting temperature in the 850–950°C range might be more realistic.
6.c. Petrogenesis of the Fannani TTG suite
The orogenic calc-alkaline nature of the high-Al TTG suite of the FIC and its strong arc geochemical signatures (having low K2O/Na2O ratios (average, 0.61), high Sr/Y ratios (average, 27), large Ba enrichment (average, 692 ppm), strong depletions in TiO2 (average, 0.6 wt%), Nb (average, 14 ppm) and Yb (average, 1.55 ppm)) are consistent with magma produced by typical slab melts. Other studies, including that of Moyen & Stevens (Reference Moyen, Stevens, Benn, Mareschal and Condie2006) and Moyen & Martin (Reference Moyen and Martin2012) indicated that tholeiitic basalt seems to be the most appropriate to account for the genesis of most TTGs.
Results of the Nd–Sr isotopes described above (Section 5.c.2) show that TTG rocks of the FIC exhibit relatively high 143Nd/144Nd ratios (average, 0.51263), coupled with a very low initial 87Sr/86Sr ratio (0.7028). The age-corrected ϵNd(t) values of the FIC that range from +5.12 to +7.16, along with its recalculated initial Sr ratios (87Sr/86Sr(i) = 0.70263–0.70283; Table 4), are suggestive of slab melts. These FIC isotopic compositions fall along the mantle array and are clustered in the field of ocean-arc basalts of the Japan arc (Fig. 10b). Moreover, the high positive initial ϵNd(t) values obtained in this study reflect juvenile mantle-derived magmatism, and the remarkably restricted initial values (extending only to 2 ϵNd(t) units; Table 4) support an intra-oceanic origin for the FIC. Such narrow ϵNd(t) ranges have been reported for modern oceanic-arc volcanic rocks, such as those from the Mariana arc (having a spread of 1.9 ϵNd(t) units; Woodhead, Reference Woodhead1989) and from the Kermadec arc (with a spread of 2.7 ϵNd(t) units; Gamble et al. Reference Gamble, Smith, McCulloch, Graham and Kokelaar1993), unlike volcanic rocks from modern active continental margins with their much greater ϵNd(t) ranges (e.g. Hawkesworth et al. Reference Hawkesworth, Gallagher, Hergt and McDermott1993). Furthermore, the FIC possesses even higher ϵNd(t) values than those reported for much older Pan-African assemblages, such as the 854 Ma Eritrean metavolcanics of the southern Nubian Shield (ϵNd(t) of +4.8 to +5.7) that were interpreted by Reference Teklay, Kröner and MezgerTeklay et al. (2002b ) to have formed in an oceanic-island-arc setting. A mantle source and an oceanic-subduction environment are therefore supported by the chemical and isotopic traits of the TTG rocks of the FIC.
More specifically, Drummond & Defant (Reference Drummond and Defant1990) and Condie (Reference Condie2005) indicated that partial melting of a basaltic slab under eclogitic and/or garnet-amphibolitic conditions leaving around 10–15% garnet in the residue produces high-Al TTG magma characterized by low (< 1.8 ppm) Yb (it is 1.55 ppm in the FIC), high (La/Yb)N values (12.8 in FIC), low (< 20 ppm) Y (23.6 ppm in FIC), Nb/Ta values of 7–20 (11.8 in FIC), and high (> 20) Sr/Y and Zr/Sm ratios (27 and 46 in FIC, respectively). The moderately high Kd values of garnet-Hb-Cpx for Y and their low Kd values for Sr allowed the FIC melt to evolve to low Y contents and high Sr/Y ratios. In brief, chemical data of the investigated TTG suite (with its high-Al and low-HREE nature) suggest a comparable petrogenetic scenario, supporting the inference of slab melting under eclogitic conditions leaving residual garnet in the source. Similarly, a petrogenetic process envisaged by a number of authors (e.g. Drummond & Defant, Reference Drummond and Defant1990; Condie, Reference Condie2005; Martin et al. Reference Martin, Smithies, Rapp, Moyen and Champion2005; Moyen & Stevens, Reference Moyen, Stevens, Benn, Mareschal and Condie2006; Almeida et al. Reference Almeida, Dall’Agnol, Oliveira, Macambirab, Pimenteld, Rämöe, Guimarãesa and Leite2011) and that is widely accepted involves anatexis of a basaltic slab under eclogitic conditions leaving garnet in the residue to produce TTG magmas. On the diagram containing various partial melting curves produced from MORB source materials (after Drummond & Defant, Reference Drummond and Defant1990; Martin, Reference Martin1993), data points of the TTG suite of the FIC plot along the eclogite and garnet-amphibolite curves, suggesting its magma was generated by partial melting (F = 0.25–0.50) leaving eclogitic- or 10–25% garnet-amphibolitic restite (Fig. 13).
(a) (Yb)N versus (La/Yb)N diagram and (b) Y (ppm) versus (Sr/Y) diagram containing various partial melting curves produced using initial MORB source materials (modified after Drummond & Defant, Reference Drummond and Defant1990; Martin, Reference Martin1993) for the Fannani TTG suite. Data points of this suite plot along the garnet-amphibolite and eclogite curves, suggesting its magma was generated by partial melting (F = 0.25–0.50), leaving eclogitic, or 10–25% garnet-amphibolitic, restite (see text for details).

The petrogenetic scenario presented here conforms to the proposal that widespread recycling of the Neoproterozoic oceanic crust must have accompanied the formation of the vast island-arc terranes within the various Pan-African belts, which also host several ophiolitic sutures. The closure of the Mozambique Ocean (Fig. 11) took place via convergence of East and West Gondwana (c. 870–520 Ma; Shackleton, Reference Shackleton1996; Wilson et al. Reference Wilson, Grunow and Hanson1997). Slab melts accompanying this closure seem to have produced voluminous orogenic calc-alkaline magmas that were responsible for crustal development in NE Africa and Arabia. In summary, melting of a subducted Mozambique oceanic crust (transformed into eclogite in an oceanic-arc environment) generated TTG magmas that produced the FIC and similar other Neoproterozoic igneous complexes, forming large juvenile belts along the EAO, suturing East and West Gondwana together and assembling them into a united supercontinent during the Neoproterozoic Era.
7. Conclusions
-
(1) The Fannani Igneous Complex was emplaced between low-grade metasedimentary and ophiolitic assemblages to the south, and a high-grade gneissic dome mantled by mylonitic and/or metapelitic schists to the north. Its undeformed, monotonous rocks exhibit magmatic-flow textures, and contain abundant sodic plagioclase and variable contents of quartz, K-feldspar, hornblende, biotite and magmatic epidote, along with accessory titanite, zircon, apatite and rare allanite.
-
(2) Geochemical data of the FIC indicate that it is a high-Al TTG suite characterized by a wide range of SiO2, Al2O3, Sr and Zr, has moderate enrichment in REE, depletion in K, Ti, Nb, Y, Hf and HREE, and exhibits moderately fractionated REE profiles, therefore showing clear orogenic affinities and strong arc-geochemical signatures.
-
(3) Results of the isotopic study show that the FIC exhibits an initial Sr ratio of 0.70284, and age-corrected ϵNd(t) values of +5.1 to +7.2, with Sr–Nd compositions typical of modern oceanic-arc rocks, suggestive of mantle sources and island-arc settings. The precise U–Pb zircon TIMS age obtained (607.4 Ma) indicates that the FIC is a rare Ediacaran TTG suite, and implies its magma generation accompanied the closure of the Mozambique Ocean during the very late stages of the EAO.
-
(4) The high-Al TTG rocks of the FIC exhibit chemical and isotopic traits indicative of magmas produced by anatexis of a basaltic slab. Partial melting models indicate that the FIC magma was generated via melting (F = 0.25–0.50) of a subducted oceanic crust transformed into eclogite, leaving 10–25% garnet in the residue. Thus, melting of a subducted eclogitic Mozambique oceanic crust generated tonalitic magmas that produced the FIC and similar other Neoproterozoic igneous complexes along the EAO, forming large juvenile belts that sutured East and West Gondwana together into a united supercontinent. Accordingly, this rare Ediacaran TTG suite provides powerful evidence for tracking subduction, which must have been operative through the very late stages of the East African Orogeny.
Particularly relevant will be detailed investigations of similar igneous complexes in the region to determine the extent of Ediacaran TTG plutonism occurring within the ANS, and its role in evaluating processes of Neoproterozoic crustal development in NE Africa and Arabia and in comparisons with processes dominated during the earlier phases of crustal evolution during the Archean Eon.
Acknowledgements
Dr Z. El-Alfey of the Geological survey of Egypt is thanked for providing facilities during the field investigation. Dr Serge Nadeau is acknowledged for helpful suggestions and a fruitful exchange of ideas during the initial phase of this work. Professor R. F. Martin is thanked for discussions and useful comments. I wish to acknowledge the assistance of Dr Y. Kapusta in performing the radiometric isotopic analyses. I thank both Ms Eliane Shwairi and Mr Maroun Ijreiss of the American University of Beirut for providing some technical assistance. The comments and corrections of reviewers and the editor significantly improved the quality of this manuscript, and are much appreciated. I am grateful to Dr K. Goodenough for careful editing of this contribution. This work was supported by an internal AUB university research grant to the author.