


Introduction: Newcastle as a late industrial city
There was a shock in store for Newcastle residents at the beginning of the nineteenth century: Britain's first national census in 1801 recorded the city's population as only a little over 30,000, showing it to be falling far behind other major northern cities. As Ellis tells it, this was a ‘universal surprise’ to ‘outraged citizens’ who ‘virtually demanded a recount’.Footnote 1 Long used to being regarded as a leading provincial city, Newcastle was found wanting in the pioneering era of Britain's eighteenth-century industrialization. The basic reason for this can be found in Ellis’ title referring to the city's economy as the ‘Black Indies’. To be an ‘Indies’ is not a good thing economically, as with its more well-known East and West varieties, this label indicates a dependent economy providing raw materials for a richer metropolitan core.Footnote 2
The Newcastle economy's dependence on the coal trade to LondonFootnote 3 did encourage incipient industrialization – the process of coal extraction was a consumer of metal goods stimulating an iron industry and sand ballast from ships returning from London was the basis for a glass industryFootnote 4 – but in north-east England this was not at the scale to be found in other regions of northern Britain. Whilst we are conscious of the region's economic development in the seventeenth and eighteenth centuries, our point here is a relative one.Footnote 5 However, this all changed in the nineteenth century as the engineering skills from the mining industry spilled over into major new industrial ventures of a much greater magnitude. Ellis pinpoints this change with the launch of the first steam-powered boat on the Tyne in 1814Footnote 6 but the change in Newcastle's fortunes is more generally associated with the engineering career of George Stephenson from coal industry to ‘father’ of modern railways.Footnote 7 As one recent history of the railways puts it, ‘the north-east was the Silicon Valley of its day’.Footnote 8 And about a century later we find a history of the electricity industry lauding Newcastle's prescient development: ‘Newcastle upon Tyne. . .stood out as an exceptional development in Britain’,Footnote 9 so that when the Great War came the city ‘stood as a model’ for expanding ‘British electrical supply’.Footnote 10 It is this period of economic successes from steam locomotives to electrical supply systems that defines the ‘long nineteenth century’ of our title.
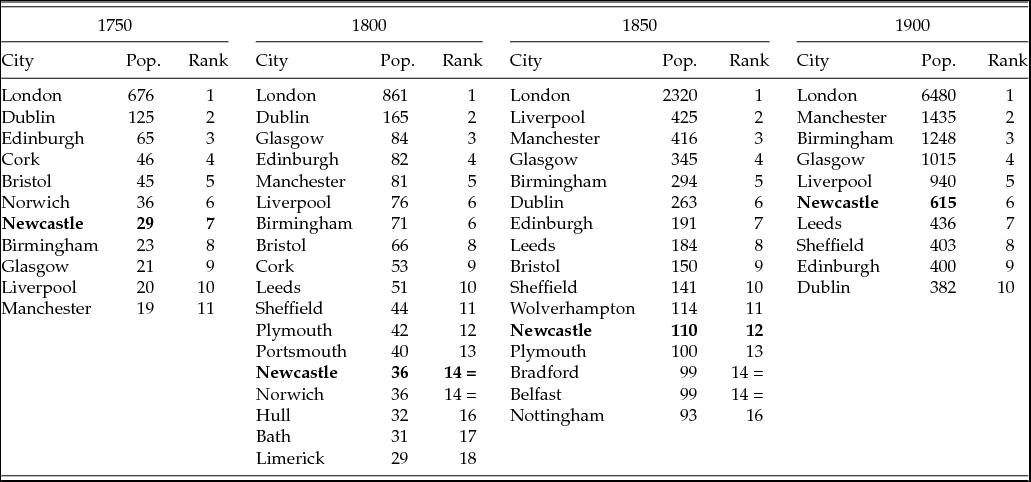
Returning to the demographics, this relative economic change is reflected in Table 1 showing the fall and rise of Newcastle's population rankings amongst leading British cities from 1750 to 1900.Footnote 11 To put the city in its national context, this table includes all UK cities larger than Newcastle and the four cities immediately below it in ranking. Thus, in 1750, Newcastle still has a high ranking but is only just above Birmingham, Glasgow, Liverpool and Manchester, the UK's big four industrial cities that were all soon to outgrow Newcastle. By 1800, Newcastle had dropped to a lowly fourteenth rank, improved to twelfth in 1850, and by 1900 was only topped by the big four plus London. This is what we mean by referring to Newcastle as a late industrial city in relation to Britain's other industrial cities.
Newcastle amongst leading cities of the UK, 1750–1900

Source: Derived from T. Chandler, Four Thousand Years of Urban Growth: An Historical Census (Lewiston, NY, 1987).
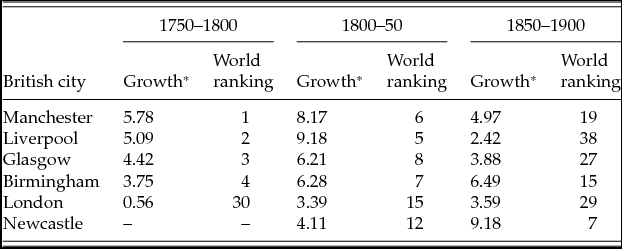
But the economic processes reflected in Table 1 are much more than merely national phenomena. In general terms, the British ‘industrial revolution’ as it is usually referred to was, above all, a world-changing set of processes, and the specific contributions of Newcastle previously alluded to, in railway and electricity developments, were also overtly world-changing in their particular impacts. Thus, we need to understand Newcastle in a world context in addition to its national context. This is what is done in Table 2, which derives from a large project measuring the growths of leading cities across the world from 1500 to the present.Footnote 12 Focusing on the same time periods as Table 1, this shows actual growth rates and their associated world ranking for the UK cities in the study. Newcastle did not qualify for inclusion in the eighteenth-century analyses but note that the table confirms the big four UK industrial cities as the driving forces of the new economic transformation. In the nineteenth century, Newcastle's rise is clearly illustrated in world terms: the twelfth fastest-growing city, but still behind the big four, through to 1850, followed by Newcastle outgrowing the other British cities to become the seventh fastest growing amongst leading cities in the world up to 1900. It is this latter finding that initially stimulated the further research required to write this article. We want to understand what was happening in Newcastle to produce such a surprising result, one that is so different from the other surprising result we began with. This additional work is the world-historical interpretation referred to in our title.
Population growth rates of UK cities in a world context, 1750–1900

*Annualized percentage population growth.
Source: Derived from P.J. Taylor et al., ‘Explosive city growth in the modern world-system’, Urban Geography, 31(2010), 878, 880.
A world-historical interpretation has to be circumscribed to make it manageable. To this end, we use a theoretical framework that combines the world hegemonic cycles model of WallersteinFootnote 13 with Jacobs’ theory of city economic growth.Footnote 14 A basic outline of this synthesis of macro-economic change through different geographical scales is provided in the next section. The remainder of the article, its empirical core, is about applying critical components of these ideas to the economic development of Newcastle in its long nineteenth century. We focus first on the economic integration of Newcastle with neighbouring towns to create a multi-nodal city region, second, on the city economy's increasingly complex division of labour and, finally, provide some evidence of the development of social and cultural institutions that were an integral part of the transition from ‘town’ to ‘metropolis’.
Explosive city growth within world hegemonic cycles
The great urban theorist Jane Jacobs sums up her basic economic argument as follows: ‘Economic life develops by grace of innovation; it expands by grace of import replacing. These two master economic processes are closely related, both being functions of city economies.’Footnote 15 In this argument, innovation is a function of the size and complexity of cities where problems generate new demands that only creative locales can satisfy through new production and consumption. Import replacingFootnote 16 derives from the diffusion of innovations through city networks of creative locales where innovations can be improvised for local production and consumption. Thus, both processes generate new work thereby increasing the complexity of a city's division of labour. It is this that defines economic development as a special case of economic growth. An economy can grow by just increasing what is already being produced – adding more old work to existing old work such as doubling the output of a factory – but this does not add to a city's division of labour and hence does not qualify as development. Thus are cities, through their innovations and import replacements, the ‘primary economic organs’ of development.Footnote 17
One of the key advantages of this urban economic theory is that it provides the mechanisms for understanding the internal and external relations of cities together, or as Jacobs more eloquently describes it ‘the little movements in the hubs that turn the great wheels of economic life’.Footnote 18 In the broader literature, these are usually treated as agglomeration/cluster processes and network/connectivity processes respectively that provide cities with specific economic advantages.Footnote 19 In Jacobs’ work they are entwined in multiple urban spirals of economic development in which the crucial mechanism is import replacing, ‘a process of immense, even awesome, economic force’.Footnote 20 This generates ‘explosive economic growth’,Footnote 21 short periods of time in which a city rapidly develops into a larger and increasingly complex economy. This is contrasted with growth generated by exports, which produces only relatively slow economic changes. In fact, the more a settlement's economy is dominated by exporting, the more it becomes dependent on distant markets and will experience little or no development even if exports (old work) grow. But exports are important – they are obviously necessary for import replacing – especially when derived from innovation in other cities. This is because a set of cities vibrantly import replacing will eventually become more and more economically similar, increasingly negating the need for trade and thereby stagnating. Thus, a continual stream of innovations is needed initially to spark network vibrancy through export and diffusion of innovation and then for further export followed by diffusion to keep the network vibrant. Hence, Jacobs’ development spiral is a combination of exporting and import replacing creating more and more complex divisions of labour as cities grow larger.Footnote 22 This is what we think was happening to Newcastle in its long nineteenth century.
Jacobs’ theory of city economic growth is presented as generic; she is explicit that the processes she describes have operated from the very beginnings of urban life. This means that she provides no insight into the worldwide explosion of urbanization that we call modernity. The unprecedented modern development of cities has been long recognizedFootnote 23 and has famously culminated in our century being designated the first ‘urban century’ because a majority of humanity are city dwellers. This broader context is relevant because Newcastle in its long nineteenth century is part of a central modern narrative, industrialization. This is where we bring in Immanual Wallerstein's work on the modern world-system. He draws his ideas from the seminal writings of Fernand Braudel largely covering the centuries before modern industrialization. Braudel interprets economic development in early modern Europe as being centred on a series of cities in the sequence Venice, Antwerp, Genoa, Amsterdam.Footnote 24 The latter's pre-eminence in the seventeenth century is described as a transition to a modern state-based economic dominance. This is taken up by Wallerstein to define three world hegemonic cycles, the Dutch, British and American in the seventeenth, eighteenth/nineteenth and twentieth centuries respectively.Footnote 25 WallersteinFootnote 26 treats these three long cycles as the rhythms of the modern world-system involving three renewals of economic development that can be interpreted as generating, in turn, mercantile modernity, industrial modernity and today's consumer modernity.Footnote 27 Obviously, Newcastle's long nineteenth century fits into this framework as part of British industrial modernity but there is a twist to the story.
Wallerstein's privileging of states in the construction of long economic cycles is at odds with Jacobs’ identification of cities as the primary locales of economic development. The research project from which Table 2 draws its information specifically addresses this difference. Using demographic data to identify 150 episodes of explosive economic bursts since 1500, these are found to cluster, as expected, in the times and spaces of world hegemonies (i.e. Dutch cities feature prominently in the seventeenth century, British cities in the eighteenth/nineteenth centuries (see Table 2) and US cities in the twentieth century).Footnote 28 But if economic development is a creation of cities, these explosive city growths should be found at the beginning of each hegemonic cycle reflecting how and where the exceptional economic development is instigated. And this is exactly what is found: city economic bursts are front-loaded in each hegemonic cycle – for Dutch cities in the late fifteenth century, for British cities in the early eighteenth century and for US cities in the late nineteenth century.Footnote 29 It is also found that the number of cities experiencing economic explosive growths decline in each hegemonic state towards the end of its hegemonic cycle. But there are curious exceptions in each case where one city comes to the fore towards the end of the hegemony. The three cities that have this pattern of development are Rotterdam, Newcastle and Los Angeles;Footnote 30 each one makes little or no contribution to the building of their countries’ respective hegemonies but at the end they become a late mainstay for sustaining mercantile, industrial and consumer modernities respectively in their ‘home’ states. As late developers, they are able to take advantage of established, vibrant, national city networks to export to and import replace from.Footnote 31 This is how we see Newcastle's long nineteenth century in both national and world-historical perspective.
There is one final point that links Jacobs’ theory to Wallerstein's model: the creation of regions, specifically city regions. Jacobs describes how vibrant cities expand their development to surrounding areas to generate larger economically successful regions.Footnote 32 And we know that Wallerstein's hegemonic states did not incorporate all parts of their respective territories as economic success stories (i.e. the Dutch eastern provinces, western Ireland and the Scottish highlands in the UK, and the ‘American south’ in the USA remained relatively undeveloped at the height of each country's hegemony). Thus, spatially, hegemony was represented by a patchwork of regions that were distinctive in the basis of their economic successes – Britain's characteristic industrial regions in the eighteenth and nineteenth centuries are a clear case of this. In fact, it is in these regions that one of the founders of modern economics, Alfred Marshall, famously identified industrial knowhow – propensity to innovate and improvise – as being ‘in the air’.Footnote 33 But going back to Jacobs, these regions have cities as their nuclei and can be seen as city regions such as Glasgow and Clydeside, Liverpool and Merseyside, and, of course, Newcastle and Tyneside. But industrial regions were often more than these riverside extensions of cities; Manchester and Birmingham were centres of larger regions. Newcastle held such a position with respect to north-east England. However, in the empirical material that follows we focus on the city and a relatively narrow version of the city region (Tyneside plus Wearside).
We are going to treat the late industrial development of Newcastle and its city region as a case-study of Jacobs’ explosive city growth. This is presented in three parts. First, we trace the formation of a multi-nodal city region as an integrated economy. This entails describing infrastructure developments that enabled the integration and tracing changes in local divisions of labour that converge on one city economy division of labour. Second, we explore the division of labour in more detail to show the increasing complexity from ‘Black Indies’ Newcastle to the peak of economic changes in the late nineteenth century. Whilst large-scale employers remained a significant feature of the industrial landscape, our emphasis is on identifying new work from both innovation and import replacement, which entails a focus on small and medium sized enterprises. Finally, we consider what Jacobs calls ‘rounding out’ city development. Footnote 34 A vibrant city is always more than its economy, there is a metropolitan dimension that includes new social and cultural institutions expected of a city and which are specific to an era. We describe Newcastle as a relatively late cultural developer in terms of Victorian urban accoutrements.
Making a city region: multi-nodal integration
Since Newcastle began the nineteenth century as a long-established city, we would expect to find obstacles that have held back development, specifically ‘Indies’ vested interests, an economic oligarchy, blocking change. In fact, Jacobs actually uses early modern NewcastleFootnote 35 as an example of suppression of new export work.Footnote 36 This refers to the economic oligarchy of coal owners and merchants who dominated the city corporation and controlled trade and industry along the Tyne from the city to its mouth. This monopoly was effectively used to prevent a multi-nodal urban region developing and lasted into the nineteenth century. Newcastle's monopoly was finally replaced in 1850 by the Tyne Improvement Commission, with representation from other towns along the Tyne.Footnote 37 This marks a key step in the development of Tyneside as a new city region, arguably enabling what Middlebrook terms ‘The Great Expansion’ from 1855 to 1914.Footnote 38
The growth of Newcastle in this article is both economic and geographical. Here, we deal with the transformation of Newcastle's city economy into Tyneside and more. The term ‘conurbation’ was first coined to describe these new urban phenomenaFootnote 39 although we use the term multi-nodal city region to emphasize the city-ness in making such development; the latter is detailed in the next section. For Newcastle's integration with its neighbours in the long nineteenth century, we identify two related processes. First, there is the physical integration created through new infrastructural developments. This enabled economic integration, which in general can take one of two forms: either economic specialization with nodes becoming increasingly different so as to complement each other; or economic convergence through nodes becoming increasingly similar. It is the latter that typified nineteenth-century Britain – it is similarity across a region that produced the ‘industrial atmosphere’ that, as we previously noted, impressed Marshall (1890). Such an economic integration occurred to create a Newcastle multi-nodal city region in the long nineteenth century.
According to Jacobs, an expanding city economy inevitably outgrows existing infrastructure capacity, and the consequent problems of inefficiency stimulate innovative change.Footnote 40 The latter is experienced as the explosive growth comes to a peak – in Newcastle's case in the second half of the nineteenth century. This is where the Tyne Improvement Commission fits in: the resulting massive programme of dredging, building new docks and constructing two large piers at the river's mouth finally produced a waterway fit for the city economy's purpose.Footnote 41 At the same time, port facilities were greatly improved in Sunderland. In this way, movement in and out and along the rivers was especially improved but equally important were the land transport developments integrating the city economy.
The physical integration of Newcastle with its neighbours has been previously described by one of us and we summarize the process here.Footnote 42 The key point for understanding the geographical expansion of the city economy is that expanding patterns of journey to work were facilitated by changing public transport provision. Initially, workers would walk to work in separated towns, but in the 1830s horse-drawn omnibuses provided links between Newcastle and both South Shields and Sunderland; however, these were too expensive to have much impact. However, in 1839, two railways were opened from Sunderland and South Shields to Gateshead (and then walking across to Newcastle, the rail bridge crossing the Tyne only operated from 1850) but the railway from Newcastle to North Shields had greater impact as the first railway specifically ‘designed to carry passengers to and from outlying communities’,Footnote 43 creating an integration of riverside towns along the north bank of the Tyne. The relatively cheap fares resulted in over a million passengers in 1845–46 including both workers moving between shipyard jobs and messengers maintaining close business ties along the river.Footnote 44 Middle-class commuting came later from the coast and extended east and north as well. However, the major reaction to the transport problems at the peak of Newcastle city economy's explosive growth came in the 1870s when local politicians and commercial and industrial leaders combined to promote tramways specifically to promote ‘industrial efficiency’.Footnote 45 Within both Newcastle and Gateshead, tramway networks were developed, eventually spreading across all of Tyneside, and, in a major development, they were electrified in the early 1900s. This stimulated the innovation of electrification of the Newcastle to North Shields/coast railway.Footnote 46 Both investments were highly successful: by 1913–14, Newcastle's tramways were carrying nearly 58 million passengers (Gateshead's carried another 12 million). The working-class Scotswood route alone carried over 11 million.Footnote 47 Passenger figures for the electric railway averaged 8 million. These local rail connections were supplemented by a frequent river ferry service connecting North Shields and South Shields with Newcastle and Gateshead with no less than 14 stops along the way. The service ran every 30 minutes from 7.00 a.m. to 7.30 p.m.Footnote 48 Thus it was that ‘Tyneside’ emerged as ‘a larger labour and housing market’.Footnote 49 Overall, what this shows is evidently not a simple case of suburbanization of housing for the middle classes; decentralized workplaces beyond the central city were equally important involving large working-class flows in a complex multi-nodal city region construction.
But what sort of economy were these flows and relations producing? To answer this question, we use occupation data derived from censuses from 1851 to 1911 by RoweFootnote 50 that gives the distribution of workers across 18 categories for Gateshead, Newcastle, North Shields,Footnote 51 South Shields and Sunderland. We have added an additional category, ‘other’, that includes all occupations not contained in Rowe's categories. We interpret the percentages for the 19 categories in each area as aggregate descriptions of local divisions of labour as they change over a crucial 60-year period in the construction of an encompassing city region.Footnote 52 We have conducted two types of analysis of these data, one focusing on trends in occupations and the other indicating how the economic integration emerged.
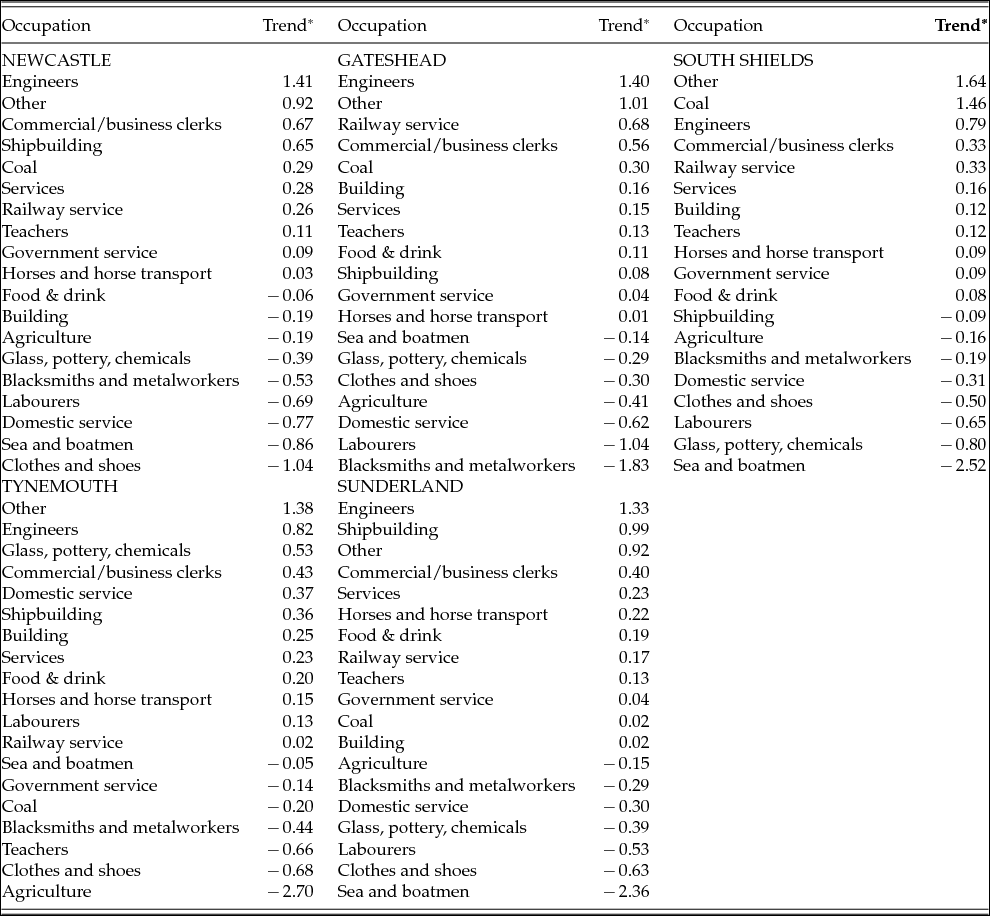
Trends in occupations can be described by simple regression lines relating occupations percentages for each area to the time sequence of the data. The gradients of these lines – presented as percentage change per decade in Table 3 – show which occupations grew, declined or remained fairly stable from 1851 to 1911. Thus for Newcastle, ‘Engineers’ increased at a rate of 1.41 per cent per decade, ‘Clothes and shoes’ declined by 1.04 per cent and ‘Horses and horse transport’ remained at about the same relative level (0.03 per cent). The key feature of this table is the similarity in the top and bottoms of each area list: at the top ‘Engineers’, ‘Other’ and ‘Commercial/business clerks’ consistently show very strong growth whereas at the bottom there is less consistency but ‘Sea and boatmen’, ‘Agriculture’, ‘Labourers’ and ‘Clothes and shoes’ feature prominently as declining occupations. There are also specific strengths in some areas such as the exceptional growth of ‘Railway service’ in Gateshead and ‘Shipbuilding’ in Sunderland.Footnote 53 Obviously the steep rise of engineers and business service workers is particularly indicative of a rapidly industrializing economy and consequent division of labour. However, the ‘Other’ category is of even more interest, strongly increasing as it does across all five places. This signals an increasing complexity of economic process that cannot be captured by Rowe's basic division of labour into just 18 categories. Thus it is not just a matter of the rise of more sophisticated new work and decline of traditional old work but a concurrent increasing economic complexity, which we discuss further below.
Occupations trends, 1851–1911
* Percentage change per decade
Source: Calculated by authors from data in D.J. Rowe, ‘Occupations in Northumberland and Durham, 1851–1911’, Northern History, 8 (1973), 119–31.
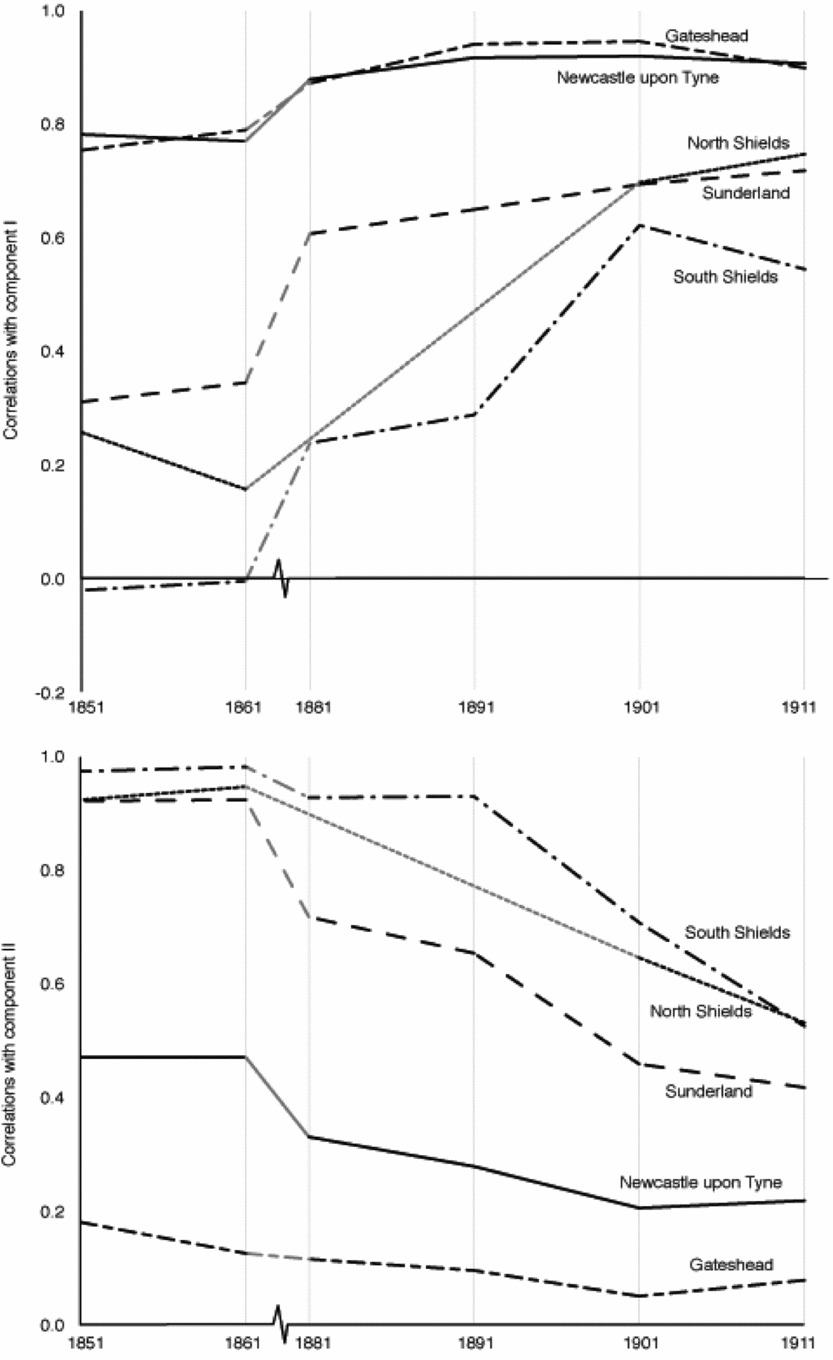
The strong similarities noted but also some of the differences amongst the areas in Table 3 can be further explored through carrying out a principal components analysis on the data.Footnote 54 This is a data reduction technique that converts a large number of variables into a much smaller number of ‘principal components’. These are composite variables showing variation in the data that is common to specific sets of variables. In this case, we find that the 28 variables (divisions of labour for the five areas across different census dates) can be reduced to just two principal components, which between them account for 85 per cent of the total variation in the data.Footnote 55 In other words, this is a very successful exercise in data reduction with 28 divisions of labour condensed to just two common divisions of labour. These are described in Figure 1 in which the contribution of each area's division of labour to the two principal components are shown over time. These are measured as simple correlations; for instance in the Newcastle division of labour (list of occupation percentages) in 1851 there is a correlation of +0.79 with the first principal component but only +0.47 with the second component. This means that Newcastle's particular distribution of occupations in 1851 is very similar to the first component's composite pattern of occupations but is much less similar to the second component pattern.
Newcastle, Gateshead, North Shields, South Shields and Sunderland in two common divisions of labour, 1851–1911
Source: Calculated by authors from data in D.J. Rowe, ‘Occupations in Northumberland and Durham, 1851–1911’, Northern History, 8 (1973), 119–31.
We interpret the first component, which accounts for 47 per cent of the variation in the data as ‘City economy convergence’. This common division of labour is very similar to the situations in Newcastle and Gateshead throughout the period (high correlations) but to which Sunderland, North Shields and South Shields only become close towards the end of the period. The key occupation composing this component is Other, followed by Engineers, two strongly growing categories in Table 3. In contrast, the second component, which accounts for 38 per cent of the overall variation, trends in the opposite direction. It is very close to the divisions of labour in Sunderland, North Shields and South Shields at the beginning of the period but falls away towards the end; Newcastle and Gateshead are never strongly related to this common division of labour, which we interpret as ‘Waning coastal maritime economy’. The key occupation composing this component is Sea and boatmen, a strongly declining category in Table 3.Footnote 56 By 1911, all five areas are more closely related to the convergence component than the coastal one. Thus, the building of an integrated and complex city economy coincides with the relative decline of a simpler maritime economy, which does not disappear but is largely superseded.
Making a city economy: a new complex division of labour
According to one contemporary observer,Footnote 57 the economic opening up of the Tyne was the key development in the city becoming nothing less than ‘The Cradle of Nineteenth-Century Progress’.Footnote 58 Johnson compares Tyneside before and after the Tyne Commission's work and sums up a ‘record of fifty years of progress’ as follows: ‘the Tyne in less than half a century has quadrupled its coal shipments, has tripled the quantity of tonnage owned in the port, has practically created an import trade, has covered its banks with iron shipyards and engineering works’.Footnote 59 We have highlighted the reference to the import trade in contrast to the more familiar economic achievements of Tyneside because this specific new work is crucial to Jacobs’ argument. As the Black Indies, Newcastle's trade was unusually unbalanced: exports far exceeded imports.Footnote 60 The rise of imports to replace the ballast, customarily needed for ships returning to Newcastle, indicates that the city is becoming a more multifaceted urban place: imports are available for replacing to complement exporting industries in growing the economy. It is the latter, the economic face Newcastle presents to the rest of the world, that dominates traditional narratives of the city's success but Jacobs’ theory of city economic development steers us towards looking at what is going on inside the city. Explosive city growth requires large-scale import replacing and therefore this should be strongly present in Newcastle in the nineteenth century. We search this out by taking a more detailed look at the city economy's changing division of labour.
The main agents generating Jacobs’ two master economic processes are primarily small and medium sized enterprises (SMEs). In this, they contrast with large businesses that are based on past economic successes: they are associated with old work and, furthermore, if dominating a city will likely curtail innovation and improvization.Footnote 61 For researching nineteenth-century economics there is a source that is particularly appropriate for studying SMEs: trade directories. These are commercial publications that vary greatly in quality but carefully used they are indispensable for delineating the division of labour by firms within a city.Footnote 62
For this study, we use two directories,Footnote 63 one for 1801 to represent the export/dependency economy and the other for 1883 in the middle of the explosive city growth.Footnote 64 The former covers Newcastle and Gateshead (‘Black Indies Newcastle’), the latter adds ‘Sunderland, North and South Shields and Suburbs’ thus reflecting the geographical growth of the city economy described above (Tyneside plus Wearside). The number of firms listed in 1801 is 1,526 and this rises to 9,210 in 1883 reflecting both the economic and geographical growth of Newcastle and its region. This sixfold increase will be a mixture of expanding old work and introducing new work. To find the latter, we need to partition these lists into different types of work; this is done by the producers of the directories to facilitate their customer's use of their publication. Firms are listed under headings indicating different commercial activities: there are 216 categories in 1801 increasing to 639 in 1883. We use these types to represent Newcastle's division of labour at both time points; the threefold increase is an indication of new work making a more complex city economy.
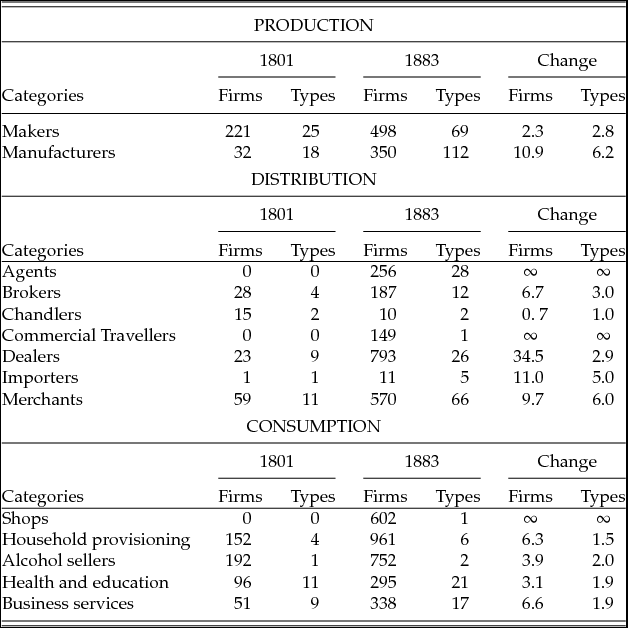
We discuss changes in the division of labour between 1801 and 1883 through the three basic economic sectors of production, distribution and consumption. We have selected representative examples of each and show frequencies of firms and types in Table 4. In addition, changes are shown as the multiplier of frequencies between the years; these should be compared to overall changes – sixfold for firms and threefold for types. Starting with production, although large firms continued to be significant employers, we expect SMEs to be particularly vibrant in this sector leading the diversification of the economy. To represent production, we have featured all firms that call themselves either makers or manufacturers; the latter implies both a larger scale of production and more modern practices but still remaining SMEs at this time. We see in the table that in fact manufacturing firms increase much quicker than makers. The latter remain the majority in 1883 but are clearly overtaken by manufacturers in the number of types of production. The two very high multipliers for manufacturing, both approximately double the overall rates, suggests this is where most new work in SME production is taking place. This is confirmed when matching the types of production between years: 15 of the 69 makers types in 1883 can be traced back to 1801 compared to only 9 of the 112 manufacturing types. This indicates 78 per cent and 92 per cent respectively for new production activities.
Changes in production, distribution and consumption, 1801–83
Source: Derived from Directory of Newcastle upon Tyne & Gateshead (1801), and Kelly's Directory of Newcastle, Gateshead, Sunderland, North and South Shields and Suburbs (1883).
For the distribution sector, we have selected types of firms that are directly involved in the movement of commodities. Initially, with a dependent economy this sector should be quite simple; but the rise of imports will require more complex arrangements and this is shown in Table 4. Firms explicitly described as ‘importers’ remain rare but do increase from just one in 1801 to five in 1883. But there are impressive changes elsewhere suggesting a complete overhaul in this sector. There are two important categories that are found only in 1883 (agents and commercial travellers) and the other categories that did exist in 1801 generally increase in numbers of firms and types more than the overall levels of sixfold and threefold. The clear exception is a specialist occupation – chandlers, purveyors of candles – who actually decline. There are differences between the categories in terms of contribution to making the economy more complex, as illustrated by dealers and merchants. The former increases the most in numbers of firms whereas the latter increases most in terms of types of activity. We can infer from this that merchants are making the greater contribution to increasing complexity within the city economy.
Consumption is the key to the spiral of economic change that makes a city economy more complex. This is simply indexed in Table 4 by the emergence of shops as the most common firm in 1883 from being unrecorded in 1801. This is part of the wider consumption revolution separating shops for just selling from workshops for producing and selling on the same site.Footnote 65 However, in many cases this represents the simplest entrepreneurial move in converting a house, perhaps a corner house, into a local shop. This is not the same as general household provisioning – grocer, butcher, baker and greengrocer – which expand at roughly the same general rate for firms but with very little diversification. This would indicate a classic case of expansion of old work that does not increase the complexity of the city economy. In contrast, it is hard to interpret the huge number of shops because the Directory leaves them undifferentiated. Note that the other old work, provisioning alcohol, despite Newcastle's long-held reputation in this sphere, does not even keep up with the overall increase in firms. The same is true for health and education services; however, business service firms do increase faster than overall growth but not at a level to suggest this is a major contributor to making the city economy more complex.
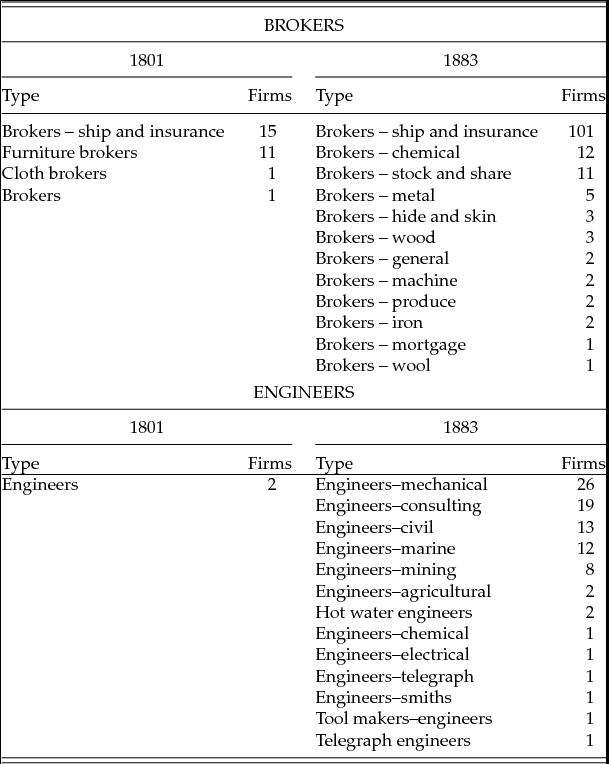
These general comparisons of sectors do not provide evidence for the actual processes operating to generate increasing complexity. New work can be derived from existing work through increasing specialization of activitiesFootnote 66 or it can be completely new work, perhaps a firm setting up to replace imports or an existing firm branching into a new area of work. These two processes are illustrated in Tables 5 and 6 respectively. Brokers and engineers are used to show increasing complexity through derivation (Table 5). Brokers for shipping and insurance are the chief specialism for both 1801 and 1883 in Newcastle's city region as befits a major port. However, in 1883 there are 11 other brokers that simply did not exist in 1801Footnote 67 – brokering spawned a broad range of new tasks to meet the needs of the new economy. This shift is even starker with the case of engineering work – there were just two firms in 1801 and undifferentiated; by 1883, there are 13 specializations offered by 88 firms. These suggest innovation as much as import replacing: Newcastle is at the forefront of the creation of a new modern profession.
Increasing complexity of division of labour by derivation: brokers and engineers
Source: Derived from Directory of Newcastle upon Tyne & Gateshead (1801), and Kelly's Directory of Newcastle, Gateshead, Sunderland, North and South Shields and Suburbs (1883).
Complexity of division of labour by indirect means: agents and selected manufacturers/makers, 1883
Source: Derived from Kelly's Directory of Newcastle, Gateshead, Sunderland, North and South Shields and Suburbs (1883).
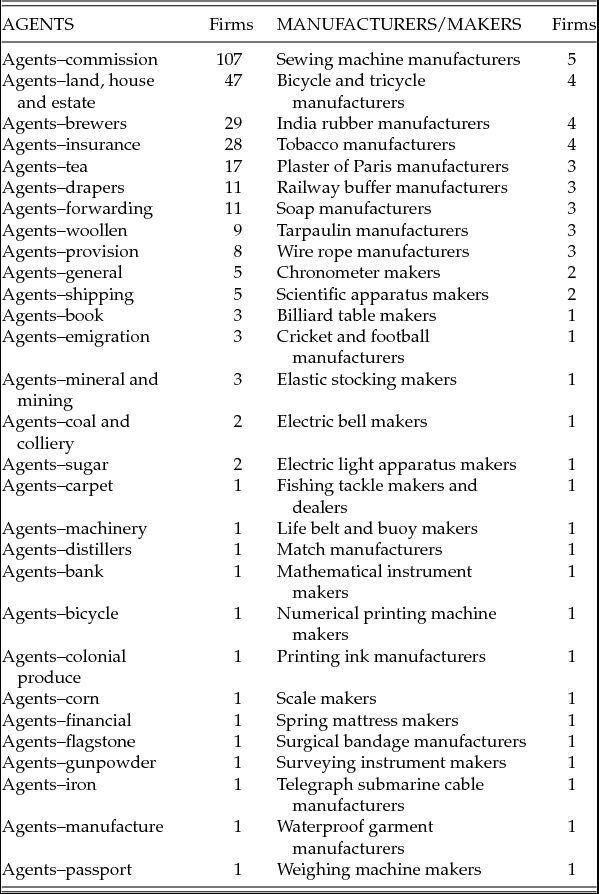
Increasing complexity through indirect means is represented in Table 6 by agents and selected makers/manufacturers. Agents are conspicuous by their absence in 1801 but by 1883 they are an important category in distribution. There will be instances of old work being renamed as agencies take over what firms had previously done themselves but the rise of this category does indicate a whole new raft of work. The range of new work is impressive in meeting needs, for example, for tea, for forwarding, for bicycles, for colonial products, for gunpowder and for passports. Here, we seem to be looking into a new modern world and this is confirmed by our selected list of manufacturers and makers of new products. Thus, as well as an agent to procure bicycles, there are four manufacturers of said object. In fact, this list is full of new demands that have stimulated import replacing. As well as bicycles, living in Newcastle in 1883 you can now buy sewing machines, India rubber, plaster of Paris, footballs, printing ink, spring mattresses and weighing machines all made locally. In addition there is new work due to local innovation such as making electric bells, electric light apparatus and several specialist instruments. This table, in particular, provides a clear sense of a vibrant city economy undergoing an explosive growth in new work.Footnote 68
Making a metropolitan culture: beyond economic vibrancy
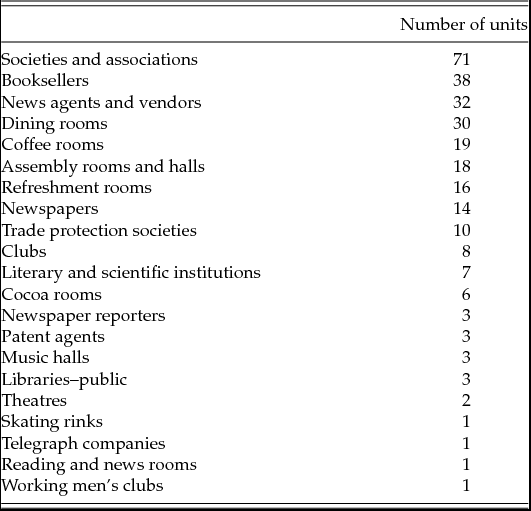
We can also use the directories to show how Newcastle's economy was rounded out with new functions critically important to leading British cities in the second half of the nineteenth century. In Table 7, we list institutions and meeting places that facilitated movement of ideas – commercial, scientific, cultural and political. Only 1883 features in this table because, despite its early importance in the book trade and the existence of the Literary & Philosophical Society, Newcastle, in 1801 did not have this type of sector in any developed way. The only overlaps with the 1801 Directory are seven booksellers and three coffee rooms.Footnote 69 The 1883 list, topped by an impressive 71 societies and associations that do not include 10 trade protection societies and 7 literary and scientific institutions, is the nearest we can get through directories to the ‘buzz’ that must have been Newcastle at this time. In the nineteenth century, ‘Newcastle upon Tyne was a late arrival at the rich cultural feast enjoyed by other provincial centres’,Footnote 70 but in the latter part of the century it had ‘matured’ into a new modern city region and, in fact, had achieved the formal status of ‘city’ with the formation of the diocese in 1882. Whether this was cause or effect, ‘in the 1880s the air of confidence is unmistakeable’.Footnote 71 This is even more remarkable when one considers that the overall national context was one of relative depression. Such confidence was manifest in the patronage to art afforded by the leading industrialists,Footnote 72 the opening of the new public library in New Bridge Street in 1880, the inauguration of concerts by the Newcastle Chamber Music Society in the same year, the succession of annual art exhibitions held by the Arts Association from 1878,Footnote 73 succeeded by the formation of the Bewick Club in 1883, the construction of the Hancock Museum in 1884 and, above all, the Mining, Engineering and Industrial Exhibition in 1887.Footnote 74 Although it was originally intended to be on a site of only 5 acres, its area had to be expanded to 30 acres and the event attracted one and a quarter million visitors between 11 May and 31 August. Whilst it is true that several of Newcastle's other leading institutions were of considerable age, the later nineteenth century witnessed a self-conscious expansion of most of them. Thus, the Newcastle Lit & Phil, formed in 1793, made strenuous efforts to expand its membership in the later nineteenth century. In 1883, the Newcastle Society of Antiquaries (founded in 1813) leased the Blackgate from Newcastle City Council to house its museum and proceeded to re-design the structure for this purpose. The Natural History Society (founded 1829) expanded its activities enormously by moving to the Hancock. All these establishments and expansions show that the Newcastle city region had taken on the metropolitan culture of a great Victorian city.Footnote 75
What's new? Institutions and meeting places, 1883
Source: Derived from Kelly's Directory of Newcastle, Gateshead, Sunderland, North and South Shields and Suburbs (1883).
Although most often represented in the form of Lord Armstrong, this Newcastle/Tyneside modernity was typified much more in the person of Joseph Cowen jnr, manufacturer, radical MP, imperialist, promoter of cultural facilities for the working class (public libraries, theatres), pioneer in the Co-operative movement,Footnote 76 but above all, press baron whose ‘management style accorded perfectly with. . .a modernisation process’.Footnote 77 In his appreciation of the role of the mediaFootnote 78 and his promotion of technological and management innovations, Cowen embraced and enhanced the reality of Newcastle as a progressive, modern city with a strong sense of its own identity. But he was not alone.
A brief case-study of one ‘new’ institution that epitomizes this new status is used to exemplify the emergence of a self-conscious ‘metropolitan culture’ in late nineteenth-century Newcastle. Venerable institutions though they were, many of the organizations mentioned above were what one might expect in a large urban centre. Rather more unexpected was the Tyneside Geographical Society,Footnote 79 established in 1887 as only the third provincial geographical society in Britain.Footnote 80 Although the Society was established ostensibly for commercial reasons, it soon came to represent a new consensus of the importance of associational culture for any ambitious metropolitan centre. Thus, although a key player was G.E.T. Smithson, managing clerk of Scott Brothers, shipbrokers and general merchants (note the diversification evident here), and other Quayside businessmen were instrumental, they were joined in the endeavour by figures as varied as the Reverend F.O. Sutton, curate of All Saints, a retired marine service officer, Captain Watkins, the lawyer and local historian F.W. Dendy and a medical practitioner Dr W.G. Black. This was not just a group with an interest in ‘geography’ as a hobby; they saw the subject in educational and representational terms and recruited the region's elite to support this endeavour. Its role was to educate the region's citizens, primarily with commercial objectives, at home but more particularly abroad. This also had its practical side through the support given to exploratory expeditions and the opening up of trade routes, for example Captain Joseph Wiggins in Siberia. But there was also a more subtle purpose that involved demonstrating to the ‘outside world’ that Newcastle/Tyneside warranted such an organization, an organization that could attract international names such as Stanley, Churchill, Nansen, Amundsen, Mackinder, Ravenstein and Scott.
But more significantly, this mission also implied going beyond providing a stage for travellers, missionaries, explorers and commercial adventurers. The Society also saw itself as part of the cultural and intellectual infrastructure of the region, providing a forum for progressive international figures as varied as Arminius Vambouray, a Hungarian expert on the Ottoman Empire, who was also a British agent and spy working for British interests in Turkey against Russian expansionism; Lilly Grove, author of what remains one of the standard books on the world-wide history of all forms of dance; Minas Tcheraz, Professor of Armenian at Kings College, London, a poet and activist for Armenian causes; Gertrude Bell, traveller, archaeologist and diplomat in the Middle East and a founder of the modern states of Jordan and Iraq; Mary Kingsley, ethnographer and influential writer on West African cultures and whose empathy with native African cultures led some to regard her as a dangerous anti-imperialist; Aylmer Maude, translator and friend of Tolstoy and a famed campaigner for progressive causes; and Budgett Meakin, lecturer on ‘industrial betterment’ and author of Model Factories and Villages (1905).Footnote 81 This exciting and challenging programme was almost certainly the main reason for the Society's spectacular growth from 213 members in its first year to 768 three years later and a peak of 1,327 at the end of its first decade of existence. ‘Satellite’ societies were also established at South Shields, Tynemouth, Hexham and Durham.
All this strenuous cultural and associational activity bears witness to a city anxious to present itself as something other (or as well as) an industrial metropolis. The city region is being ‘rounded out’ with a full complement of appropriate ‘city’ institutions and the growth of a stronger sense of its own identity (real or imagined) in relation to both the present and the past.
Conclusions
Unusually, we conclude with a specific small case-study: it is chosen as a succinct summary of our basic argument. Briefly outlining the early history of A. Reyrolle & Co. Ltd, one of Tyneside's outstanding electrical engineering manufacturers at the conclusion of Newcastle's long nineteenth century, provides a feel for the importance of Newcastle city region and how it relates to the approach we have adopted in this article. Reyrolles started up in London in 1886 as a small switch gear workshop, but moved to Tyneside (Hebburn) in 1901 to be at the innovation centre of Britain's electrical engineering. The company became ‘world-famed for development of the metal-clad switch gear’;Footnote 82 the product of this new work was first installed in a sub-station for Swan & Hunter works (Wallsend) in 1906. Reyrolles reaped the benefit of their ‘hard and intensive (development) work’ by becoming the sole manufacturers, for more than a decade, of a design that was to become universally used. Subsequently, the product was ‘made by manufacturers throughout the world’ as production of the Newcastle innovation diffused through other cities as new work from import replacing. This is an explicit example of the urban growth process we have described in this article: Newcastle is contributing a key innovation to networks of vibrant industrial cities some hundred years or so ago.
The nineteenth-century economic history of Newcastle/Tyneside is well recorded, but this is mainly from an internal perspective. What fascinates us is the bigger picture combining two inputs from outside urban history scholarship. First, we have located where Newcastle fits into an increasingly integrated world of cities at the end of the British industrializing era, and second, we used an interpretation that treats cities themselves as the producers of economic growth, not the products. It is only through this perspective that we can fully appreciate how fundamentally different Newcastle was in its internal and external relationships in the late nineteenth century compared to the city's starting point as an ‘Indies’. Through a brief period of ‘explosive’ growth, Newcastle came to be the focus of a functioning multi-nodal city region with a complex division of labour, where new work was generated through innovation and problem solving and where its increasing size and complexity were themselves the principal drivers of new patterns of production and consumption.