Implications
Agronomics sees the mixed crop–livestock (MC–L) system as ideal, but there is a gap between the conceptual model and the real world. There are differences between ‘specialized livestock farms’, ‘integrated crop–livestock farms’ and ‘mixed crop–livestock farms’, and the most efficient systems are not necessarily MC–L farms. The upshot is that, whether on the economic front or the environment front, conventional beef cattle farms appear unable to translate a MC–L strategy into economies of scope. Organic agriculture, however, could be considered a prototype MC–L system meeting the core principles of agroecology.
Introduction
Over the last 50 years, agriculture has outstripped every other sector of the French economy in terms of increasing labour productivity (Charroin et al., Reference Charroin, Veysset, Devienne, Fromont, Palazon and Ferrand2012). These productivity gains have been achieved through greater use of inputs and higher capital investments. This evolution driven by integrating industrial-scale factors of production (Mounier, Reference Mounier1992) has triggered a shift towards increasingly productive specialized farming systems and away from mixed crop–livestock (MC–L) systems. Up until the 1950s, MC–L was the dominant farm system in France (Mazoyer and Roudart, Reference Mazoyer and Roudart1997) where livestock and crops were strongly integrated: crop rotations integrating grassland provided feed for the livestock, which, in turn, provided organic fertilizers and draught power for tilling the land.
Although losing ground in Global-North agriculture (i.e. in Organisation for Economic Co-Operation and Development developed countries), MC–L farming, nevertheless, enjoys broad consensus as an economically and environmentally sustainable farming system (Ryschawy et al., Reference Ryschawy, Choisis, Choisis, Joannon and Gibon2012). This consensus essentially revolves around the potential gains of MC–L systems over specialized systems. Integrating crops and livestock could limit natural resource degradation (reducing mineral leaching through adapted crop rotations), increase the profitability and stability of farm income (less inputs use and product diversification), and increase environmental sustainability (animal manure recycling, soil fertility and carbon sequestration) (Russelle et al., Reference Russelle, Entz and Franzluebbers2007; Hendrickson et al., Reference Hendrickson, Hanson, Tanaka and Sassenrath2008b). These potential gains are evaluated on the basis of core concepts in agronomy and economics (Vermersch, Reference Vermersch2004; Hendrickson et al., Reference Hendrickson, Sassenrath, Archer, Hanson and Halloran2008a). The theoretical model of MC–L farming is thus considered eco-efficient (both ecologically and economically) (Wilkins, Reference Wilkins2008) and could therefore meet the core principles of agroecology (Dumont et al., Reference Dumont, Fortun-Lamothe, Jouven, Thomas and Tichit2013).
MC–L systems and their advantages are now well characterized for smallholders in the developing countries (Asia, Africa). These systems demonstrate complementarity in resource use, where inputs from one sector are supplied to others and animals make key contributions to increased production, income generation and improved sustainability of cropping systems (Devendra and Thomas, Reference Devendra and Thomas2002; Dugue et al., Reference Dugue, Kone, Kone and Akindes2004; Herrero et al., Reference Herrero, Gerber, Vellinga, Garnett, Leip, Opio, Westhoek, Thornton, Olesen, Hutchings, Montgomery, Soussana, Steinfeld and McAllister2011). Refocusing on the Global North, Franzluebbers and Stuedemann (Reference Franzluebbers and Stuedemann2007) investigated the social barriers limiting the expansion of MC–L systems in the United States, whereas Bell and Moore (Reference Bell and Moore2012) underlined limits to crop–livestock systems on diversified farms that simply juxtapose two independent components that are easier to manage than a complex integrated system. The potential eco-efficient performances, in harmony with agroecological principles, of the MC–L systems entail strong interactions between the plant and animal components of the system (Dumont et al., Reference Dumont, Fortun-Lamothe, Jouven, Thomas and Tichit2013; Bonaudo et al., Reference Bonaudo, Bendahan, Sabatier, Ryschawy, Bellon, Leger, Magda and Tichit2013). Very little research has gone deeper than the conceptual level to evaluate the real efficiency of these systems, using data sets compiled from real farm businesses.
In France, MC–L systems are essentially located in less-favoured areas (Choisis et al., Reference Choisis, Sourdril, Deconchat, Balent and Gibon2010) where a significant share of farmland is untillable and consequently used as permanent grassland for grazing livestock. In these areas, farmers could not specialize their farming systems with cash crops, and thus they ploughed what area they could, and maintained livestock to exploit the non-tillable land. Over the last 20 years, coupled and decoupled aids and subsidy supports under the first and second ‘pillars’ of EU Common Agricultural Policy (CAP) have enabled farms to maintain permanent grasslands and cattle herds in these less-favoured areas (Veysset et al., Reference Veysset, Bebin and Lherm2005a; Chatellier and Guyomard, Reference Chatellier and Guyomard2011).
One such less-favoured pasture-based area is the Massif Central – a major beef-producing region of France that supports over 35% of the national suckler-cow herd. The northern border of the Massif Central is a zone of foothills and grassland plains that contours the cradle of the Charolais cattle breed (41% of the total French Charolais cows are located in this Charolais area). Charolais-area suckler cattle farms present a fairly diverse palette of farm systems (Veysset et al., Reference Veysset, Lherm and Bebin2005b), spanning pasture grazing, MC–L, calf-to-weanling/store systems, calf-to-beef systems and certified organic agriculture. Working on technical, economic and environmental data compiled on a suckler cattle farms network, our research aims to investigate and analyse differentials between four groups of farms: (i) specialized conventional livestock farms (100% grassland-based farms (GF)); (ii) integrated conventional crop–livestock farms (specialized farms that only market animal products and grow cereal crops to feed their animals); (iii) mixed conventional crop–livestock farms (farms that sell beef and cereals); and (iv) organic farms. We begin by sorting farms and then we compare the structure and the technical, economic and environmental performances of each group. The observed differences and their drivers are discussed, and we conclude by addressing considerations on how to enhance the eco-efficiency of mixed crop–suckler cattle farms.
Material and methods
The database: the livestock farm performance monitoring network
In the 1970s, the INRA (French national institute for agricultural research) Clermont-Theix centre set up a technical–economic performance monitoring network on Charolais suckler cattle farms in central France. The aim of this network is to identify and analyse the potential of these livestock production systems and gain insight into the factors driving their performances and evolution. In 2011, the network panel included a constant sample of 66 farms with a 2-year follow-up.
Annual surveys collect over 300 data items spanning labour (family, salaried and interim workers), herd (calvings, animal transfers, liveweight), surface areas (cropping system, pasture management), farm equipment (full inventory), farm buildings and facilities, intermediate consumption (quantities and prices), sales (animal/crop types, quantities and prices), aids and subsidies (coupled, decoupled, single farm payments), and investments and borrowing. These data are used to calculate farm-by-farm figures for over 3000 technical–economic variables for each farm-on-farm structure, herd performances, unit margins of the individual activity centres (cattle, crops), and all the economic results and ratios. In 2010, we began collecting the additional data needed to calculate greenhouse gas (GHG) emissions and non-renewable energy (NRE) consumption figures.
The analysis reported here focuses on a constant group sample of 66 farms tracked over 2 years – 2010 and 2011 – and split into 59 conventional farms and 7 certified organic farms.
Sort variables and groups formed
To split the subsample of 59 conventional farms into the specialized grass-system cattle farms and the essentially MC–L farms that are relatively specialized in cattle and/or cash crops, we classified them with respect to two variables: (i) the fraction of main forage area (MFA, year-round pasture and forage area) to utilized agricultural area (UAA), and (ii) the fraction of total area dedicated to the cattle herd (haCatt=forage area plus area of annual on-farm crops integrated, i.e. sidelined for cattle feed). The sorting on the MFA fraction allowed us to distinguish farms that allocate their entire UAA to fodder (and therefore the herd) from those that farm annual crops. Among the farms allocating a portion of their UAA to annual crops, sorting on the fraction of the total acreage dedicated to the herd allowed us to distinguish the farms that allocate all grain to their livestock (not for sale, or just a residual stock of under 5% of yield) from those selling annually farmed grain.
The conventional farms were subdivided into three groups:
-
− 100% GF. This group includes seven farms where the entire UAA is grassland. Only two are in upland territory, with the remainder in a predominantly MC–L zone (foothills and piedmont area), and they elect not to produce crops.
-
− Specialized farms that only market animal products but that grow cereal crops on-farm for animal feed (B/c). This group includes 31 farms, where MFA covers 89% of UAA, which leaves 11% of UAA allocated to on-farm feed crops. Thirteen of these farms (42%) are in the foothills and piedmont area.
-
− MC–L farms that sell both beef and cereal crops to market (B+C). This group counts 21 farms where MFA covers only 68% of UAA. Of the 32% of UAA allocated to annual crops, one-third is consumed on-farm by the herd (on-farm concentrate feed) and two-third is sold to market (cash crops). Overall, 77% of UAA is allocated to livestock (haCatt) and 23% to cash crops.
These three groups were formed using the values generated by the two sorting variables on year 2011 figures. We then ran year 2010 figures to verify that each of these three groups effectively counted the same farms. The two year groups converged perfectly.
A fourth group was formed representing the seven organic farms. These farms were all certified organic (EU, 2007) for more than 10 years at whole-farm scale (land and herd). Compared with the conventional practices observable in the Charolais area, the main differences imposed by the EC regulations are: (i) all chemical inputs banned (fertilizers, pesticides), (ii) the obligation to feed livestock with certified organic forages and concentrates, (iii) young bulls (aged <2 years) cannot be fattened owing to the 40% limitation on concentrates in the diet. The other constraints are routine in traditional Charolais systems (Benoit and Veysset, Reference Benoit and Veysset2003): practice of land-related livestock production, animals get access to pasture (except in winter), natural servicing without hormone use, non-use of genetically modified organisms, no automatic allopathic veterinary medicine and suckling calves fed with maternal milk. Only 1 of these 7 farms was 100% grassland. Overall, for the six other organic farms, annual crops cover an average 13% of UAA (range: 8% to 25%) and are primarily consumed as on-farm fodder. Three farms sell 40% of their crops that they manage to produce using just 8% of their UAA. All the organic farms are highly specialized beef cattle farms, with 95% of their total hectarage allocated to the herd.
Expression and analysis of results
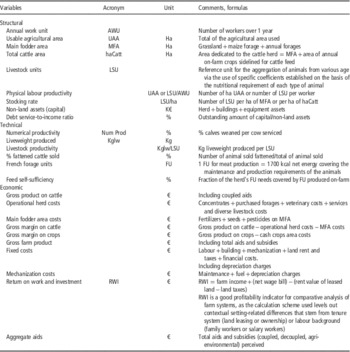
We ran a systemic analysis of the farm systems represented by the four identified groups. The study was conducted by comparative analysis of the main sets of variables (Table 1):
-
− structural variables: size, labour productivity, capital investment, cropping system and stocking rate,
-
− animal performance variables: numerical productivity, kg of beef liveweight, and type and weight of animals sold,
-
− forage system and diet: hay, silage and concentrates,
-
− economic performance: gross margin on cattle, infrastructure costs, farm income per worker and aids per worker,
-
− environmental performance: apparent nitrogen (N) balance of the farm excluding N mineralized and N fixed by legumes (Simon and Le Corre, Reference Simon and Le Corre1992), GHG emissions and NRE consumption. The GHG emissions and NRE consumption variables were calculated using the life cycle analysis method with input data collected at each individual farm (Veysset et al., Reference Veysset, Lherm, Bebin, Roulenc and Benoit2013a). The system boundary encompassed the entire ‘cradle-to-farm gate’ system integrating all of the processes upstream of farm production down to the moment product leaves the farm gate. The analysis integrated two levels of impacts: (i) direct impacts tied to on-farm production processes and activities; (ii) indirect impacts tied to the manufacture (off-farm) and transport of all intermediate consumption, services and fixed assets needed as input to the production system. The main GHG emission source factors mobilized in French assessments of grazing livestock systems are borrowed from the GES’TIM approach (Gac et al., Reference Gac, Deltour, Carriolle, Dolle, Espagnol, Flénet, Guingand, Lagadec, Le Gall, lellahi, Malaval, Ponchant and Tailleur2010b). Carbon (C) sequestration and/or release tied to farmland use (grassland, cropland) and land-use change (ploughing) was also integrated into the system boundary. Values adopted for net carbon storage–carbon release balance calculation, adapted from Gac et al. (Reference Gac, Dolle, Le Gall, Klumpp, Tallec, Mousset, Eglin and Bispo2010a) and Arrouays et al. (Reference Arrouays, Balesdant, Germon, Jayet, Soussana and Stengel2002), were: permanent grassland: +350 kg C/ha per year, temporary grassland renewed every 5 years: +300 kg C/ha per year, temporary grassland under rotation with crops: −71 kg C/ha per year, annual crops under rotation or not: 0 kg C/ha per year. The energy coefficients were borrowed from the Dia’terre® calculated method used for agricultural energy-GHG audits (ADEME, 2010). This approach required to compile further complementary information to record certain missing data not needed for routine annual technical–economic performance calculations: farm equipment characteristics, characteristics of livestock buildings and manure storage structures, manure management and dates each animal batch is turned out to pasture/brought back to stall (time spent in-barn and quantities of manure to be stored and handled).
Main sets of structural, technical and economic variables used for the comparative analysis

Each sample included relatively few observations (only seven for GF), making it difficult to assume the hypothesis of a normal intra-group distribution. Thus, parametric statistical analysis did not appear appropriate. We did not observe any system shocks between the 2 years (weather, health, epidemic, market). A non-parametric Mann–Whitney two-sample comparison test showed that the means of the main structural variables (size, herd, mechanization), beef production variables (kg produced) and environmental impact variables (N, GHG and NRE balances) were not significantly different between 2010 and 2011 in each group. The figures for all the farms for both years were pooled into a single sample for each group. Analysis thus focused on the means of 14 observations on the GF group, 62 observations on the B/c group, 42 observations on the B+C group and 14 observations on the organic group.
Even after pooling the data from the 2 years, the size of each group remained too low to validate a normal distribution hypothesis. Fixed effects on the farms are captured by the four identified groups. To account for intra-group variability, we ran a non-parametric Kruskal–Wallis test for pairwise sample comparisons to determine whether or not the groups shared identical characteristics in terms of data distribution and median value. When there were different mean values on a given variable, intra-group variability and data heterogeneity could lead to medians with little if any difference, and ultimately point to the conclusion that the two groups were not statistically different. All results are presented as means (not medians), as means are usually used to express and comment the value of a variable for a farms group.
Results
Structural factors
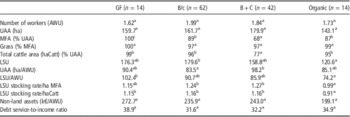
The farms in this Charolais-based network were all large-size farms, at 165 ha on average. The French national average for beef cattle farms in 2011 was 104 ha (Agreste, RICA (farm accountancy data network), Chantry, Reference Chantry2003). Organic farms were the smallest and B+C farms largest, but overall the four groups were not significantly different (Table 2). Capital used per worker was lowest for organic farms and highest for GF farms, but ultimately all had heavy investment regardless of farm structure.
Mean structural characteristics of the four groups over 2 years (2010 to 2011)

GF=grassland farms; AWU=annual work unit; UAA=usable agriculture area; MFA=main fodder area; LSU=livestock units.
a,b,c Same row values with different letter superscripts indicate groups from statistically different populations at P<0.05.
As the three conventional-system groups were formed on the basis of two sorting variables, the cropping systems logically emerged as significantly different: cash crops reached 23% of UAA for B+C farms, whereas organic farms allocated 9% of UAA to on-farm feed crops, that is, a level comparable to B/c group farms. The GF, B/c and organic farm groups allocated practically all of their land to cattle production.
Organic and B/c farms emerged as similar in terms of hectarage (size and cropping system) yet different in terms of herd size. B/c farms had the biggest herds, at a headcount of 180 LSU, whereas organic farms come out ‘smallest’ at 121 LSU (the French national average herd size for beef cattle farms in 2011 was 112 LSU).
In terms of physical labour productivity, UAA per worker was the highest on beef farms producing cash crops (B+C) and lowest on B/c farms. Herd size per worker was the biggest on the 100% GF and smallest on organic farms.
Mean stocking rates were the highest on B/c and B+C farms, but with too much dispersion to statistically differentiate them from GF farms. Organic farms were largely extensive production systems, with a 20% lower stocking rate per ha MFA and per ha allocated to the herd than on conventional-system farms. Looking at the three conventional-system groups, beef farming emerged as more intensive on B+C farms if measured per ha of MFA (stocking rate is the effect driver), but there was no difference if measured per ha allocated to cattle.
Animal performance criteria and animals sold to market
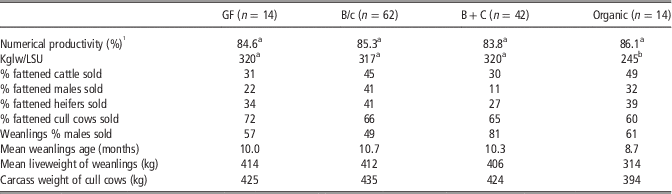
The reproduction criteria, captured through numerical productivity (Table 1), were identical across all four groups (Table 3). Livestock productivity (kglw/LSU) was not significantly different between the three conventional-system groups. The organic system was clearly outperformed (−23%) on this productivity criterion.
Animal performances (livestock yields) of the four groups over 2 years (2010 to 2011)

GF=grassland farms; kglw=kg liveweight; LSU=livestock units.
a,b Same row values with different letter superscripts indicate groups from statistically different populations at P<0.05.
1 Numerical productivity: % calves weaned per cow serviced.
Type of animals sold was measurably different between groups. Organic and B/c farms tended to fatten more animals, particularly males and heifers. On B/c farms, 92% of males fattened were bull calves, whereas on organic farms 75% of males fattened were steers. The 100% grass farms tended not to fatten males but instead use their grassland to produce 15-month-old store males weighted on spring pastures (13% of males sold). The B+C farms practically never fattened up their males, instead selling over 80% of them as weanlings. Liveweight of weanlings sold to market and carcass weight of fattened cull cows were virtually identical across the three conventional-system farms. Organic farms were differentiated by their lighter animals (organic weanlings and cull cows weigh −23% and −8% less, respectively).
Forage area, diet and cropland
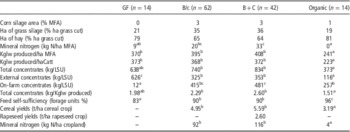
Corn silage was rarely if ever used on any of the farms in our sample population (Table 4). Consequently, grass was the staple fodder in cattle diets. The more grassland-oriented farms (GF and organic) cut grass as hay, whereas the farms that produced some corn silage (B/c and B+C) generally also silaged a fraction of their grassland, which means that – in theory at least, as silaged grass is cut earlier, at a better feed value stage, than hay – these B/c and B+C farms enjoyed better-quality stored forage.
Description of the forage system, mean feed components and crop yields of the four groups over 2 years (2010 to 2011)

GF=grassland farms; MFA=main fodder area; kglw=kg liveweight; LSU=livestock units.
a,b,c Same row values with different letter superscripts indicate groups from statistically different populations at P<0.05.
Despite having (theoretically) better-quality stored forage, the two groups that produced concentrate on-farm (B/c and B+C) were the two heaviest consumers of concentrate per LSU and per kg of beef produced. The GF group was logically the group that brought in the most concentrates. The B+C group, which had the largest crop hectarage, distributed the highest amount of self-produced concentrate and yet paradoxically did not buy less concentrate than the B/c group. On B/c and B+C farms, concentrate self-sufficiency (on-farm concentrate-to-total concentrate ratio) was 57%.
Organic farms used less concentrate per LSU (−40% to −50% less than conventional-system farms), regardless of whether the concentrates were brought in or produced on-farm. Organic farms ultimately used 35% less concentrate per kg of liveweight gain than conventional-system farms. Organic farms also had more self-sufficient concentrate, as 70% of their concentrate used was produced on-farm. GF farms, which had to buy in all concentrates, used it at an intermediate level between organic farms on one side and B/c and B+C farms on the other.
The herd’s energy needs were expressed in French forage units (FU) (INRA, 1988). Feed self-sufficiency in terms of FU (Table 1) (Paccard et al., Reference Paccard, Capitain and Farruggia2003) was the lowest on GF farms (83%) and highest on organic farms (96%).
Cereal yields and mineral N fertilization on cropland were not significantly different between the two conventional-system groups (Table 4). Cereal yields were 40% lower on organic farms than conventional-system farms, but without using mineral fertilization. The B+C group also produced rapeseed crops.
Economic performances
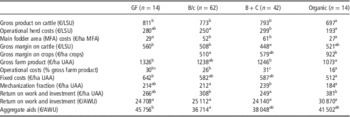
As a result of an increase in farm-gate meat prices between 2010 and 2011, gross product on cattle rose 10% year-on-year for all four groups, but without reversing the established order between groups. Gross product on cattle was not significantly different between conventional-system farm-groups, and was 10% lower in organic farms (Table 5) owing to the less productive average daily gain. However, the organic farms were far more frugal on operational costs (less concentrate used and zero mineral fertilizer) that represented only 16% of gross farm product v. 26% to 31% for conventional-system farms. Among the conventional-system farms, operational herd costs were lowest on B/c farms, with B+C and GF farms on a par. Operational MFA costs were highest on B/c and B+C farms owing to the production of corn and grass silage, and lower on GF farms. On balance, beef farms producing cash crops (B+C) got the lowest gross margin on cattle, whereas 100% GF got the highest (the differential is around 20%), with organic farms intermediate between the two groups.
Rolling 2-year average (2010 to 2011) economic performances of the four groups

GF=grassland farms; LSU=livestock units; UAA=usable agriculture area; AWU=annual work unit.
a,b,c Same row values with different letter superscripts indicate groups from statistically different populations at P<0.05.
Despite 40% lower yields, organic farms were able to get a better gross margin on crops in the 2 years studied, owing to organic cereal grain selling at twice as much as conventionally farmed cereal grain in 2010 and 2011, yet produced with far fewer input costs (zero mineral fertilization and zero pesticides).
Gross farm product (aids and subsidies included) per ha UAA was similar across the three conventional-system groups, but 15% to 20% lower on organic farms because of a lower productivity per ha. Fixed costs per ha of UAA were highest on the 100% GF and lowest on the organic farms (with a 20% differential). B/c and B+C farms shared the same intermediate level of fixed costs. Mechanization accounted for 35% to 40% of these fixed costs. Mechanization costs were the highest on B+C farms and lowest on organic farms.
Returns on work and investment (RWI, Table 1) per ha of UAA rose an average 20% between 2010 and 2011. This jump was stimulated by an increase in gross margin on cattle together with drought relief subsidies paid out by the government that more than offset the increase in external forage feed and concentrate expenditures. Ultimately, in both 2010 and 2011, it was organic farms that showed the best RWI per ha of UAA. GF and beef farms producing cash crops (B+C) showed the lowest RWI per ha. The 2-year average RWI per ha was €381/ha for organic farms v. €249/ha for B+C farms, that is, 53% higher income for organic v. beef-plus-cash crops.
RWI per worker increased between 2010 and 2011, and then evened out in 2011. On average, over the 2 years studied, RWI per worker was 20% higher on organic farms than on conventional-system farms, but there was too much variation in the data subset to identify any clear between-group differences. Physical labour productivity offset the per ha income gaps. At 13 ha more (+15%) per worker, the B+C farms closed some of the €130/ha gap with organic farms, but, nevertheless, still fell short by an average 6000 €/AWU.
Total amount of aids and subsidies per worker was highest for 100% GF and lowest for B/c farms. Flat-rate entitlement under the Single Farm Payments scheme (SPS) was identical for all three conventional-system groups, at €227/ha UAA. Organic farms got 10% less SPS as they had lower stocking rates. Aid entitlements under the CAP second pillar (green grassland premium, hill livestock compensatory allowances scheme, support for organic farming) were then picked up on top of the aid entitlements under the CAP first pillar for organic and GF farms. GF farms registered the strongest 2010 to 2011 jump in aids because of the drought relief subsidies they picked up. As these drought relief subsidies were only paid out on forage area and only on a pro rata basis of forage area-to-UAA ratio, GF farms logically received more of these subsidies than beef farms also producing cash crops.
Environmental performances
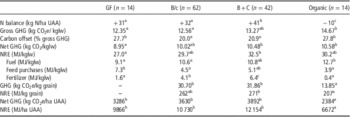
With higher mineral fertilization per ha MFA and per ha UAA than the other conventional-system farms without concomitant more intensive beef production, the B+C farms had the highest (although at a reasonable level) surplus of farm-scale apparent N balance, excluding symbiotic N fixation by legumes (Table 6). Organic farms showed a negative N balance (−10 kg/ha UAA), which means legumes had a major role to play in the agronomic sustainability of these systems.
Rolling 2-year average (2010 to 2011) environmental performances of the four groups

N=nitrogen; GHG=greenhouse gas; NRE=non-renewable energy; GF=grassland farms; UAA=usable agriculture area; kglw=kg liveweight.
a,b,c Same row values with different letter superscripts indicate groups from statistically different populations at P<0.05.
Gross GHG emissions per kg beef liveweight were highest on organic farms owing to the lower weight gain of organic livestock and on B+C farms because of heavier use of inputs (chiefly leading to nitrous oxide emissions). With their higher grassland-to-UAA ratio, GF and organic farms were able to offset 28% of gross GHG emissions because of carbon storage in grassland soil (a carbon sink). Consequently, the net GHG emissions per kg beef liveweight produced were lower on GF farms, and the other three groups – organic included – ultimately showed no significant between-group differences.
The 100% GF also registered the lowest NRE consumption per kg beef liveweight produced. GF farms purchased all their concentrates, but they used less fuel and fertilizer than the other conventional-system farms. Organic farms recorded comparable levels of NRE consumption per kglw to B/c and B+C farms. The organic farms were differentiated by higher fuel consumption (tied to a less productive weight gain of organic livestock) but chiefly by their exceptionally low NRE consumption from external feeds, fertilizers and other petrochemical inputs. This non-use of chemical inputs paid off even stronger in GHG emissions and NRE consumption per kg of cereal grain, where organic farms emitted almost 60% less GHGs and consumed 20% less NRE than conventional-system farms, excluding GF. B/c and B+C farms showed similar results.
Net GHG emissions and NRE consumption recalculated per ha of UAA were not significantly different between the three conventional-system groups (although GF farms tended to have lower averages). Organic farms, marked by lower per ha productivity and less use of inputs, were strongly differentiated from conventional-system farms by 30% lower GHG emissions per ha and 40% lower NRE consumption levels.
Discussion
Over the decades, suckler cattle production systems have re-adapted to regular CAP reforms and changing market trends by constantly increasing farm size and physical labour productivity (Veysset et al., Reference Veysset, Lherm and Bebin2005b; García-Martínez et al., Reference García-Martínez, Olaizola and Bernués2009). MC–L systems have, nevertheless, held strong on certain farms. The main reasons for sticking to MC–L are driven by a strategy aimed at feed self-sufficiency for the herd and product diversification to secure steady income streams protected from market fluctuation and volatility (Ryschawy et al., Reference Ryschawy, Choisis, Choisis and Gibon2013). However, the management of such a complex farming system comes with a number of challenges.
Feed self-sufficiency and diversification of feed resources
Feed self-sufficiency is part of the value system shared by organic farmers (Veysset et al., Reference Veysset, Benoit, Belvèze, Patout, Reuillon, Morin and Vallas2013b), but it is also an economic necessity because of the high prices of certified organic concentrates. Average 2010 to 2011 transfer prices for conventional and organic cereals (from crop unit to cattle unit) were, respectively, €140 and €270/tonne. GF farms purchased compound feed, whereas organic, B/c and B+C farms needed to purchase protein supplement to add to their cereals, especially for fattening (organic soybean oil cake was priced at around €1000/tonne against just €450 for conventional soybean oil cake). Organic farmers preferentially purchased dried alfalfa. All in all, the average prices of total concentrates used were €200/tonne for B/c and B+C farms using their cereals, €240/tonne for GF farms having to buy in all their concentrates, and €280/tonne for organic farms using their cereals. Conventional farms also growing cereals on-farm logically achieved a higher farm-scale (forage plus concentrate) feed sufficiency for their herds than the 100% GF that had to buy in concentrates to cover their needs. However, as these MC–L farms enjoyed a feed resource (cereal crop) that GF did not, they tended to distribute more of it to their livestock, without getting significantly higher beef liveweight at the farm gate. This problem was aggravated by the fact that these same MC–L farms take advantage of their tillable farmland to cultivate corn fodder and temporary grassland that theoretically offers better feed value than permanent grassland. This tendency to feed greater quantities of home-produced cereal to livestock began in 1992 because of the CAP reform that led to price supports for cereal crop production, whether for on-farm or off-farm cereal crops (Veysset et al., Reference Veysset, Benoit, Belvèze, Patout, Reuillon, Morin and Vallas2013b). Today, despite the sharp hike in cereal prices that started in 2010, these practices remain in force. The increase in herd size per worker, along with the downstream sector demand pulling for more homogeneous ‘standard’ cattle weight and conformation, has incentivized farmers to streamline their management practices and distribute concentrate all year round to enable steadier and more secure animal growth, regardless of the quality of the forage available (Charroin et al., Reference Charroin, Veysset, Devienne, Fromont, Palazon and Ferrand2012). Among the MC–L farms, those specialized in beef production appeared to be more economical with their concentrate distributions than those producing beef alongside cash crops.
At 96% feed self-sufficiency on FU, it is the organic farms that most efficiently exploited the diversification of herd feed resources. One key performance driver here is that the organic farms did not grow pure cereal crops but mixed protein-rich cereal crops that offer a higher N value, the aim being to use these mixed crops to attain protein self-reliance. Protein crops also provide the soil with valuable N nutrition for the cereal crops.
Efficient inputs use and economies of scope
The potential economic and environmental value-added of the MC–L systems is tied to the concept of integrated crop and livestock units, which itself is tied to the concept of economies of scope (Vermersch, Reference Vermersch2004). Economies of scope occur when an operation that produces two (or more) different products can get higher average output volumes or lower average production costs than two (or more) separate operations each selling just one product (at a constant amount of factors of production). However, among the conventional-system farms, the mixed beef-plus-cereal (B+C) farms emerged as the heaviest users of inputs (chiefly concentrates and fertilizer) without getting significantly higher beef production than the specialized beef farms. Consequently, these B+C farms got slimmer gross margins per production unit while at the same time also trailing behind the other systems on environmental performances.
Thus, before moving to discuss integrated component streams or economies of scope, it is first necessary to address the technical efficiency issue. Working with the same combination of inputs, each farm reaches a certain production level that is not necessarily its optimal output. To tackle improving system efficiency, this output production level should be charted against a maximum achievable level so as to measure the scope for improvement. System efficiency can be measured using the data envelopment analysis (DEA) approach (Fraser and Cordina, Reference Fraser and Cordina1999; Gerdessen and Pascucci, Reference Gerdessen and Pascucci2013) that has already been used to highlight up to 34% potential input waste in sheep-for-meat production in France that explained a strong variability in economic and environmental farm performances (Benoit and Dakpo, Reference Benoit and Dakpo2012). In Greek dairy sheep farming, Theodoridis et al. (Reference Theodoridis, Ragkos, Roustemis, Arsenos, Abas and Sinapis2014) reported inefficiencies in the utilization of the current production technology and suggested that sheep farms, on average, could increase their gross output by 20.5% if all farms operated at full technical efficiency. If there is synergy to be found between the crop and livestock components, then DEA calculations of the production frontiers can be used to estimate the potential productive efficiency to be gained by this synergy (Villano et al., Reference Villano, Fleming and Fleming2010).
The MC–L system should also be able to share and pool certain factors of production across the different component streams. The key example is mechanization, which should be easier to amortize over several component streams. Here again, B+C farms not only fail to make savings but actually showed higher mechanization expenditures per ha than the other system groups. Ultimately, the B+C farms appear to be less efficient as a system, and can be considered as simply balancing two independent subsystems, each of which is managed sub-optimally compared with specialized farms.
A similar pattern was found in dairy farming (Perrot et al., Reference Perrot, Caillaud and Chambaut2012), where production costs (excluding pay to family labour) per litre of milk output were slightly higher on MC–L dairy farms than other dairy farms in the same French lowland areas. The MC–L farms created extra operational costs as their strategies failed to prioritize feed self-sufficiency, but they were able to bounce back on production costs – labour included – thanks to better labour productivity. The underlying trend towards intensification with increased inputs use on MC–L farms resulted in a heavier environmental impact per litre of milk produced (GHG emissions, eutrophication, energy consumption). Ripoll-Bosch et al. (Reference Ripoll-Bosch, Joy and Bernués2013) (in this special issue) observe the same trend in less-favoured areas in southern Europe: economic profitability of sheep farms was not related to the diversity of production or to animal productivity, and the main driver of farm sustainability was the low dependency on off-farm inputs and thus feed self-sufficiency.
The upshot is that, whether on the economic front or the environmental front, conventional beef cattle, sheep and dairy farms appear unable to translate a MC–L strategy into economies of scope. Organic agriculture, however, could be considered a prototype of an MC–L system meeting the core principles of agroecology (Abreu et al., Reference Abreu, Bellon, Brandenburg, Ollivier, Lamine, Darolt and Aventurier2012).
Encouraging a complex farming system
Agronomics sees the mixed crop–beef livestock system as an ideal founded on results from an array of studies focused on biophysical processes at plot or component-stream scale. Once we change angle to farm holding scale, there is a gap between the conceptual model and the real world. Among the beef cattle farms in our sample, some grow cereal crops exclusively to feed their livestock, some grow a share for feed and a share sold to market, whereas others may sell their entire cereal crop and buy in concentrate feed. An MC–L farm is conventionally defined by the fraction of livestock diet covered by on-farm crops and the fraction of other non-livestock activities as a proportion of total farm production (Sere et al., Reference Sere, Steinfeld and Groenewold1996). It is important to decide how cereals should be accounted for according to their end purpose and how the integration of crop and livestock units should be quantified. A key point for optimal performances in MC–L systems is the increase of interactions among the components of the system (Tichit et al., Reference Tichit, Puillet, Sabatier and Teillard2011).
Mixed and integrated crop–livestock farming are complex systems. The presence of economies tied to farm size is a driver of specialization – a feature further encouraged by price ratios, especially the fast increase in the price of labour relative to other factors that led to this generalized specialization of farming (Dupraz, Reference Dupraz1997). This trend has not hitherto been challenged by public policy. Faced with the need to increase labour productivity, farmers tend to simplify their practices and to manage the crop unit and the cattle unit independently (Bell and Moore, Reference Bell and Moore2012). This simplification of practices could have negative effects on technical performances (Agabriel et al., Reference Agabriel, Farrie, Pottier, Note and Pomies2012). MC–L farms that sell both beef and cereal crops to market use more inputs than specialized farms, probably owing to the fact that each production unit is managed ‘independently’. Chemical inputs offer security and an easy way to simplify labour, but are not the best way to optimize livestock performances and profitability. Organic farms are not allowed to use chemical inputs, the inputs they are allowed to use (feed) remain very expensive, and therefore they are pushed to use more integrated practices and, ultimately, to optimize their production system.
Even if we show that well-managed MC–L farming systems could lead to better performances (technical, economic and environmental), there are barriers to their expansion. Barriers to the adoption of integrated crop–livestock production systems are considered to stem more from social influences (tradition as a protocol for agricultural production, professional environment, extension services, industry demands) than from biophysical limitations (Franzluebbers, Reference Franzluebbers2007), but these social dimensions could be overcome with training and experience over time.
The detailed analysis of agricultural production systems requires the availability of sufficient field data. The acquisition of these data is very costly (time and money), and sorting farms in different groups leads to small sample size, with a large intra-group heterogeneity, limiting the use of statistical significance tests. Our results analysis and comments are strengthened on expert opinion. Whereas our results are based on full surveys within a Charolais farm network allowing to take account of the diversity of beef cattle farms within a given area, other frameworks such as the Farm Accounting Data Network (http://ec.europa.eu/agriculture/rica/index_en.cfm) or the AgriBenchmark network (http://www.agribenchmark.org/home.html) only collect information from a few farms that are representative of the most classic type in each production system. The environmental results, especially the GHG emissions, depend on methodology choices (level of emission factors, land-use change and carbon sequestration); these results could evolve with the improvement of the life cycle assessment methodology and with the knowledge about this new and complex field of research.
Conclusion
MC–L farming is usually regarded as a virtuous farming system. Working on 66 suckler cattle farms based in the Charolais area, we showed that conventional MC–L farms are less efficient than beef-specialized farms. These large MC–L farms miss out on potential economies of scale, but they show comparable income per worker with specialized farms; physical labour productivity offsets the lowest production system efficiency. The environmental performances of the specialized farms are better, even for the 100% GF that are not self-sufficient for concentrates. Organic farms most efficiently exploit the diversification of herd feed resources (grassland, cereals, protein-rich plants). Therefore, organic farming can be considered as a prototype of MC–L system meeting the core principles of agroecology.
The transition from real-world practice to agronomic ideal would involve a major change. Making the transition from studying biophysical processes at plot or animal scale up to farm business scale will hinge on research, higher education, vocational training and learning to adopt long-term systemic cross-disciplinary approaches. Public policy also has its role to play. The aim could be to bring incentives that support integrated farm production systems that use their factors of production efficiently while at the same time reducing incentives that drive further expansion. One way could be switching from uncapped subsidies per worker to regressive subsidies (with the farm size) and enhancing agro-environmental schemes and payments.
Acknowledgements
The authors would like to thank the farmers who kindly provided the yearly data from their registers to complete this study.