Implications
Dairy products are an important source of iodine for humans, especially children, whose intake of salt may be limited. Iodine supplementation to lactating goats increased milk iodine concentration without influencing animal performance. The current paper highlights the hormonal responses and metabolic status of the lactating goats supplemented with iodine. Iodine supplementation to goats reduced the blood and milk urea nitrogen and improved the insulin sensitivity of tissues. This could be important for managing metabolic disorders in lactating animals, especially in those that experience a negative energy balance.
Introduction
Iodine is essential for humans and animals, especially because it is involved in the synthesis of the thyroid hormones (TH), triiodothyronine (T3) and thyroxine (T4). Even though most of the circulating T3 and T4 are bound to proteins and only a small amount of them is unbound or ‘free’, only the ‘free’ TH portion is able to penetrate into the cells and influence their function (Todini, Reference Todini2007).
Iodine deficiency is detrimental to humans and animals. In European populations characterized by mild iodine deficiency, neurological deficit has been observed in children (Vitti et al., Reference Vitti, Rago, Aghini-Lombardi and Pinchera2001; Delange, Reference Delange2002; Costeira et al., Reference Costeira, Oliveira, Ares, Roque, de Escobar and Palha2010). In ruminants, iodine deficiency has been associated with late fetal development, early embryonic mortality, abortions, stillbirths, births of weak newborn, prolonged gestation, placental retention (Hetzel and Mano, Reference Hetzel and Mano1989; European Commission (EC), 2002; Ferri et al., Reference Ferri, Ulisse, Aghini-Lombardi, Graziano, Di Mattia, Russo, Arizzi, Baldini, Trimboli, Attanasio, Fumarola, Pinchera and D'Armiento2003) and decreased fetal brain weight (Potter et al., Reference Potter, Mano, Belling, Martin, Cragg, Chavadej and Hetzel1984). In growing lambs, iodine deficiency reduces growth and interferes with sexual maturity (Sokkar et al., Reference Sokkar, Soror, Ahmed, Ezzo and Hamouda2000).
In lactating animals, the mammary gland contributes substantially to iodine excretion (Miller and Swanson, Reference Miller and Swanson1963; Lengemann, Reference Lengemann1970). The iodine supplementation of dairy animals increases the iodine content of milk (Antonangeli et al., Reference Antonangeli, Garzella, Mele, Martini, Grasso, Andreotti, Cavaliere, Scatena, Secchiari and Aghini-Lombardi2000; Nudda et al., Reference Nudda, Battacone, Decandia, Acciaro, Aghini-Lombardi, Frigeri and Pulina2009; Moschini et al., Reference Moschini, Battaglia, Beone, Piva and Masoero2010) and can enhance the supply of iodine to suckling animals and humans. Iodine supplementation can also modify the function of the thyroid gland through the secretion of TH (Pattanaik et al., Reference Pattanaik, Khan, Varshney and Bedi2001; Randhawa and Randhawa, Reference Randhawa and Randhawa2001; Qin et al., Reference Qin, Zhu, Zhang, Zhou, Zhang and Jia2011). The TH regulate basal metabolism, stimulate protein synthesis and increase lipid metabolism. These hormones also stimulate the intestinal absorption of carbohydrates, the glycogenolysis and gluconeogenesis (Debenedetti, Reference Debenedetti1998). Therefore, the circulating TH are useful indicators of the metabolic and nutritional status of animals (Todini et al., Reference Todini, Malfatti, Valbonesi, Trabalza-Marinucci and Debenedetti2007).
Our previous paper reported the effect of long-term iodine supplementation on milk iodine concentration without influencing milk production and composition in dairy goats (Nudda et al., Reference Nudda, Battacone, Decandia, Acciaro, Aghini-Lombardi, Frigeri and Pulina2009). Some studies with goats fed goitrogenic feeds have dealt with the effects of iodine supplementation on TH (Haque et al., Reference Haque, Varshney, Khan and Lal1996; Pattanaik et al., Reference Pattanaik, Khan, Varshney and Bedi2001 and Reference Pattanaik, Khan, Mohanty and Varshney2004) and some blood metabolites (i.e. glucose and cholesterol; Pattanaik et al., Reference Pattanaik, Khan, Mohanty and Varshney2004). However, most of such studies were carried out on wool and meat goat breeds using mainly male animals. To our knowledge there is a lack of studies about the effects of iodine supplementation on hormonal status and blood metabolites involved in the energy metabolism of dairy goats. This work aimed to evaluate if long-term iodine supplementation to lactating goats could alter their hormonal status and blood parameters related to energy metabolism.
Material and methods
Animals and diets
The trial followed the EC Council Directive (86/609/EEC) that regulates the use of animals for experimental and other scientific purposes in the European Union (EC, 1986). Thirty Sarda crossbred goats in mid lactation (mean ± s.d.: 113 ± 3 days in milking) were randomly assigned to three experimental homogeneous groups on the basis of live weight (44.4 ± 1.4 kg) and milk yield (1284 ± 69 g/day). Animals were fed a commercial concentrate (0.7 kg/day per goat, as fed) individually administered during the two daily milkings (0800 h and 1600 h) as well as ryegrass hay (on average 1.4 kg/day per goat, as fed) split into two feedings, morning and evening, according to recommendations of the Institut National de la Recherche Agronomique (INRA, 1988). The experimental design and protocol were described in detail in a previous paper (Nudda et al., Reference Nudda, Battacone, Decandia, Acciaro, Aghini-Lombardi, Frigeri and Pulina2009).
During the 8-week experimental period, each goat was supplemented with potassium iodide (KI) at the following doses: 0 mg of KI/day (control group; CON), 0.45 mg of KI/day (low iodine group; LI) or 0.90 mg of KI/day (high iodine group; HI). These doses corresponded to a supplementation of 0.34 and 0.69 mg of I/day for the LI and HI groups, respectively, considering that KI contains 76.5% of I. During an adaptation period of 2 weeks before the experimental period, each group of animals was fed the corresponding experimental diet. During the trial, individual intake of concentrate and average group intake of hay were measured daily by weighing the amount offered and the corresponding orts after each meal (concentrate) or after 24 h (hay). Samples of dietary ingredients (concentrate and hay) were analyzed for iodine content. Total iodine intake was calculated as the sum of iodine eaten as supplement (as KI administered × 0.765), concentrate and hay. Because individual hay intake was not measured, the mean hay intake per group was used for this calculation.
Measurements and sampling
Body condition score (BCS) was measured weekly on all goats. The BCS was based on a 5-point scale and assessed by palpation of the lumbar region as described by the E[Kika] de la Garza American Institute for Goat Research of Langston University (2000). Animals were also weighed at the beginning and at the end of the experimental period to evaluate their BW change.
Samples of dietary ingredients (concentrate and hay) were collected for chemical analysis.
From the first week of experimental period, blood samples were collected weekly, after morning milking and before KI administration (at 0800 h), by jugular venipuncture into 10-ml vacutainer tubes (Becton Dickinson, Le Pont Claix, France) containing EDTA K3 (for nonesterified fatty acids, NEFA, and urea determination) or lithium heparin (for hormonal determinations), and 5-ml vacutainer tubes containing lithium heparin and lithium iodine-acetate (for glucose determination). After separation by centrifugation (1500 × g), plasma was collected and frozen at −25°C until analyzed for hormones and metabolites.
Feed analysis
The dry matter (DM) content of hay and concentrate was determined by oven drying at 105°C for 24 h. Dried feed samples were analyzed for NDF, ADF and ADL with the procedure of Van Soest et al. (Reference Van Soest, Robertson and Lewis1991) by using the filter bag equipment of Ankom (Ankom Technology Corp., Fairport, NY, USA), ash (Association of Official Analytical Chemists (AOAC), 2000; method 942.05), CP (AOAC, 2000; method 988.05) and lipid extract (AOAC, 2000; method 920.39). Chemical analyses were expressed as percentages of DM.
Blood analyses
Plasma concentrations of NEFA, urea, glucose, insulin, free triiodothyronine (FT3) and free thyroxine (FT4) were determined. Plasma glucose and urea were determined with a commercial kit (Adaltis, Bologna, Italy) by using the automatic analyzer Lory 2000 (Biochem Immunosystem, Bologna, Italy). Circulating NEFA were measured using the enzymatic colorimetric ACS-ACOD-MEHA method (Wako Chemicals GmbH, Neuss, Germany). Plasma insulin concentrations were measured by a sheep insulin ELISA kit (Mercodia, Uppsala, Sweden) according to the manufacturer's instructions. Concentrations of FT3 and FT4 were determined with specific commercial kits (Adaltis) by using an automatic hormone analyzer (Eclectica, Adaltis). The ‘Revised Quantitative Insulin Sensitivity Check Index’ (RQUICKI), an indicator of insulin sensitivity, was calculated by using the formula: RQUICKI = 1/[log (glucose) + log (insulin) + log (NEFA)] (Perseghin et al., Reference Perseghin, Caumo, Caloni, Testolin and Luzi2001).
Statistical analysis
Data were analyzed according to a repeated measures design with the following mixed linear model (Littell et al., Reference Littell, Henry and Ammerman1998):
 $$ {{Y}_{ijkl}}\, = \,\mu \,{\rm{ + }}\,{{I}_i}\, + \,{{W}_j}\,{\rm{ + }}\,{{{\rm{(}}I\,{\rm{x}}\,W{\rm{)}}}_{ij}}\,{\rm{ + }}\,{{A}_k}{\rm{(}}i{\rm{)}}\,{\rm{ + }}\,{{{\epsilon}}_{ijkl}} $$
where Yijkl = observation (BCS, glucose, insulin, NEFA, BUN, FT3, FT4, FT3/FT4 and RQUICKI), μ = overall mean, Ii = fixed effect of iodine supplement i (i = 3 levels, CON, LI and HI), Wj = fixed effect of the week j (j = 8 levels, from 1 to 8), (I × W)ij = interaction between iodine supplement and week, Ak(i) = random effect of animal k (k = 30) nested within iodine supplement i and εijkl = random residual. Comparisons among treatment means were performed by using the Tukey test. Effects were considered to be significant at P ⩽ 0.05; a tendency was declared at 0.05 < P ⩽ 0.10.
Results and Discussion
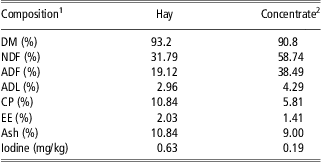
The chemical composition of hay and concentrate used for experimental diet is reported in Table 1. During the experiment, the concentrate (700 g/day) was completely eaten by all animals and the average individual daily hay intake was (mean ± s.d.) 1397 ± 9.4, 1394 ± 11.0 and 1390 ± 20.5 g/day in CON, LI and HI, respectively. Therefore, the daily DM intake was similar among groups (1918 ± 13 g/day). The content of iodine measured in the commercial concentrate averaged 0.63 mg/kg of DM, whereas that measured in hay was 0.19 mg/kg of DM. The basal concentration of iodine in the control diet was 0.34 mg/kg of DM, which resulted in almost 50% of the dietary iodine concentration recommended for lactating goats (0.80 mg/kg of DM diet) by the National Research Council (NRC, 2007) and more close to recommended dietary level reported by Meschy et al. (Reference Meschy2000) that is assessed at 0.4 to 0.6 mg/kg of DM. However, these recommendations are based on a limited number of data, because a large and exhaustive database on iodine requirements in dairy animals is not available yet. The daily intake of iodine (76.5% of KI) was 0.650, 0.996 and 1.340 mg/head in CON, LI and HI groups, respectively. The KI supplementation increased the intake of iodine in the two treated groups, to about 0.5 and 0.7 mg/kg of DM in LI and HI groups, respectively.
Chemical composition of the hay and concentrate used in the diets (DM basis)
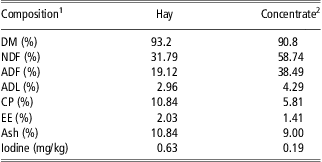
1DM = dry matter; NDF = neutral detergent fiber; ADF = acid detergent fiber; ADL = acid detergent lignin; CP = crude protein; EE = ether extract.
2Commercial concentrate with minerals supplement: Iodine (Ca(IO3)2) 1 mg/kg, Co (CoCO3) 0.40 mg/kg, Fe (FeCO3) 72 mg/kg, MnO 60.0 mg/kg, ZnO 70.0 mg/kg, Se (Na2SeO3) 0.25 mg/kg and Mo (NH4)2MoO4) 0.20 mg/kg. Ingredients: dehydrated alfalfa meal, wheat bran, sunflower seeds flour (partially decorticated), corn flour, barley flour, cane molasses, toasted soybean flour, broad beans.
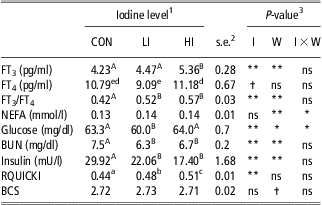
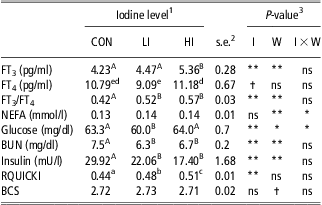
The effects of iodine level on free TH, blood metabolites and BCS in dairy goats are reported in Table 2.
Least square means of plasma free thyroid hormones (FT3, FT4), urea and insulin concentration, FT3/FT4 ratio, RQUICKI and BCS in dairy goats supplemented with dietary KI
FT3 = free triiodothyronine; FT4 = free thyroxine; RQUICKI = Revised Quantitative Insulin Sensitivity Check Index; BCS = body condition score; KI = potassium iodide; NEFA = nonesterified fatty acids; BUN = blood urea nitrogen.
Means within a row with different superscripts differ (A,BP < 0.01; a,bP < 0.05; d,eP < 0.10).
1CON = control (0 mg of KI/day); LI = low iodine (0.45 mg of KI/day) and HI = high iodine (0.90 mg of KI/day).
2s.e. = standard error of mean.
3Statistical significance of effects of iodine level (I), week of sampling (W) and I × W is indicated: †P ⩽ 0.10; *P ⩽ 0.05; **P ⩽ 0.01.
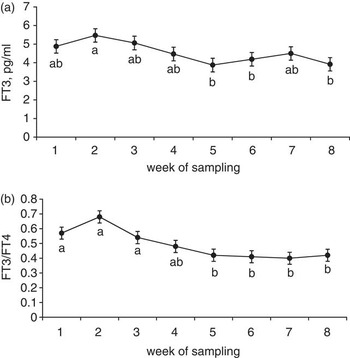
The FT3 serum concentration was higher (P < 0.01) in HI than in LI and CON goats. The FT4 serum concentration tended to be higher (P = 0.059) in HI than in LI, whereas that of CON was intermediate. The undefined trend of FT4 levels among the studied groups could be attributed to complex variations in the degree of peripheral conversion of T4 to T3. The FT3/FT4 ratio increased (P < 0.01) in supplemented groups compared with CON. The temporal evolution of FT3 (Figure 1a) showed that the hormone concentration decreased with sampling time (P < 0.01), in accordance with observations in Mediterranean goat breeds at this stage of lactation (Todini, Reference Todini2007). The FT4 concentration did not vary significantly with week of sampling, whereas the FT3/FT4 ratio (Figure 1b) showed a clear decrease with sampling (P < 0.01). Similarly, a decrease of T3/T4 ratio was also observed in Mediterranean lactating goats as lactation progressed (between April and July; Todini, Reference Todini2007) and in intact and castrated wool goats fed diet with low iodine content (Pattanaik et al., Reference Pattanaik, Khan, Mohanty and Varshney2004).
Temporal evolution of FT3 (a) and FT3/FT4 ratio (b) in plasma of dairy goats (mean ± s.e.). Sampling dates with different letters differ (P < 0.05). Statistical differences among iodine groups are described in Table 2. FT3 = free triiodothyronine; FT4 = free thyroxine; NEFA = nonesterified fatty acids; CON = control group; LI = low iodine group; HI = high iodine group.

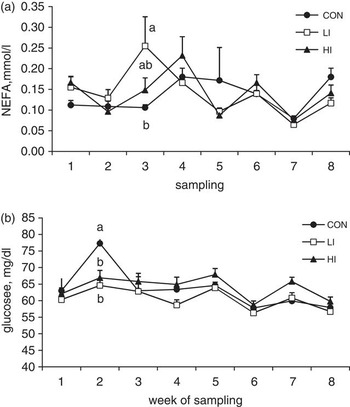
An iodine level × week of sampling interaction was detected on NEFA concentration (Figure 2a; P < 0.05). In this case, supplemented groups showed a temporary NEFA increase in LI group in the 3rd week of treatment compared with the 5th and 7th (P < 0.05) and 8th ( P < 0.10) weeks, and in HI group in the 4th week of treatment compared with the 7th (P < 0.05) week, whereas CON did not show a significant NEFA variation during all the experimental period. The pattern of plasma NEFA concentration observed in the supplemented groups can be related to an early and temporary effect of iodine supplementation. However, no effect of iodine supplementation on overall plasma NEFA concentration was observed (P = 0.911), in agreement with previous reports on cattle (Randhawa and Randhawa, Reference Randhawa and Randhawa2001). The lack of iodine effects on NEFA, as well as on BCS (2.72, 2.73 and 2.71 in CON, LI and HI groups, respectively, s.e. = 0.017, P = 0.69) and BW variation (1.41, 1.71 and 1.40 kg in CON, LI and HI groups, respectively, s.e. = 0.84, P = 0.94), suggests that the iodine supplementation at the level used in the present experiment did not influence the lipid storage of animals. However, a positive relationship among T3 administration and plasma NEFA in human and domestic animals has been reported (Stamp et al., Reference Stamp, Doar and Wynn1969; Hoenig et al., Reference Hoenig, Caffall and Ferguson2008), suggesting that an indirect effect of iodine supplementation on NEFA concentration may occur.
Temporal evolution of NEFA (a) and glucose (b) in plasma of dairy goats supplemented with 0 (CON), 0.45 (LI) and 0.90 (HI) mg of potassium iodine/day (mean ± s.e.). Interaction iodine level × week of sampling was significant for NEFA (P < 0.05) and for glucose (P < 0.01). Means of groups with different letters within week of sampling are significantly different (P < 0.01). NEFA = nonesterified fatty acids; CON = control group; LI = low iodine group; HI = high iodine group.

A significant, but not clear, effect of dietary iodine levels on blood glucose was observed. Indeed, the glucose concentration showed a significant iodine level × week of sampling interaction due to an unexpected increase of its concentration in the CON group in the second week of sampling (Figure 2b). On average, the LI group had the lowest glucose concentration (P < 0.05), compared with CON and HI groups.
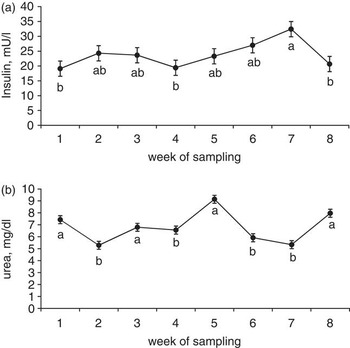
Insulin level was lower in KI supplemented groups compared with control (Table 2). Iodine supplementation usually improves the cellular sensitivity of the receptors to different hormones, including insulin; the improved insulin sensitivity then results in a decreased production of this hormone. This supports the RQUICKI increase with KI supplementation observed in our experiment. This index, originally developed for humans to estimate insulin sensitivity (Perseghin et al., Reference Perseghin, Caumo, Caloni, Testolin and Luzi2001), is based on plasma concentrations of glucose, insulin and NEFA and was successfully applied in dairy cows (Holtenius and Holtenius, Reference Holtenius and Holtenius2007). Low RQUICKI values indicate decreased insulin sensitivity or a high insulin resistance defined as a condition when higher than normal insulin concentrations are needed to achieve normal metabolic responses. Low insulin sensitivity is common in high-producing dairy cows in early lactation, when glucose uptake by adipose tissue and muscle is reduced (Cronjé, Reference Cronjé2000). In humans, an association of diabetes type 1 and iodine deficiency was observed (Vladeva et al., Reference Vladeva, Gatseva and Argirova2007). In animal models, iodine supplementation reduced the incidence of type 1 diabetes mellitus (Hartoft-Nielsen et al., Reference Hartoft-Nielsen, Rasmussen, Bock, Feldt-Rasmussen, Kaas and Buschard2009) due to an increased sensitivity of insulin receptors. The positive effect of iodine on the RQUICKI suggests an improvement of insulin sensitivity, as evidenced by the low variation in glucose concentration among groups, despite the marked decrease of insulin concentration in supplemented animals. The temporal pattern of insulin evidenced an increase with sampling period (Figure 3a). This pattern could be related to the natural decrease of milk yield as lactation progresses (Nudda et al., Reference Nudda, Battacone, Decandia, Acciaro, Aghini-Lombardi, Frigeri and Pulina2009), because insulin is correlated negatively with milk yield (Squires, Reference Squires2010).
Temporal evolution of insulin hormone (a) and urea (b) in plasma of dairy goats. Sampling dates with different letters differ (P < 0.01). Statistical differences among iodine groups are described in Table 2. FT3 = free triiodothyronine; FT4 = free thyroxine.

Blood urea nitrogen (BUN) was significantly lowered by iodine supplementation. The concentration of BUN varied over time, without a defined trend (Figure 3b). The decrease in BUN in the supplemented groups was accompanied by a decrease in milk urea nitrogen from about 37.0 mg/dl in CON to an average of 32.0 mg/dl in the KI supplemented groups (Nudda et al., Reference Nudda, Battacone, Decandia, Acciaro, Aghini-Lombardi, Frigeri and Pulina2009). Previous observations (Pattanaik et al., Reference Pattanaik, Khan, Varshney and Bedi2001) report a greater retention of absorbed nitrogen in iodine-supplemented goats. Therefore, it could be argued that the increased FT3 in animals supplemented with KI might have increased the body metabolic activity and the rate of protein synthesis to some degree. However, this was not observed in our trial, considering that milk yield and milk protein were not influenced by iodine supplementation (P = 0.38; Nudda et al., Reference Nudda, Battacone, Decandia, Acciaro, Aghini-Lombardi, Frigeri and Pulina2009). A possible explanation of the observed decrease in BUN, and consequently in MUN, with increasing iodine level may be an interaction between iodine and the activity of some ruminal microbial strains. In ruminants, a dose-related stimulatory effect of iodine was observed in cellulose digestion from suspensions of rumen microorganisms (Martinez and Church, Reference Martinez and Church1970). Therefore, it can be hypothesized that iodine might have interfered to some extent on rumen microbial protein degradation with a consequent reduction in ammonia production and/or utilization. As a consequence, some decrease of the amount of ammonia loaded from rumen to blood may have occurred in iodine-supplemented groups.
Conclusions
The iodine supplementation in dairy goats increased FT3 concentration, FT3/FT4 ratio and RQUICKI and decreased BUN. The increase of RQUICKI with iodine supplementation suggests an improvement of the insulin sensitivity of the tissues associated with a reduction of insulin secretion. This aspect needs further investigations in dairy animals because it is of great interest for the management of metabolic disorders in early lactating animals experiencing a negative energy balance.
Acknowledgment
The authors thank Ana Helena Dias Francesconi for editing and revising the manuscript.