Implications
The success of industry-wide efforts to mitigate greenhouse gas (GHG) emissions across the entire dairy chain largely depends on proper quantification of the GHG footprint. This study provides prediction equations for both the joint and separate quantification of dairy cattle enteric CH4 (eCH4) emissions, digestible volatile solids excretion (dVS) and N excretion, based on feed intake, dietary contents and animal characteristics. This analysis enabled the assessment of potential trade-offs between these emissions and excreta as well as identifying knowledge gaps for future research related to dairy nutrition and management interventions.
Introduction
Industry-wide efforts to mitigate GHG emissions across the entire dairy chain depend on assessment, measurement, quantification and communication of the GHG footprint (e.g. Hristov et al., Reference Hristov, Ott, Tricarico, Rotz, Waghorn, Adesogan, Dijkstra, Montes, Oh, Kebreab, Oosting, Gerber, Henderson, Makkar and Firkins2013). On-farm nutrition and management interventions to reduce eCH4 emission, the most abundant GHG from cattle, may also affect organic matter (OM) and N excretion, which contribute to manure volume and composition. Besides manure volume and composition, potential manure CH4 emission also depends on manure management (Montes et al., Reference Montes, Meinen, Dell, Rotz, Hristov, Oh, Waghorn, Gerber, Henderson, Makkar and Dijkstra2013). Nitrogen (e.g. ammonia, nitrate) excretion negatively impacts air, soil and water quality and leads to N2O, which is the second most abundant GHG emission from cattle. Production of N2O may occur after consecutively exposing manure to aerobic and anaerobic conditions, either during storage or in amended soils. Expensive and labor intensive on-farm GHG measurements can be avoided by applying prediction models that assess the nature and magnitude of GHG sources and their trade-offs, although model precision is not totally unprecedented.
A few studies have assessed the relationship between dairy cattle eCH4 emissions and urinary and fecal excreta by modeling of known biology (Dijkstra et al., Reference Dijkstra, Oenema and Bannink2011) or by experiment (Hindrichsen et al., Reference Hindrichsen, Wettstein, Machmüller and Kreuzer2006; Hellwing et al., Reference Hellwing, Weisbjerg and Møller2014). Although eCH4 emission (Moe and Tyrrell, Reference Moe and Tyrrell1979), N excretion alone (Yan et al., Reference Yan, Frost, Agnew, Binnie and Mayne2006) or manure volume and composition (called volatile solids; Appuhamy et al., Reference Appuhamy, Moraes, Wagner-Riddle, Casper and Kebreab2018) have been quantified separately, joint quantification is lacking. The objective was to jointly quantify eCH4 emissions, dVS excretion and N excretion from dairy cattle, based on feed intake, dietary contents and animal characteristics, and to evaluate relationships between excretion and emission variables.
Material and methods
Database
A database containing 1373 indirect respiration calorimetry records of lactating dairy cows in 49 studies conducted from 1963 to 1995 in the former USDA Energy Metabolism Unit (Beltsville, MD, USA) was used. This database comprised individual records of total energy and N balance from Holstein and Jersey cows, including chemical analyses of dietary and excreta contents. The current state of knowledge on nutrient utilization in lactating cattle is reliably represented because of the number of observations over an extended period from the same research station and because this database constitutes the basis of the nutrient evaluation systems for the current US dairy nutrient requirement models (National Research Council, 2001). Urine and feces total collection details, excreta nutrient composition analysis and N balance determination were described by Wilkerson et al. (Reference Wilkerson, Mertens and Casper1997). A description of the CH4 measurement techniques used is provided by Moe and Tyrell (1979) and Wilkerson et al. (Reference Wilkerson, Casper and Mertens1995).
For each individual record, fat- and protein-corrected milk (FPCM) was calculated according to: FPCM (kg/day)=[0.337+0.116×milk fat (%)+0.06×milk protein (%)]×milk production (kg/day) (CVB, 2008). Urinary OM was calculated as four times urinary carbon (details in Appuhamy et al., Reference Appuhamy, Moraes, Wagner-Riddle, Casper and Kebreab2018). Digestible volatile solids were calculated as fecal OM – fecal ADL – fecal ether extract+urinary OM. All individual records that contained missing values in the variables of interest were discarded (603 records retained). All studies were individually screened based on mean eCH4, dVS, urinary N (UN), fecal N (FN). One study was removed because of low eCH4 production values relative to dry matter intake (DMI) (eCH4 yield was 9.3 g/kg DMI; all other studies ranged from 13.1 to 23.0 g/kg DMI, with no difference larger than 1.0 g/kg DMI if studies were ranked by mean eCH4 yield; 575 records retained). Outliers in the eCH4, dVS, UN, FN, total N (TN) variables and their corresponding yield (g/kg DMI) and intensity (g/kg FPCM) variables were identified by the interquartile range method (Zwillinger and Kokoska, Reference Zwillinger and Kokoska2000) using a factor of 2.5 for extremes (529 records retained). Lastly, records from studies with less than five observations were removed (520 records retained from 151 cows and 28 studies). Summary statistics are provided in Table 1.
Descriptive statistics of emissions, excreta, dietary variables and animal characteristics in dairy cattle

DM=dry matter; EE=ether extract; DIM=days in milk; FPCM=fat- and protein-corrected milk; eCH4=enteric methane; OM=organic matter; FecOM=fecal OM; FecNDF=fecal NDF; FecADL=fecal ADL; FN=fecal N; FecEE=fecal ether extract; UC=urinary carbon; UOM=urinary organic matter; UN=urinary N; TN=total N; dVS=digestible volatile solids (FecOM–FecADL–FecEE+UOM); I=intensity; Y=yield.
Correlation of dependent variables
Relationships between the emission and excretion production (g/day), yield and intensity variables including eCH4, dVS, FN, UN and TN were estimated by Pearson correlation coefficients that were calculated per study. The correlation coefficients were transformed to ensure more stable variance and normality using Fisher’s r-to-Z transformation (Z=tanh−1(r); e.g. Viechtbauer, Reference Viechtbauer2010). To estimate the average true effect, a random-effects model was used (equation 1):
 $$y_{i} {\equals}\mu {\plus}s_{i} {\plus}e_{i} ,$$
where y
i
is the observed effect in the ith study, μ is the average true effect; s
i
and e
i
are the ith study random effect and sampling error, respectively, distributed as s
i
~N(0,
 $\sigma _{s}^{2} $
) and e
i
~N(0,
 $\sigma _{{e,i}}^{2} $
);
 $\sigma _{s}^{2} $
is the study variance,
 $\sigma _{{e,i}}^{2} $
is the sampling variance of study i, which is calculated from its number of observations. Average true correlation coefficients were back-transformed to raw correlation coefficients for interpretation convenience. Models were fitted using the metafor package in R (Viechtbauer, Reference Viechtbauer2010).
Univariate model development
Production (g/day), yield (g/kg DMI) and intensity (g/kg FPCM) of eCH4 emission, and dVS, UN, FN and TN excretion were predicted by a univariate mixed-effects model (equation (2)):
 $$y_{{ijk}} {\equals}\beta _{0} {\plus}\beta _{1} x_{{ijk1}} {\plus} \cdot \cdot \cdot {\plus}\beta _{l} x_{{ijkl}} {\plus}s_{i} \plus a_{j} {\plus}e_{{ijk}} ,$$
where y
ijk
denotes the kth response of the dependent variable from the ith study and the jth animal; β
0 denotes the intercept; x
ijk1 to x
ijkl
denote the selected covariates with β
1 to β
l
the corresponding slopes; s
i
and a
j
denote the random effects of i
th study and j
th animal, respectively; e
ijk
denotes the residual error; the study, animal and residual terms are distributed as s
i
~N(0,
 $\sigma _{s}^{2} $
), a
j
~N(0,
 $\sigma _{a}^{2} $
) and e
ijk
~N(0,
 $\sigma _{e}^{2} $
), respectively, with
 $\sigma _{s}^{2} $
,
 $\sigma _{a}^{2} $
and
 $\sigma _{e}^{2} $
the corresponding variances. A set of dietary variables (D) or dietary variables and animal characteristics (DA) was available as covariates for model development. The D covariates comprise DMI, dietary contents of gross energy, NDF, ADF, ADL, CP, ether extract (EE) and ash, whereas the DA covariates also comprise days in milk (DIM), BW, age, milk yield (MY), milk fat (MFAT) and protein (MPROT) contents. However, DMI could not be selected for predicting yields and intensities, and MY and MFAT and MPROT contents could not be selected for predicting intensities. Furthermore, models that comprised correlated covariates (|r|⩽0.5; viz., NDF v. ADF, NDF v. CP, BW v. DMI, DIM v. MY, DIM v. MPROT, MY v. MPROT and MY v. DMI) were not evaluated. All potential models were examined and the selection was based on Bayesian information criterion (BIC; e.g. James et al., Reference James, Witten, Hastie and Tibshirani2014). Models were fitted using the lme4 package in R (Bates et al., Reference Bates, Maechler, Bolker and Walker2015).
Multivariate model development
Apart from univariate prediction, eCH4, dVS and TN production and their corresponding yield and intensity variables were predicted using multivariate regression. Preceding the analysis, production, yield and intensity of dVS were rescaled by a factor 0.05 to obtain similar variances relative to the eCH4 and TN variables. The multivariate model was structured through the same covariates for all dependent variables, with expectations (equation (3)):
 $$\left[ {\matrix{ {{\rm eCH}_{4} } \cr {{\rm dVS}} \cr {{\rm TN}} \cr } } \right]{\equals}\left[ {\matrix{ {\beta _{{10}} {\plus}\beta _{{11}} x_{1} {\plus}\beta _{{12}} x_{2} {\plus}\,\ldots\,{\plus}\beta _{{1l}} x_{l} } \cr {\beta _{{20}} {\plus}\beta _{{21}} x_{1} {\plus}\beta _{{22}} x_{2} {\plus}\,\ldots\,{\plus}\beta _{{2l}} x_{l} } \cr {\beta _{{30}} {\plus}\beta _{{31}} x_{1} {\plus}\beta _{{32}} x_{2} {\plus}\,\ldots\,{\plus}\beta _{{3l}} x_{l} } \cr } } \right],$$
with β 10, β 20 and β 30 the intercepts, and β 1l , β 2l and β 3l the regression coefficients of covariates x 1 to x l . This structure was implemented through a multivariate linear mixed-effects model (equation (4)):
 $${\bf{y}} {\equals}X\beta {\plus}Z_{1} \delta {\plus}Z_{2} \alpha {\plus}{\bf {\epsilon}} $$
where y is the k×3 vector of eCH4, dVS and TN, respectively; X, Z1, Z2 are known design matrices relating elements of β, δ and α to y; β is the l×3 vector of regression coefficients; δ is the i×3 vector of study random regression coefficients; α is the j×3 vector of animal random regression coefficients; and ε is the k×3 vector of residuals; i, j, k and l represent the number of studies, animals, observations and covariates, respectively. The distribution of random effects and residuals was (equation 5):
 $$\left[ {\matrix{ \delta \cr \alpha \cr {\epsilon} \cr } } \right]{\equals}N\left( {\left[ {\matrix{ 0 \cr 0 \cr 0 \cr } } \right],\left[ {\matrix{ {I_{{\mib{i}} } \,\otimes\,G_{\delta } } & 0 & 0 \cr 0 & {I_{{\mib{j}} } \,\otimes\,G_{\alpha} } & 0 \cr 0 & 0 & {I_{{\mib{k}} } \,\otimes\,R_{{\epsilon}} } \cr } } \right]} \right),$$
with I
i
, I
j
and I
k
being identity matrices of order i, j and k, and G
δ
, G
α
and R
ε
being unstructured (co)variance matrices of order 3 for δ, α and ε, respectively. Regression coefficients for the l+1 covariates b and the three dependent variables a were given minimally informative priors, such that
 $\mathop \sum\limits_{a{\equals}1}^3 \mathop \sum\limits_{b{\equals}0}^l \beta _{{ab}} \,\sim\,N(\mu {\equals}0,{\rm }\sigma ^{2} {\equals}10^{{10}} )$
. Inverse Wishart priors with scale matrix V and degrees of freedom parameter ν were used for the (co)variance matrices, such that {G
α
, G
δ
, R
ε
}~IW(V=diag{104, 104, 104}, ν=10−1) for emission and excretion production, and {G
α
, G
δ
, R
ε
}~IW(V=diag{103, 103, 103}, ν=10−2) for yields and intensities. Model selection was based on deviance information criterion (DIC), with a 10 DIC unit difference, which indicates a substantial improvement of model goodness of fit v. complexity (Spiegelhalter et al., Reference Spiegelhalter, Best, Carlin and Van der Linde2002), required for selection of a more complex multivariate model. If more than one of the three regression coefficients β
1b
, β
2b
and β
3b
of a covariate or more than one of the regression coefficients β
a1, β
a2, … , β
al
of a dependent variable contained zero in their 95% credible intervals (CrI), a second best model based on DIC was selected until a satisfactory model fit was obtained. Other model selection details were identical to the univariate procedure. Markov chain Monte Carlo (MCMC) simulations were run for 120 103 iterations with the first 20 103 taken as burn-in period. Chains were thinned by a factor of 25, after which convergence was assessed by visually inspecting autocorrelation, and chain traces and densities. Simulations were run using the MCMCglmm package in R (Hadfield, Reference Hadfield2010).
Model evaluation
All univariate and multivariate prediction models were evaluated using the revised K-fold cross-validation method (James et al., Reference James, Witten, Hastie and Tibshirani2014), based on all the data used for every specific equation, in which folds were individual studies (K=number of studies). Each individual fold was treated as a validation set. The predicted dependent variables of each fold were computed using a model fitted from the remaining folds. Evaluation of all models developed per category was assessed by the root mean square prediction error (RMSPE; Bibby and Toutenburg, Reference Bibby and Toutenburg1977).
Results
Correlations
The estimated true correlations of emission and excretion productions (g/day) and their corresponding yields (g/kg DMI) and intensities (g/kg FPCM) are shown in Table 2. All correlations of emission and excretion productions were positively related, with r ranging from 0.41 (eCH4 v. UN) to 0.84 (dVS v. FN). Yield correlations were negative (r=−0.21, eCH4,Y v. dVSY), not different from zero (eCH4,Y v. FNY; dVSY v. TNY; dVSY v. UNY; UNY v. FNY) or positive (r=0.18, eCH4,Y v. UNY; r=0.22, eCH4,Y v. TNY; r=0.34, dVSY v. FNY). In line with the correlations of emission and excretion productions, all correlations of intensities were positively related, with r ranging from 0.60 (eCH4,I v. UNI) to 0.86 (dVSI v. FNI).
Mutual correlation of enteric CH4 (eCH4) emission and digestible volatile solids (dVS), urinary N (UN), fecal N (FN) and total N (TN) excretion production (g/day) from dairy cattle, and their corresponding yield (g/kg DMI; labeled with subscript Y) and intensity (g/kg FPCM; labeled with subscript I) variables (y 1 v. y 2)

FPCM=fat- and protein-corrected milk.
The estimated true correlation coefficient (Z) is shown with SE, P-value and back-transformed correlation coefficient (r).
Univariate models
Dry matter intake was selected for all emission and excretion production (g/day) equations (Table 3), with the associated regression coefficients being consistently positive. Dietary ADF content appeared in the best models for eCH4, dVS, FN and TN production, with the associated regression coefficients being consistently positive. Dietary CP was selected for dVS, UN, FN and TN production equations, with the associated regression coefficients being positive, except for the dVS equation coefficient that was negative. The dVS production D and DA equations were identical, for which dietary ADL content was also selected and showed a negative regression coefficient. In the DA equation category, MFAT was selected for the prediction of eCH4, FN and TN production, whereas DIM was selected for eCH4, UN and TN production. All six regression coefficients associated with these animal characteristics were positive.
Selected univariate models and root mean square prediction error (RMSPE, % of observed mean) for emission and excretion production (g/day), yield (g/kg DMI; labeled with subscript Y) and intensity (g/kg FPCM; labeled with subscript I) of enteric CH4 (eCH4), digestible volatile solids (dVS), urinary N (UN), fecal N (FN) and total N (TN) from dairy cattle using dietary variable (D) and dietary variable and animal characteristics (DA) covariates

DMI=dry matter intake; EE=ether extract; MY=milk yield; MFAT=milk fat; DIM=days in milk.
Covariates include DMI (kg/day); dietary contents of ADF, ADL, CP, Ash and EE (all in DM %); BW (kg); MY (kg/day); MFAT (%) and DIM.
In line with the emission and excretion production models, dietary ADF content appeared in the eCH4,Y, dVSY, FNY and TNY (g/kg DMI) equations (Table 3), with the associated regression coefficients being consistently positive. Dietary CP was selected for dVSY, UNY, FNY and TNY equations, with the associated regression coefficients being positive, except for the dVSY equations that had negative coefficients for CP. The dVSY D and DA equations both contained dietary ADL and ash contents, with all four regression coefficients being negative. For the DA equation category, DIM also appeared in the eCH4,Y equation, with a positive regression coefficient. Milk yield was also selected for the prediction of dVSY, UNY and TNY, with the corresponding regression coefficients being positive for dVSY and negative for UNY and TNY. Milk fat content was selected for prediction of eCH4,Y, FNY and TNY, with the corresponding regression coefficients being consistently positive. Body weight appeared in the UNY and TNY equations, with the corresponding regression coefficients being positive.
Dietary ADF content was selected for the eCH4,I and dVSI (g/kg FPCM) D equations (Table 3), whereas it appeared in the eCH4,I, dVSI, FNI and TNI DA equations. All corresponding regression coefficients were positive. Dietary CP content was selected for all five intensity D equations with the regression coefficients being negative for the eCH4,I, dVSI and FNI equations and positive for the UNI and TNI equations. Dietary CP content appeared in the eCH4,I, dVSI, UNI and TNI DA equations, with the regression coefficients being negative for the eCH4,I and dVSI equations and positive for the UNI and TNI equations. Dietary ash content was selected for both dVSI equations, with the regression coefficients being negative. Dietary EE content appeared in the FNI and TNI D equations, with both regression coefficients being positive. Days in milk and BW appeared in all five intensity DA equations with all ten regression coefficients being positive.
Multivariate models
Dry matter intake and dietary ADF were selected for both the D and DA emission and excretion production (g/day) multivariate equations (Table 4), with all the corresponding regression coefficients being consistently positive. In addition to DMI and ADF, dietary CP was selected with negative coefficients for eCH4 and dVS and positive coefficients for the TN equations. For the DA production equations, MFAT was selected also, with positive regression coefficients for eCH4 and TN and a coefficient that was not different from zero for dVS.
Parameter posterior means with 95% credible intervals and root mean square prediction error (RMSPE, % of observed mean) of selected multivariate models for emission and excretion production (g/day), yield (g/kg DMI) and intensity (g/kg FPCM) of enteric CH4 (eCH4), digestible volatile solids (dVS) and total N (TN) from dairy cattle using dietary variable (D) and dietary variable and animal characteristic (DA) covariates

DMI=dry matter intake; EE=ether extract; MY=milk yield; MFAT=milk fat; DIM=days in milk.
β 0 represents the intercept, β 1 to β 4 represent the regression coefficients of the selected covariates. These covariates include DMI (kg/day); dietary contents of ADF, CP, ash and EE (all in DM %); BW (kg); MY (kg/day); MFAT (%) and DIM.
In line with the emission and excretion production equations, dietary ADF and CP were selected for the yield equations (g/kg DMI) with all ADF regression coefficients being positive and the CP coefficients being negative for eCH4,Y and dVSY, and positive for TNY (Table 4). Dietary ash content was selected as a third covariate for the yield D equations with positive regression coefficients for eCH4,Y and TNY and a negative regression coefficient for dVSY. The yield DA equations also contained MY as a covariate with a positive regression coefficient for dVSY and negative regression coefficients for eCH4,Y and TNY. The fourth covariate of the yield DA equations was MFAT, with positive coefficients for eCH4,Y and TNY, and a coefficient that was not different from zero for dVSY.
In line with the emission and excretion production and yield equations, dietary ADF and CP were selected for the intensity equations (g/kg FPCM) with all ADF regression coefficients being positive and the CP coefficients being negative for eCH4,I and dVSI and positive for TNI (Table 4). Dietary EE was selected as a third covariate for the D intensity equations with all three regression coefficients being positive, although the EE coefficient in dVSI was not significantly different from zero. For the DA intensity equations, DIM and BW were also selected, with the corresponding regression coefficients being positive.
Model evaluation
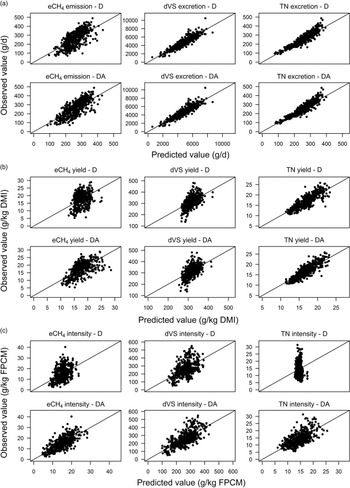
All univariate and multivariate eCH4 equations were associated with relatively large RMSPE, 24.3±6.3% (Tables 3 and 4), whereas the dVS and TN equations were associated with relatively small RMSPE values, 16.7±7.8% and 16.2±9.1%, respectively. Differences in RMSPE were most clearly reflected by the observed v. predicted plots of production and yield variables (Figures 1 and 2). The UN and FN equations, which were developed using univariate models only, had relatively large and small RMSPE, 26.5±8.3% and 15.5±7.7%, respectively, which is also visible in the observed v. predicted plots. Clear slope bias appeared for the FN yield equations and the FN intensity D equation. Emission and excretion production equations had an RMSPE of 14.7±5.3%, which was similar to the RMSPE of 14.6±5.1% for the yield equations, although the observed v. predicted relationships appeared to be stronger for the production variables. Among production and yield equations, DA equations showed stronger observed v. predicted relationships than D equations in case of eCH4 variables, but hardly any difference appeared for the dVS and TN excretion variables. Intensity equations had a larger RMSPE, 29.4±5.3%, and showed relatively weak observed v. predicted relationships, especially the D equations. For all dependent variables, adding animal characteristics improved the observed v. predicted relationships, with RMSPE being 21.1±10.0% and 17.9±6.9% for the D and DA equations, respectively. Multivariate models had an RMSPE of 19.3±8.5%, which was slightly larger than the RMSPE of 18.8±8.7% obtained for the univariate eCH4, dVS and TN models, and similar observed v. predicted relationships were observed.
Predicted v. observed value plots of the univariate regression models of (a) emissions and excreta production (g/day) from dairy cattle and their corresponding (b) yields (g/kg dry matter intake (DMI)) and (c) intensities (g/kg fat- and protein-corrected milk (FPCM)). Enteric CH4, (eCH4), digestible volatile solids (dVS), urinary N (UN), fecal N (FN) and total N (TN) are predicted using a dietary variable (D) and dietary variable and animal characteristic (DA) covariates.

Predicted v. observed value plots of the multivariate regression models of (a) emissions and excreta production (g/day) from dairy cattle and their corresponding (b) yields (g/kg dry matter intake (DMI)) and (c) intensities (g/kg fat- and protein-corrected milk (FPCM)). Enteric CH4 (eCH4), digestible volatile solids (dVS) and total N (TN) are predicted using a dietary variable (D) and dietary variable and animal characteristic (DA) covariates.

Discussion
The present study is unique in jointly predicting production, yield and intensity of eCH4 emission and dVS and N excretion. Joint prediction of eCH4, dVS and TN recognizes that focusing on eCH4 alone poorly predicts the entire impact of dairy systems (Fredeen et al., Reference Fredeen, Juurlink, Main, Astatkie and Martin2013). However, for accurately predicting manure methane production, one might need to correct for dVS for being not totally digestible during manure storage. Although ADL was subtracted, dVS contains rumen undegradable cell walls, of which the amount depends on the plant type used in forages and concentrates (Krämer et al., Reference Krämer, Weisbjerg, Lund, Jensen and Pedersen2012). It is questionable, though, whether rumen indigestible fractions other than ADL are indigestible during manure storage also. The data set used in the present study comprised a broad range of total mixed rations common in North America. Therefore, it is not guaranteed that our equations will perform highly adequate under conditions such as grazing. Nonetheless, contrasts in rapidly fermentable v. structural carbohydrates and dietary protein content may be well captured by dietary ADF and CP contents that appeared in our equations, regardless of the diet being formulated by people only, or also affected by grazed herbage physiology. Moreover, the data was analyzed using both univariate and multivariate regression, with Bayesian MCMC simulations facilitating the multivariate mixed-effects model fitting. Univariate regression identified the best covariates per dependent variable, whereas multivariate regression identified the best common predictors for the eCH4, dVS and TN variables. Multivariate regression may, however, result in the selection of covariates that are associated with regression coefficients that include zero in their CrI, which may occasionally limit the predictive performance of an equation.
Covariates in univariate and multivariate models
Despite the constraint that all covariates are identical for every dependent variable in the multivariate analysis, the covariates overlapped with those selected in the univariate analysis. Dry matter intake was selected for all emission and excretion production models, whereas dietary ADF content was selected for all multivariate and most univariate eCH4, dVS and TN models, although the regression coefficient in the multivariate intensity D equations was not different from zero. The appearance of dietary CP content showed less overlap between the univariate and multivariate models selected as it did not appear in the production and yield univariate prediction equations for eCH4, although the CrI of β CP in the multivariate eCH4 yield DA equation containing zero may align with dietary CP not being selected in its univariate counterpart. Dietary ADF and CP selected in various FN and TN equations is consistent with NDF and CP being predictors of the daily omasal non-ammonia non-microbial N flow (Roman-Garcia et al., Reference Roman-Garcia, White and Firkins2016). Dietary CP content not being and being included in some univariate and multivariate eCH4 equations, respectively, suggests the effect of dietary CP on eCH4 production is not substantial or confounded with other factors. This may be supported by low protein and high energy diets that resulted into lower N excretion, whereas eCH4 production was unaffected (Staerfl et al., Reference Staerfl, Amelchanka, Kälber, Soliva, Kreuzer and Zeitz2012). A positive and negative relationship of dietary ADF and CP with the dVS variables, respectively, is consistent with their effect on apparent total-tract OM digestibility mainly driving volatile solids excretion from dairy cows (Huhtanen et al., Reference Huhtanen, Ramin and Cabezas-Garcia2009).
The negative correlations of dietary ash and ADL contents with dVS yields and intensities reflect that they do not contribute to dVS by definition. Dietary fractions of starch and soluble sugars, which affect ruminal metabolism, were not considered in the present analysis, which may explain why a relatively large proportion of variation in the eCH4 variables was unexplained by the selected models. Moreover, these two non-fibrous carbohydrates contribute to the post-absorptive energy metabolism and may increase N utilization and MY (Broderick, Reference Broderick2003). This might explain why the RMSPE of the UN equations and the intensity equations were relatively large.
The selection of MFAT for the production and yield DA multivariate equations aligned with their univariate counterpart equations, although MFAT was not selected for the univariate dVS excretion and yield equations, which is consistent with the corresponding regression coefficient in the multivariate dVS equations not being different from zero. Milk fatty acids are synthesized de novo mainly from ruminal acetate (Bernard et al., Reference Bernard, Leroux and Chilliard2008), which is positively associated with dietary fiber content and eCH4 production (e.g. Dijkstra et al., Reference Dijkstra, Oenema and Bannink2011), with r=0.38 for ADF v. MFAT in the present study. High fiber diets containing less rapidly degradable carbohydrates may result in decreased N capture by rumen microbes (Belanche et al., Reference Belanche, Doreau, Edwards, Moorby, Pinloche and Newbold2012), which results in greater N excretion. The selection of MY for the multivariate and various univariate yield DA equations, and the selection of DIM and BW for the univariate and multivariate intensity DA equations align well with each other. A difference is DIM was selected for the univariate eCH4 production and yield equations, whereas MY was selected for the multivariate DA yield equations. However, this difference may be minor as MY and DIM were correlated to each other (r=−0.64). Higher producing cows in early lactation have diluted maintenance requirements (Hristov et al., Reference Hristov, Ott, Tricarico, Rotz, Waghorn, Adesogan, Dijkstra, Montes, Oh, Kebreab, Oosting, Gerber, Henderson, Makkar and Firkins2013), which explains the negative relationships with MY and the positive with DIM. Nonetheless, MY appeared positively related to dVS yield, which might reflect that high producing cows ingest more feed that increases digesta passage (Huhtanen et al., Reference Huhtanen, Rinne and Nousiainen2016) increasing the dVS yield. High BW cows have larger intake requirements (Hristov et al., Reference Hristov, Ott, Tricarico, Rotz, Waghorn, Adesogan, Dijkstra, Montes, Oh, Kebreab, Oosting, Gerber, Henderson, Makkar and Firkins2013), which makes them emit and excrete more in total and per unit FPCM. This covariate is commonly used for predicting excreta (Yan et al., Reference Yan, Frost, Agnew, Binnie and Mayne2006).
Differences in the overlap of the covariates selected for univariate and multivariate prediction can be related to several methodological constraints applied in the present study. First, the covariates selection was based on the BIC for the univariate equations, whereas a 10-unit difference in DIC was applied for the multivariate equations. If a 10-unit difference in Akaike information criterion, which may approach 10 units of DIC rather than just BIC, was applied on the univariate equations, dietary CP would also be selected for the eCH4 yield DA equation. Second, the fundamental difference between univariate and multivariate regression is the estimation of the off-diagonal elements of the covariance matrices G α , G δ and R ε . Fitting the ‘multivariate’ models while keeping the off-diagonal covariance matrix elements zero would cause the CrI of β CP in the eCH4 production DA equation and eCH4 yield D equation to contain zero. Third, the combination of covariates affects the regression coefficient posteriors. Fitting the multivariate production D equation with DMI, ADF, CP, DIM and MFAT, which were selected for its univariate counterpart, would cause β CP to contain zero in its CrI.
Implications for nutrition and animal management
As discussed above, strong positive correlations for emission and excretion production variables are associated with higher feed intake causing more emissions and excreta. Greater feed intake stimulates FPCM production, which results in lower emissions and excreta per unit FPCM, leading to strong correlations for the intensities. Increased productivity will, therefore, decrease emission and excretion intensities from cows. All these positive correlations do not indicate any trade-off between emissions and excreta from dairy cattle, neither do the positive and non-correlated yield variables. However, the negative correlation between eCH4 yield and dVS yield does indicate a trade-off, which is explained by the fermentability of feed, which may shift CH4 emission from enteric to manure production (Hristov et al., Reference Hristov, Ott, Tricarico, Rotz, Waghorn, Adesogan, Dijkstra, Montes, Oh, Kebreab, Oosting, Gerber, Henderson, Makkar and Firkins2013; Hellwing et al., Reference Hellwing, Weisbjerg and Møller2014). Trade-offs for emission and excretion variables may also be indicated by covariates that show opposite relationships for these dependent variables. Dietary CP, which appeared in all multivariate equations, showed opposite relationships for the various eCH4 and dVS v. TN multivariate D and DA equations.
This trade-off induced by dietary CP content aligns with a mechanistic modeling study (Dijkstra et al., Reference Dijkstra, Oenema and Bannink2011), in which increased eCH4 production and decreased N excretion was simulated for cattle fed dietary herbages with lower N content. This trade-off was also observed in an experimental study by Warner et al. (Reference Warner, Bannink, Hatew, Laar and Dijkstra2017) in the Netherlands. In this study, grass silage obtained from different maturity stages substantially affected dietary NDF and CP contents. Increased dietary NDF and decreased CP resulted in higher eCH4, lower OM and NDF degradability, and lower N excretion. These observations align with the ADF and CP covariates and their regression coefficients of the eCH4, dVS and N equations obtained in the present study, despite the database being generated in the USA where rations contain less forage than in Europe.
Dietary ash and MY selected for the yield D and DA equations showed a trade-off for dVS v. eCH4 and TN yield. These variables do not appear as consistent in the multivariate equations as dietary CP and may contribute less to such a trade-off. In addition, DIM, which correlated to MY, did not show a trade-off for the multivariate intensity equations. Variables that did not indicate a trade-off, viz., DMI, dietary ADF and EE, BW, DIM and MFAT, may be optimized towards decreasing emissions and excreta, provided that acceptable milk production and animal health and welfare are ensured.
The relatively similar RMSPE values for the univariate and multivariate equations indicate that both equation types are equally applicable. However, we recommend aligning with the nature of the equation development. Therefore, inventories focussing on one single emission or excretion variable may use the univariate model equations, whereas inventories focussing on multiple emission and excretion variables may use the multivariate model equations. The relatively large differences in RMSPE and observed v. predicted relationships between the intensity D and DA equations indicates a prediction of intensities without animal characteristics is not recommended.
Conclusion
Univariate and multivariate regression analysis indicated DMI and dietary ADF and CP to be the main predictors for production of eCH4 emissions and dVS and N excreta (g/day). The yield of eCH4 emissions and dVS and N excreta (g/kg DMI) were best predicted by dietary ADF, dietary CP, MY and MFAT. The intensity of eCH4 emissions and dVS and N excreta (g/kg FPCM) were best predicted by dietary ADF, dietary CP, DIM and BW. The eCH4 and UN variables had larger RMSPE than dVS, FN and TN variables, whereas intensity variables had larger RMSPE than production and yield of emissions and excreta. Univariate and multivariate equations performed relatively similar. Mutual relationships indicated a trade-off for eCH4 v. dVS yield. The multivariate model indicated a trade-off between eCH4 and dVS v. TN production, yield and intensity induced by dietary CP content.
Acknowledgements
The authors thank Thomas R. Famula (University of California, Davis) for valuable comments on the statistical analysis.
Declaration of interest
The authors have no conflict of interest to declare.
Ethics statement
No statement.
Software and data repository resources
Data and R code used for the purpose of this study are not deposited in an official repository.