Introduction
Green Peafowl Pavo muticus is a dry forest specialist found in dry dipterocarp forest (Sukumal et al. Reference Sukumal, McGowan and Savini2015), pine forest (Shwe et al. Reference Shwe, Sukumal, Oo, Dowell, Browne and Savini2021), mixed deciduous and teak forest (Saridnirun et al. Reference Saridnirun, Sukumal, Grainger and Savini2021), as well as large-scale closed plantations such as teak (Win et al. Reference Win, Sukumal, Shwe and Savini2023) and orchards (Saridnirun et al. Reference Saridnirun, Sukumal, Grainger and Savini2023). Across its range, intense human activities (Dong et al. Reference Dong, Kuo, Chen, Wu, Shan and Wang2021) have fuelled severe declines, leading to the loss of 84% of its original range in recent decades, with most of the remaining areas concentrated in six strongholds (Sukumal et al. Reference Sukumal, Dowell and Savini2020a). Due to extensive habitat loss, degradation, and hunting pressure, the Green Peafowl has been classified as ‘Endangered’ since 2009 (BirdLife International 2018).
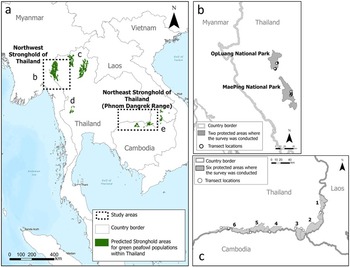
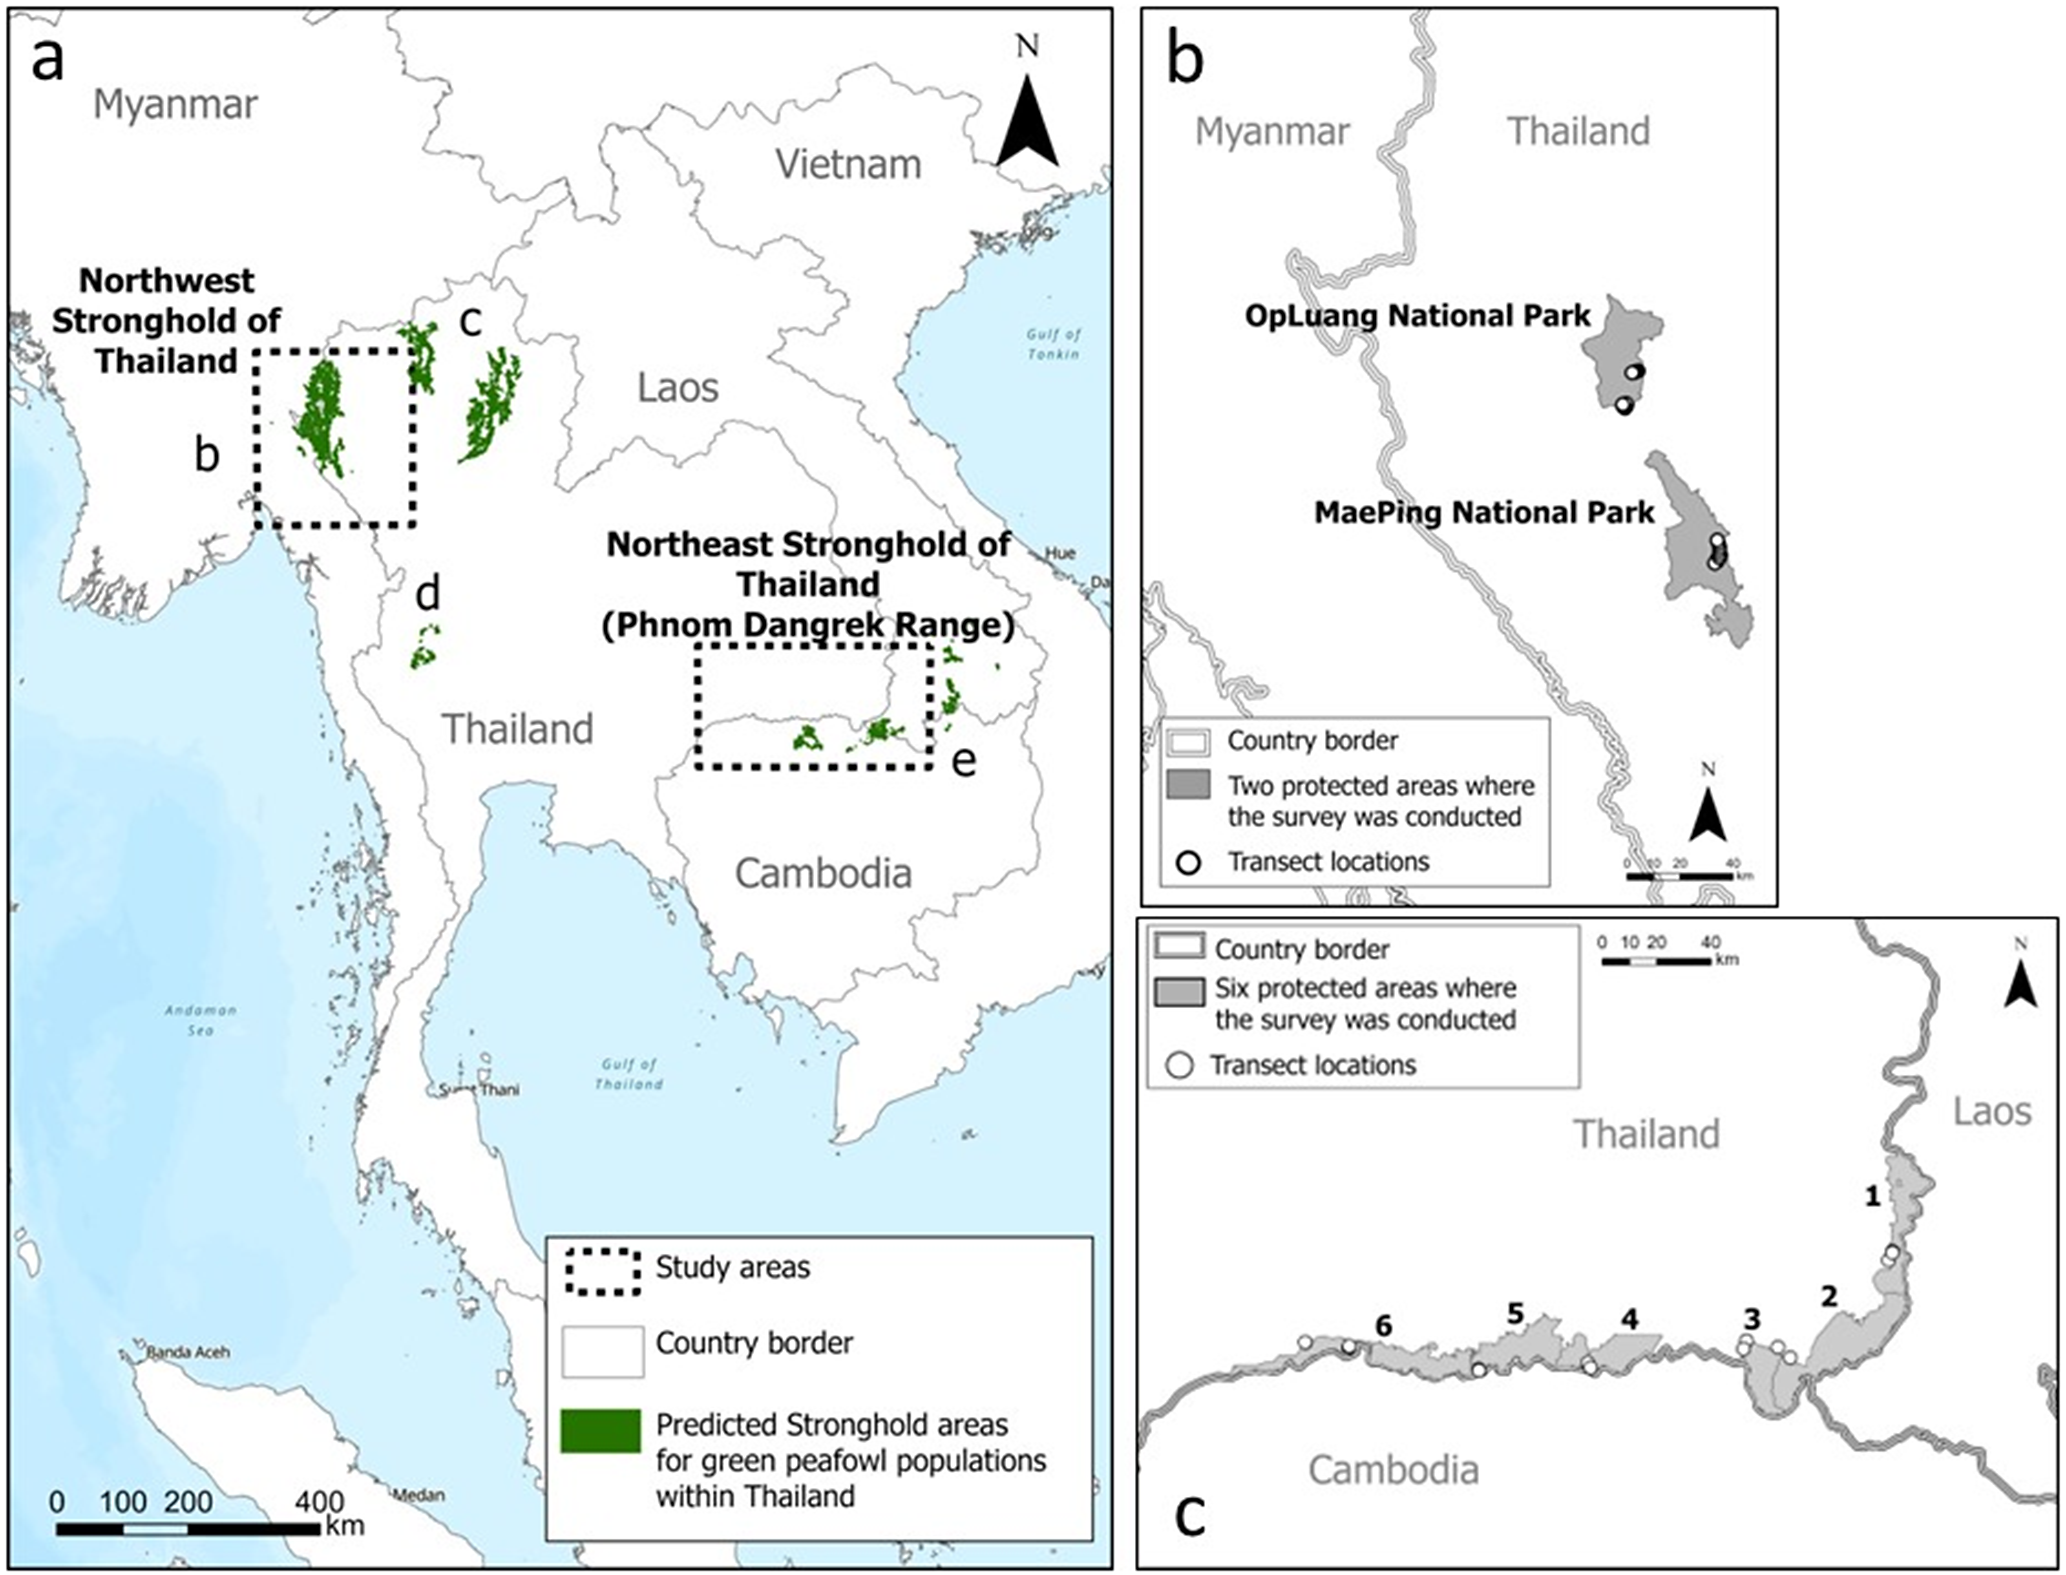
Following Sukumal et al. (Reference Sukumal, Dowell and Savini2020a), four strongholds have been identified in Thailand (Figure 1a). Population density has recently been estimated for two of the strongholds: Stronghold c in the north (Saridnirun et al. Reference Saridnirun, Sukumal, Grainger and Savini2021) and Stronghold d in the west (Sukumal et al. Reference Sukumal, Dowell and Savini2017). For the third, Stronghold b in north-western Thailand and eastern Myanmar along the Salawin River, the species has only been assessed in one protected area, DoiWiangLa Wildlife Sanctuary, based on a relatively small number of detections (Sukumal et al. Reference Sukumal, Thunhikorn and Savini2023). In the fourth, Stronghold e, located in north-eastern Thailand bordering Cambodia and Laos, the species has only been reported as present in DongKhanthung Provincial Protected Area in southern Laos (Vongkhamheng et al. Reference Vongkhamheng, Phiapalath, Vongkhamheng and Sounmany2012) and in Preah Vihear Protected Forest and Kulen Promtep Wildlife Sanctuary in northern Cambodia (BirdLife International 2018; McGowan et al. Reference McGowan, Duckworth, Xianji, Balen, Xiaojun and Khan1998). Although there are unofficial reports for the Phnom Dangrek Range on the Thai side of this stronghold, no official confirmation exists, and no quantitative population estimates have yet been conducted for the stronghold as a whole.
(a) Map of study areas, focusing on the predicted stronghold regions identified by Sukumal et al. (Reference Sukumal, Dowell and Savini2020a). (b) Stronghold b in north-western Thailand, where surveys were conducted in OpLuang and MaePing National Parks. (c) Stronghold e along the Phnom Dangrek Range in north-eastern Thailand, where surveys were conducted in (1) Buntharik-Yotmon Wildlife Sanctuary (WS), (2) PhuchongNayoi National Park (NP), (3) Yoddom WS, (4) PhanomDongrak WS, (5) Huaisala WS, and (6) HuaituptunHuaisamran WS.
Therefore, we estimated the status of Green Peafowl in two strongholds, i.e. b and e (Sukumal et al. Reference Sukumal, Dowell and Savini2020a). First, using distance sampling, we estimated an additional density for OpLuang National Park in Stronghold b, and a first estimate for the Phnom Dangrek Range in Stronghold e. Second, we assessed the extent of remaining suitable habitat in these areas using a Generalised Linear Model (GLM). Finally, by combining forest loss hotspots with the distribution of protected areas, we defined the threats to the species in the two strongholds. Throughout this article, we use NP for national park and WS for wildlife sanctuary when referring to specific protected areas (e.g. OpLuang NP, DoiWiangLa WS, MaePing NP, Buntharik-Yotmon WS, PhuchongNayoi NP, Yoddom WS, PhanomDongrak WS, Huaisala WS, and HuaituptunHuaisamran WS).
Methods
Survey sites
Green Peafowl surveys were conducted in OpLuang NP (Stronghold b) in north-western Thailand and along the Phnom Dangrek Range (Stronghold e) in north-eastern Thailand (Figure 1a).
OpLuang NP (18˚13’N 98˚28’E), located in north-western Thailand, covers an area of 553 km2, with elevations ranging from 280 m to1,980 m above sea level (masl). Approximately 70% of the park is covered by dry dipterocarp forest, while the remainder consists of mixed deciduous, dry evergreen, and pine forests. We included this area to complete the population density assessment of Green Peafowl in Stronghold b (north-western Thailand) as previous estimates were available only from one protected area, i.e. DoiWiangLa WS (Sukumal et al. Reference Sukumal, Thunhikorn and Savini2023). This addition helps to address the knowledge gap regarding the species’ status within this stronghold (Figure 1b). We also surveyed MaePing NP (17˚35’N 98˚48’E); however, due to the low number of detections, we were unable to estimate density in this protected area. Nevertheless, we used the detected records to assess the remaining suitable habitat within the stronghold.
The Phnom Dangrek Range (Figure 1c), in north-eastern Thailand along the border with Cambodia and Laos, has been identified as one of the six strongholds but still lacks reliable population data. The area comprises nine protected areas, six of which were surveyed in this study, i.e. Buntharik-Yotmon WS (14˚36’N 105˚25’E), PhuchongNayoi NP (14˚32’N 105˚23’E), Yoddom WS (10˚12’N 108˚48’E), PhanomDongrak WS (14˚20’N 104˚20’E), Huaisala WS (14˚21’N 104˚3’E), and HuaituptunHuaisamran WS (14˚19’N 103˚13’E). Surveys were not conducted in the remaining three protected areas within the stronghold: two are located on the Cambodian side and the other is subject to an on-going border dispute. The selected protected areas cover 2,527 km2 and are dominated primarily by evergreen forest, with sporadic patches of mixed deciduous forest that provide key habitat for Green Peafowl (Brickle Reference Brickle2002).
Estimating Green Peafowl density
Green Peafowl density in OpLuang NP was estimated using 9 transects of 800 m each, and in MaePing NP, 11 transects of 1 km each were established across dry forests (dry dipterocarp with small patches of mixed deciduous forest) (Figure 1b). In the Phnom Dangrek Range, 15 line transects, 1.5–3 km in length, were set along accessible trails and roads across six protected areas (Figure 1c). We focused on areas where Green Peafowl had been reported by both rangers and villagers in the last five years. At Buntharik-Yotmon WS, we established two 2-km transects and one 3-km transect; at Yoddom WS, two 3-km transects and one 1.5-km transect; at PhanomDongrak WS, two 3-km transects; at HuaituptunHuaisamran WS, two 3-km transects and two 2-km transects; at Huaisala WS, two 2-km transects; at PhuchongNayoi NP, one 2-km transect. Consecutive transects were placed at least 500 m apart to avoid overlap and therefore guarantee independence in data collection between them. The value was selected based on that recorded in previous surveys (Sukumal et al. Reference Sukumal, Thunhikorn and Savini2023). Transect lengths varied depending on trail accessibility and to ensure observers remained outside landmine areas. Surveys were conducted from December 2021 to March 2022 in the Phnom Dangrek Range, from November 2024 to January 2025 in OpLuang NP, and from March to April 2025 in MaePing NP. Each transect was walked during the daily peak calling periods (06h30–08h30 and 16h45–18h45), for a total of 6–18 times (twice a day for 3–9 consecutive days) to obtain a minimum of 40 detections in each area, following Buckland et al. (Reference Buckland, Anderson, Burnham, Laake, Borchers and Thomas2001). At the beginning, all observers walked the transects together to standardise data collection, particularly the estimation of distances to calling birds, and minimise detection errors among observers. Distances to each calling bird were recorded in 50-m intervals for nearby detections and 100-m intervals for more distant ones. When a bird was detected, the distance from the observer to the calling or sighted individual was recorded, and the angle to the bird was measured using a compass. To avoid double counting, repeated calls from the same location were corrected during the survey. We used DISTANCE version 7.3 to estimate density by pooling detections across all transects within each protected area. Key functions (uniform, half-normal, hazard rate, and negative exponential), along with adjustment series (cosine, simple polynomial, and Hermite polynomial) were examined, and the model with the lowest Akaike information criterion (AIC) was selected as the best fit, following Buckland et al. (Reference Buckland, Anderson, Burnham, Laake, Borchers and Thomas2001).
Defining suitable habitat and high-occupancy areas for Green Peafowl
Remaining suitable habitat was defined by comparing presence points with absence points. Presence points were derived from line transect records of Green Peafowl, mapped in ArcGIS Pro 3.3.0 (Esri 2024) by plotting the distance and bearing of calling birds. We created circular buffer areas with a 400-m radius centred around each location and selected only those with less than 95% overlap, treating them as independent records. The choice of a 400-m radius was informed by the minimum effective strip width estimated from density analysis using the DISTANCE program. In total, we recorded 10 locations from 9 transects in OpLuang NP, 1 location from 11 transects in MaePing NP, and 12 independent locations from 15 transects in the Phnom Dangrek Range. Absence points were derived from random locations along the transects, spaced at least 1 km apart, where no Green Peafowl were detected during the survey. In total, there were 11 absence locations in OpLuang NP and MaePing NP and 35 in the Phnom Dangrek Range. At each presence and absence point, we created a 400-m radius circular plot based on the minimum effective strip width estimated from density analysis using the DISTANCE 7.3 program. Overlapping plots were excluded to maintain independence. For each plot, we extracted habitat types and elevation. Habitat types were obtained from the Climate Change Land Cover 2015 data set (http://maps.elie.ucl.ac.be/CCI/viewer/download.php). The original data set included 37 habitat types; we eliminated unsuitable categories such as bare areas, urban areas, and water-bodies, and reclassified the remaining 19 into 15 major habitat types (Supplementary material Table S1). Elevation data were obtained from the Shuttle Radar Topography Mission (SRTM) data set (Farr et al. Reference Farr, Rosen, Caro, Crippen, Duren and Hensley2007), available at https://developers.google.com/earth-engine/datasets/catalog/USGS_SRTMGL1_003. Occurrence probability models were constructed using a GLM with logit link function and binomial error distribution to study the relationship between habitat types and altitude (predictor variables) and the probability of occurrence based on presence/absence data (response variable). Separate GLMs were run for the north-east and north-west regions to account for differences in topography that may influence habitat selection by the species as their densities tend to reduce with increasing elevation and raggedness as dry dipterocarp forest is primarily a lowland habitat. All predictor variables were tested for collinearity before running the models, and only pairs with correlation coefficients <0.6 (Zuur et al. Reference Zuur, Ieno and Elphick2010) were included in the same model. Before running the models, each predictor variable was standardised by dividing its value by the standard deviation to place all variables on a comparable scale. We selected the best GLM model based on the lowest AIC value (Burnham and Anderson Reference Burnham and Anderson1998). A confidence interval (CI) of 85% was used to assess the influence of predictor variables on Green Peafowl occurrence. Variables were considered significant if their 85% CIs did not include zero. An 85% CI was chosen to reflect the high uncertainty associated with the low number of recorded Green Peafowl locations and to reduce the likelihood of overlooking potentially important predictors in a data-limited context. All analyses were conducted in R (R Development Team 2025).
Assessing threats to the remaining suitable habitat
The current threat level and short-term conservation status were assessed for the remaining large, continuous patches of suitable habitat across the study area. Threats were assessed using spatio-temporal forest loss hotspots and the extent of coverage by protected areas.
Spatio-temporal forest loss hotspots were generated across the study area using the Emerging Hot Spot Analysis tool in ArcGIS, following Harris et al. (Reference Harris, Goldman, Gabris, Nordling, Minnemeyer and Ansari2017). The analysis applies the Getis–OrdGi* statistic (Ord and Getis Reference Ord and Getis1995) to identify statistically significant spatial clustering patterns (i.e. hot and cold spots) and then evaluates temporal changes in patterns using the Mann–Kendall test (Kendall and Gibbons Reference Kendal and Gibbons1990; Mann Reference Mann1945) to determine whether the patterns are persistent, increasing or decreasing over time. We used 30-m resolution annual forest loss raster data from 2000 to 2023 (Hansen et al. Reference Hansen, Potapov, Moore, Hancher, Turubanova and Tyukavina2013), limited to our study area (Figure 1). These data were converted to a netCDF space–time cube using the Create Space Time Cube tool in ArcGIS to aggregate forest loss events within space–time ‘bins’ (i.e. tallying the number of events within each bin), defined here by a spatial resolution of 250 m and a temporal resolution of 1 year/bin. The Emerging Hot Spot Analysis tool then compared the counts of forest loss events within each bin with those in a predefined neighbourhood distance (specified here as 5 km) and with the global average to calculate the relevant statistics. By default, the tool classified bins into 17 distinct spatio-temporal categories (1 non-significant, 8 hotspot, and 8 cold spot categories). We considered only the hotspot categories in this study.
Results
Estimated Green Peafowl density
In OpLuang NP, a total of 37 detections were recorded from 58 walking surveys covering 52.8 km, with Green Peafowl detected in eight transects. The candidate models included a model with a uniform key function and cosine adjustment, which had a total of parameters (k) of 1, an AIC of 514.3, a goodness-of-fit (GOF) test K-S P values of 0.614, a probability of detection of 0.56, and an effective strip width (ESW) of 592.65. Another model used a half-normal key function with cosine adjustment, also with one parameter (k = 1), an AIC of 515.37, a GOF test K-S P value of 0.71, a probability of detection of 0.55, and an ESW of 674.18. The third model was a hazard rate key function with cosine adjustment, which had two parameters (k = 2), an AIC of 515.47, a GOF test K-S P value of 0.927, a probability of detection of 0.48, and an ESW of 593.53. The fourth model had a negative exponential key function with cosine adjustment, with one parameter (k = 1), an AIC of 514.81, a GOF test K-S P value of 0.789, a probability of detection of 0.4, and an ESW of 491.28.
The best model, with the lowest AIC, was the model with the uniform key function and cosine adjustment. For this model, the density estimate for the whole survey area was 0.51 calling birds/km2 (CI = 0.28–0.93; 95% CI of ESW = 588.87–814.73; 95% CI of probability of detection = 0.48–0.66). In MaePing NP, only a single detection was recorded, so this site was excluded from the analysis (Table 1).
Density of Green Peafowl, estimated in two key areas: OpLuang National Park (Stronghold b) and the Phom Dangrek Range (Stronghold e)

A total of 45 detections were recorded from 104 walking surveys covering 255 km across 15 transects in six protected areas of the Phnom Dangrek Range in the north-east region. We detected Green Peafowl along seven line transects in three protected areas: two in Buntharik–Yotmon WS, two in Yoddom WS, and three in HuaituptunHuaisamran WS. The candidate models included a model with a uniform key function and cosine adjustment, which had one parameter (k = 1), an AIC of 583.19, a GOF test K-S P value of 0.055, a probability of detection of 0.53, and an ESW of 436.67. The second model was a half-normal key function with cosine adjustment, which had one parameter (k = 1), an AIC of 583.08, a GOF test K-S P value of 0.155, a probability of detection of 0.49, and an ESW of 402.57. The third model was a hazard rate key function with cosine adjustment, which had two parameters (k = 2), an AIC of 583.1, a GOF test K-S P value of 0.508, a probability of detection of 0.47, and an ESW of 389.11. The fourth model was a negative exponential key function with cosine adjustment, with one parameter (k = 1), an AIC of 583.19, a GOF test K-S P value of 0.388, a probability of detection of 0.35, and an ESW of 285.45.
The density estimate was based on the best model with the lowest AIC, which used a half-normal key function with cosine adjustment. The density for the whole area surveyed was 0.93 calling birds/km2 (CI = 0.33–2.64; 95% CI of ESW = 325.69–497.6; 95% CI of probability of detection = 0.40–0.60). Due to the low number of detections in each of three protected areas (fewer than 40 detections), we were unable to estimate population density separately for each of them. Specifically, 21 detections were recorded in Buntharik-Yotmon WS, 19 in Yoddom WS, and 5 in HuaituptunHuaisamran WS (Table 1).
Probability of occurrence and remaining suitable habitat
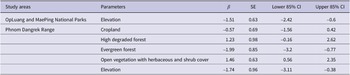
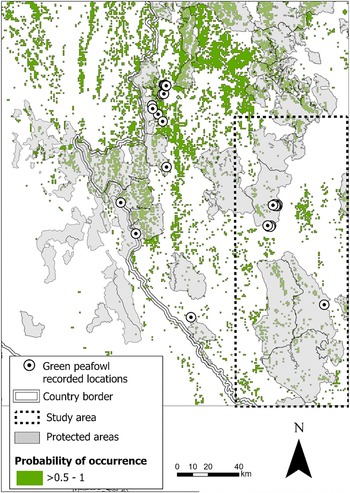
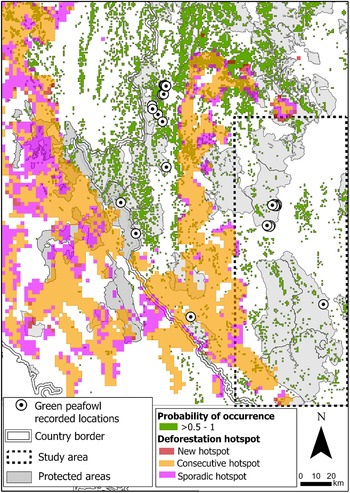
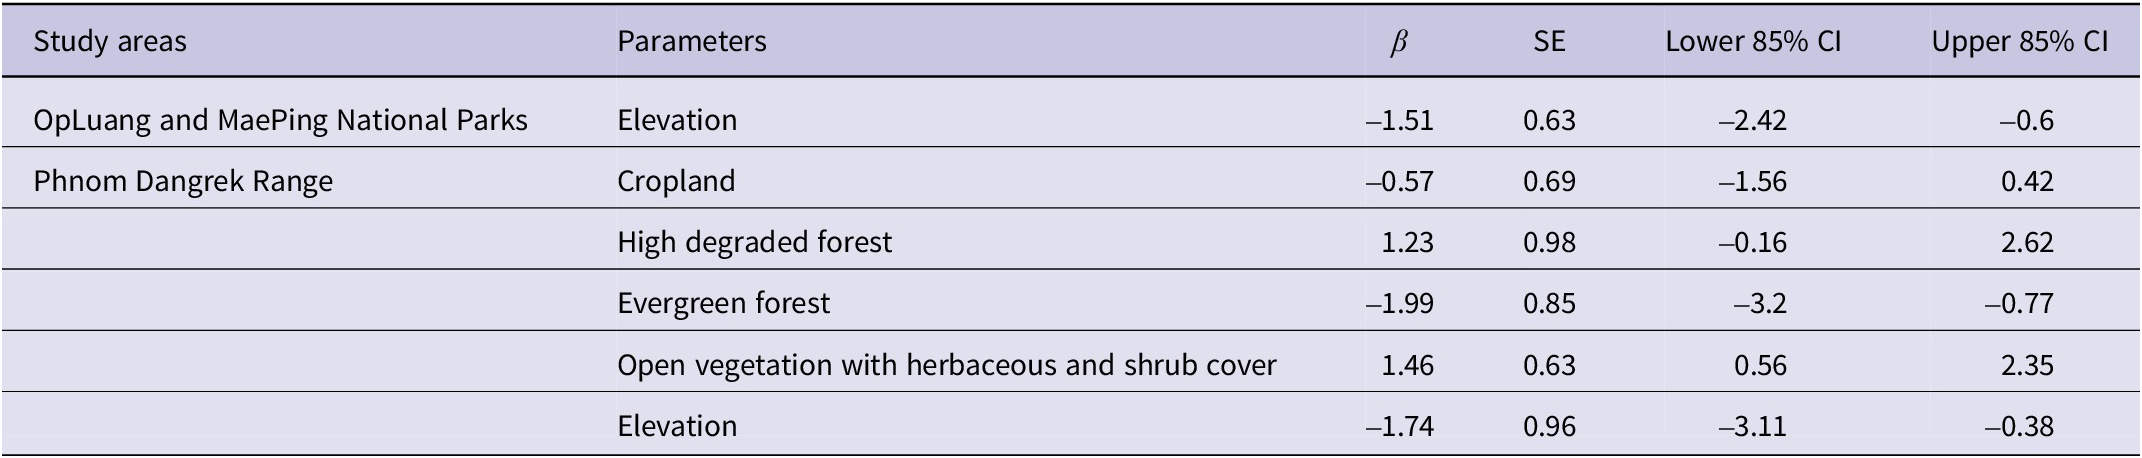
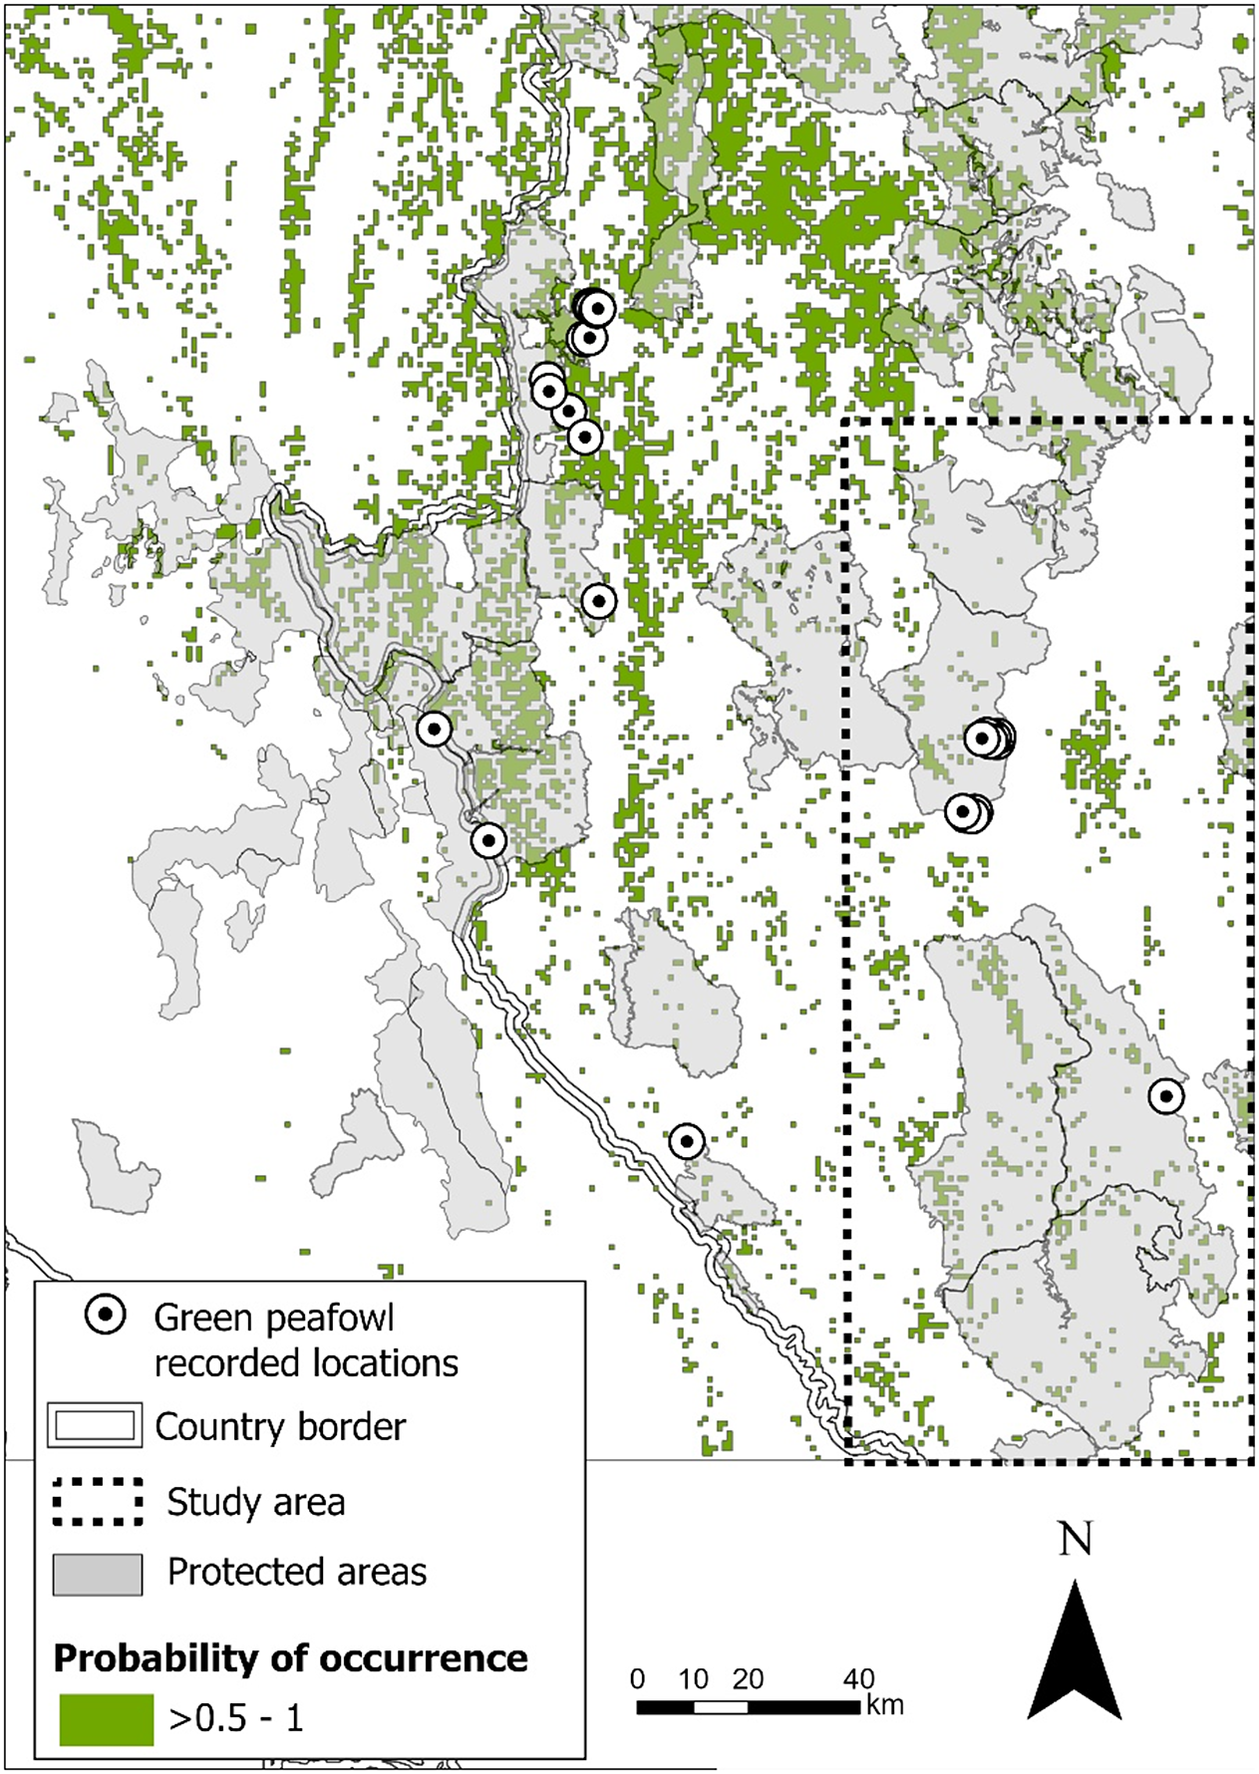
In the north-west Stronghold b, OpLuang NP and MaePing NP, the best model included only elevation as a predictor of occurrence probability. Green Peafowl were mostly found at low elevations (Table 2). To estimate the probability of occurrence in this region based on the remaining suitable forest types, we applied the best model from the 2021 survey by Sukumal et al. (Reference Sukumal, Thunhikorn and Savini2023), which was developed using occurrence data from a broader and more widely distributed area. This model predicted higher probabilities of occurrence with increasing coverage of pine, mixed deciduous, and dry dipterocarp forests. Based on this model, the predicted suitable habitat (probability of occurrence >0.5) for Green Peafowl within our study area is 991 km2, of which 473 km2 (47.73%) lie within protected areas (Figure 2). When combined with the results reported by Sukumal et al. (Reference Sukumal, Thunhikorn and Savini2023), the total suitable habitat within this stronghold extends to 7,197 km2, of which 2,657 km2 (36.92%) lie within protected areas (Figure 2).
Parameters influencing the probability of Green Peafowl occurrence, analysed separately by region using recorded locations from the study areas
The probability of Green Peafowl occurrence (>0.5), shown as a green polygon, is concentrated in Stronghold b. Recorded survey locations were clustered within a small area (depicted by a circle with a black dot at the centre inside a dashed rectangular box). This probability estimate is based on the best model from the 2021 survey by Sukumal et al. (Reference Sukumal, Thunhikorn and Savini2023), which predicts a high probability of occurrence in pine, mixed deciduous, and dry dipterocarp forests.
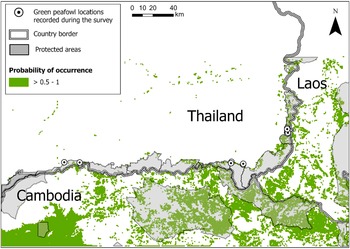
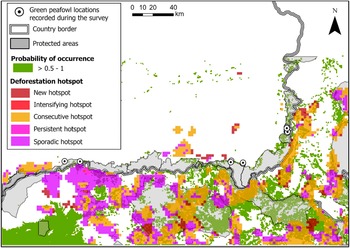
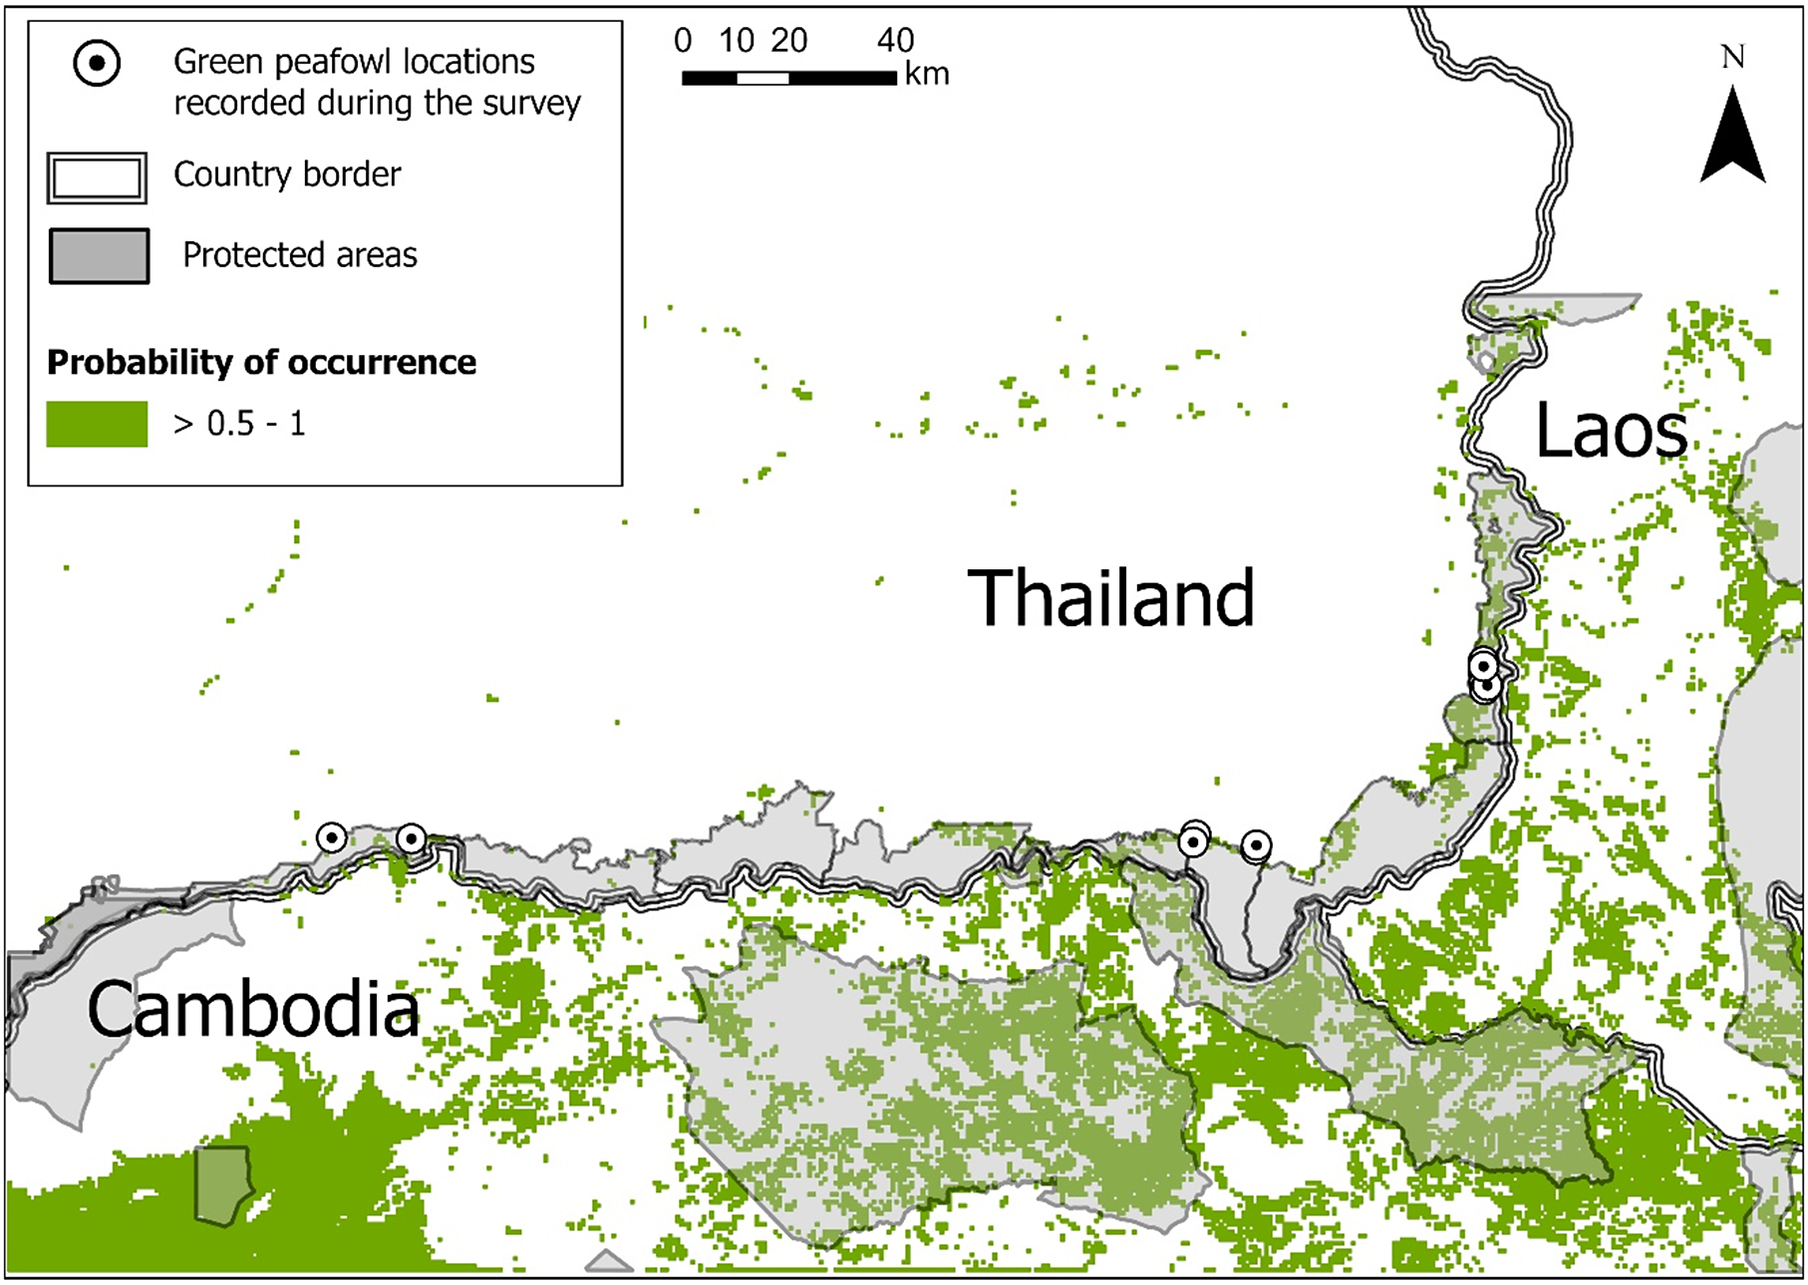
In the north-east Stronghold e, Phnom Dangrek Range, the best model (lowest AIC) was an average of three models with ΔAIC less than two. The averaged model included cropland, highly degraded forest, evergreen forest, open vegetation with herbaceous and shrub cover, and elevation. However, based on the 85% CI, only evergreen forest, open vegetation with herbaceous and shrub cover, and elevation significantly influenced the probability of Green Peafowl occurrence. The species showed a high probability of occurrence in open vegetation with herbaceous and shrub cover at low elevations, while avoiding areas dominated by evergreen forest (Table 2). The predicted suitable habitat (probability of occurrence >0.5) for Green Peafowl across the Phnom Dangrek Range study area, which includes Thailand, Laos, and Cambodia, covers 9,917 km2, of which 3,518 km2 (35.47%) lie within protected areas (Figure 3).
The probability of Green Peafowl occurrence (>0.5), shown as a green polygon, in Stronghold e (Phnom Dangrek Range), based on recorded survey locations (depicted by a circle with a central black dot). This model predicts a high probability of occurrence in open vegetation with herbaceous and shrub cover at low elevations.
Deforestation of the remaining habitats
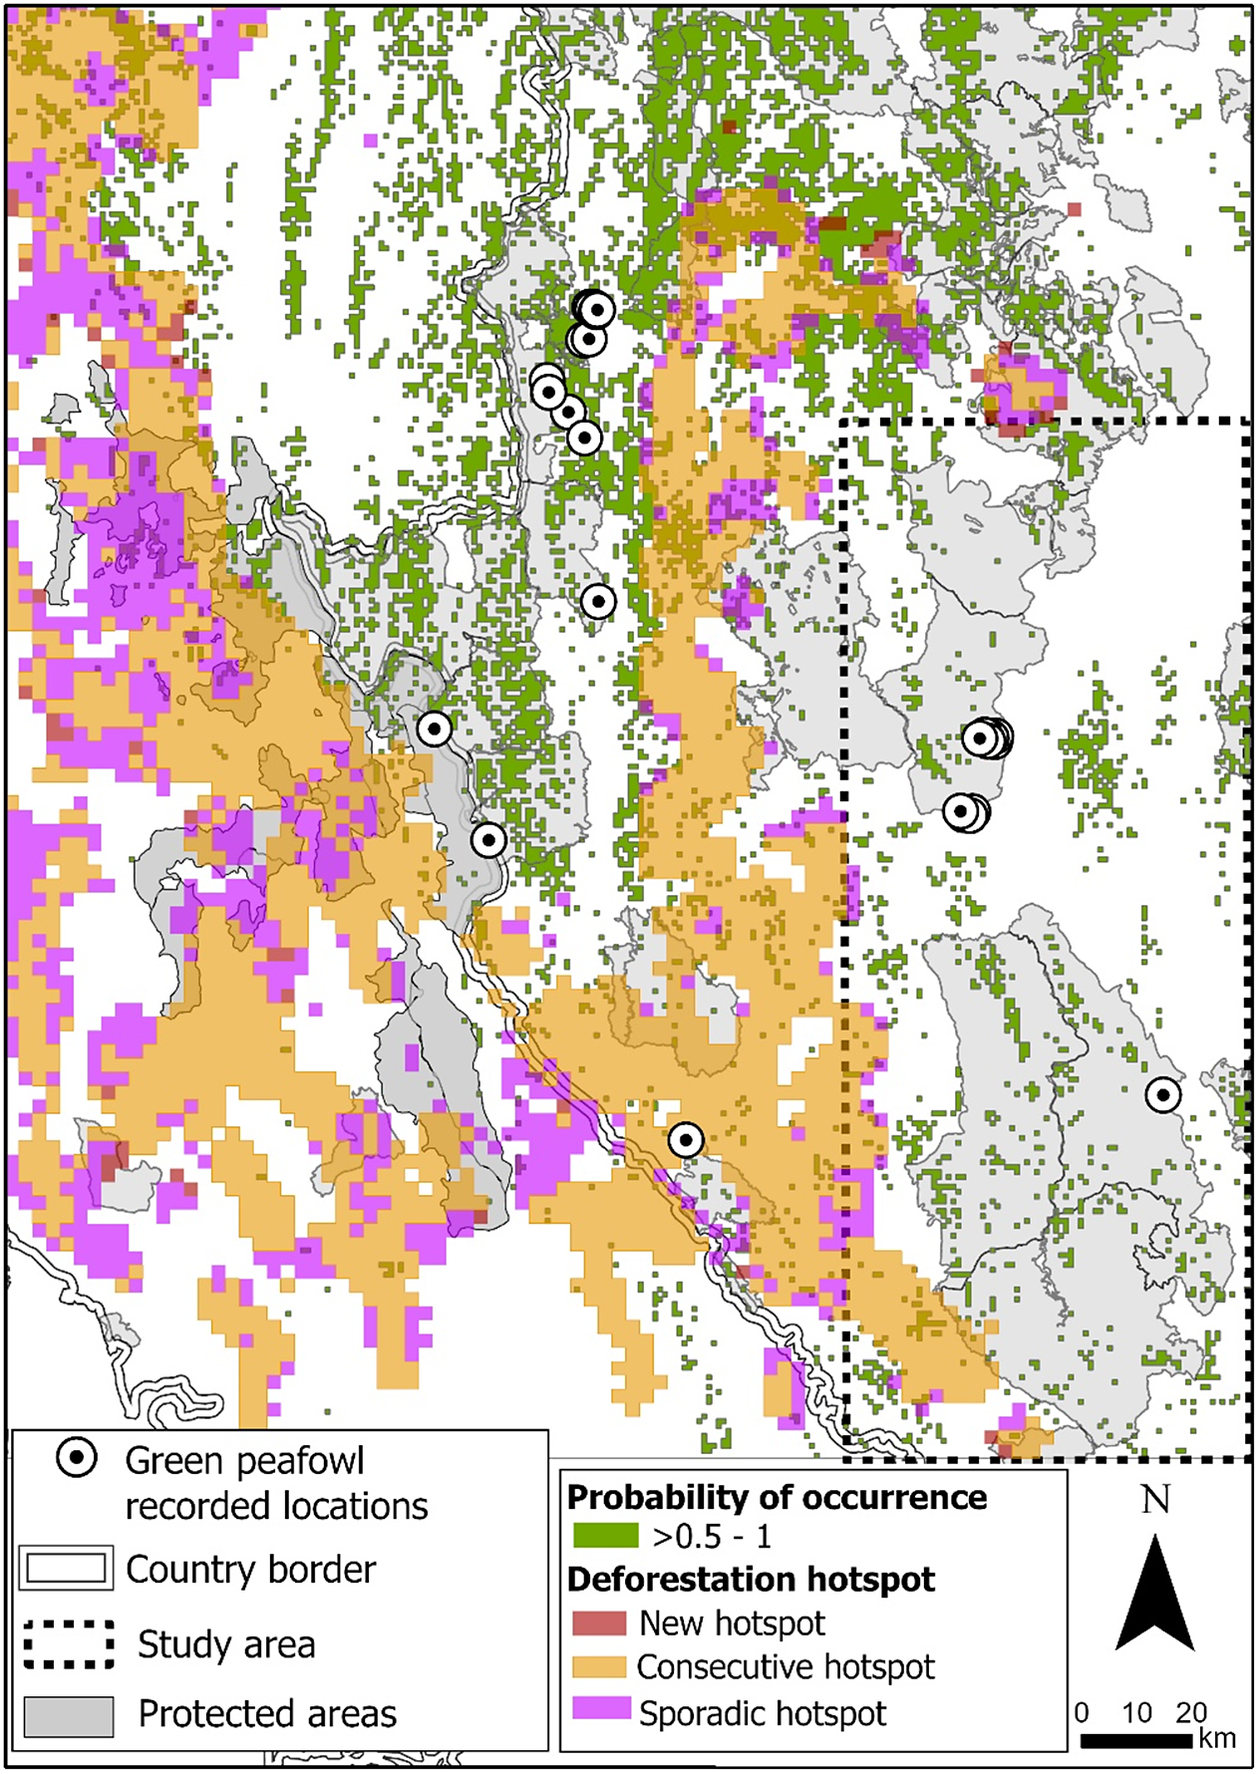
In the north-west Stronghold b, deforestation hotspots covered 17,177 km2, comprising 11,992 km2 classified as consecutive hotspots, 4,875 km2 as sporadic hotspots, and 310 km2 as new hotspots. Of this area, 2,391 km2 fell within protected areas, comprising 1,433 km2 of consecutive hotspots, 892 km2 sporadic hotspots, and 66 km2 new hotspots (Figure 4). Within suitable habitat, deforestation totalled 1,374 km2, 963 km2 in consecutive hotspots, 377 km2 in sporadic hotspots, and 34 km2 in new hotspots.
Deforestation hotspots within Stronghold b.
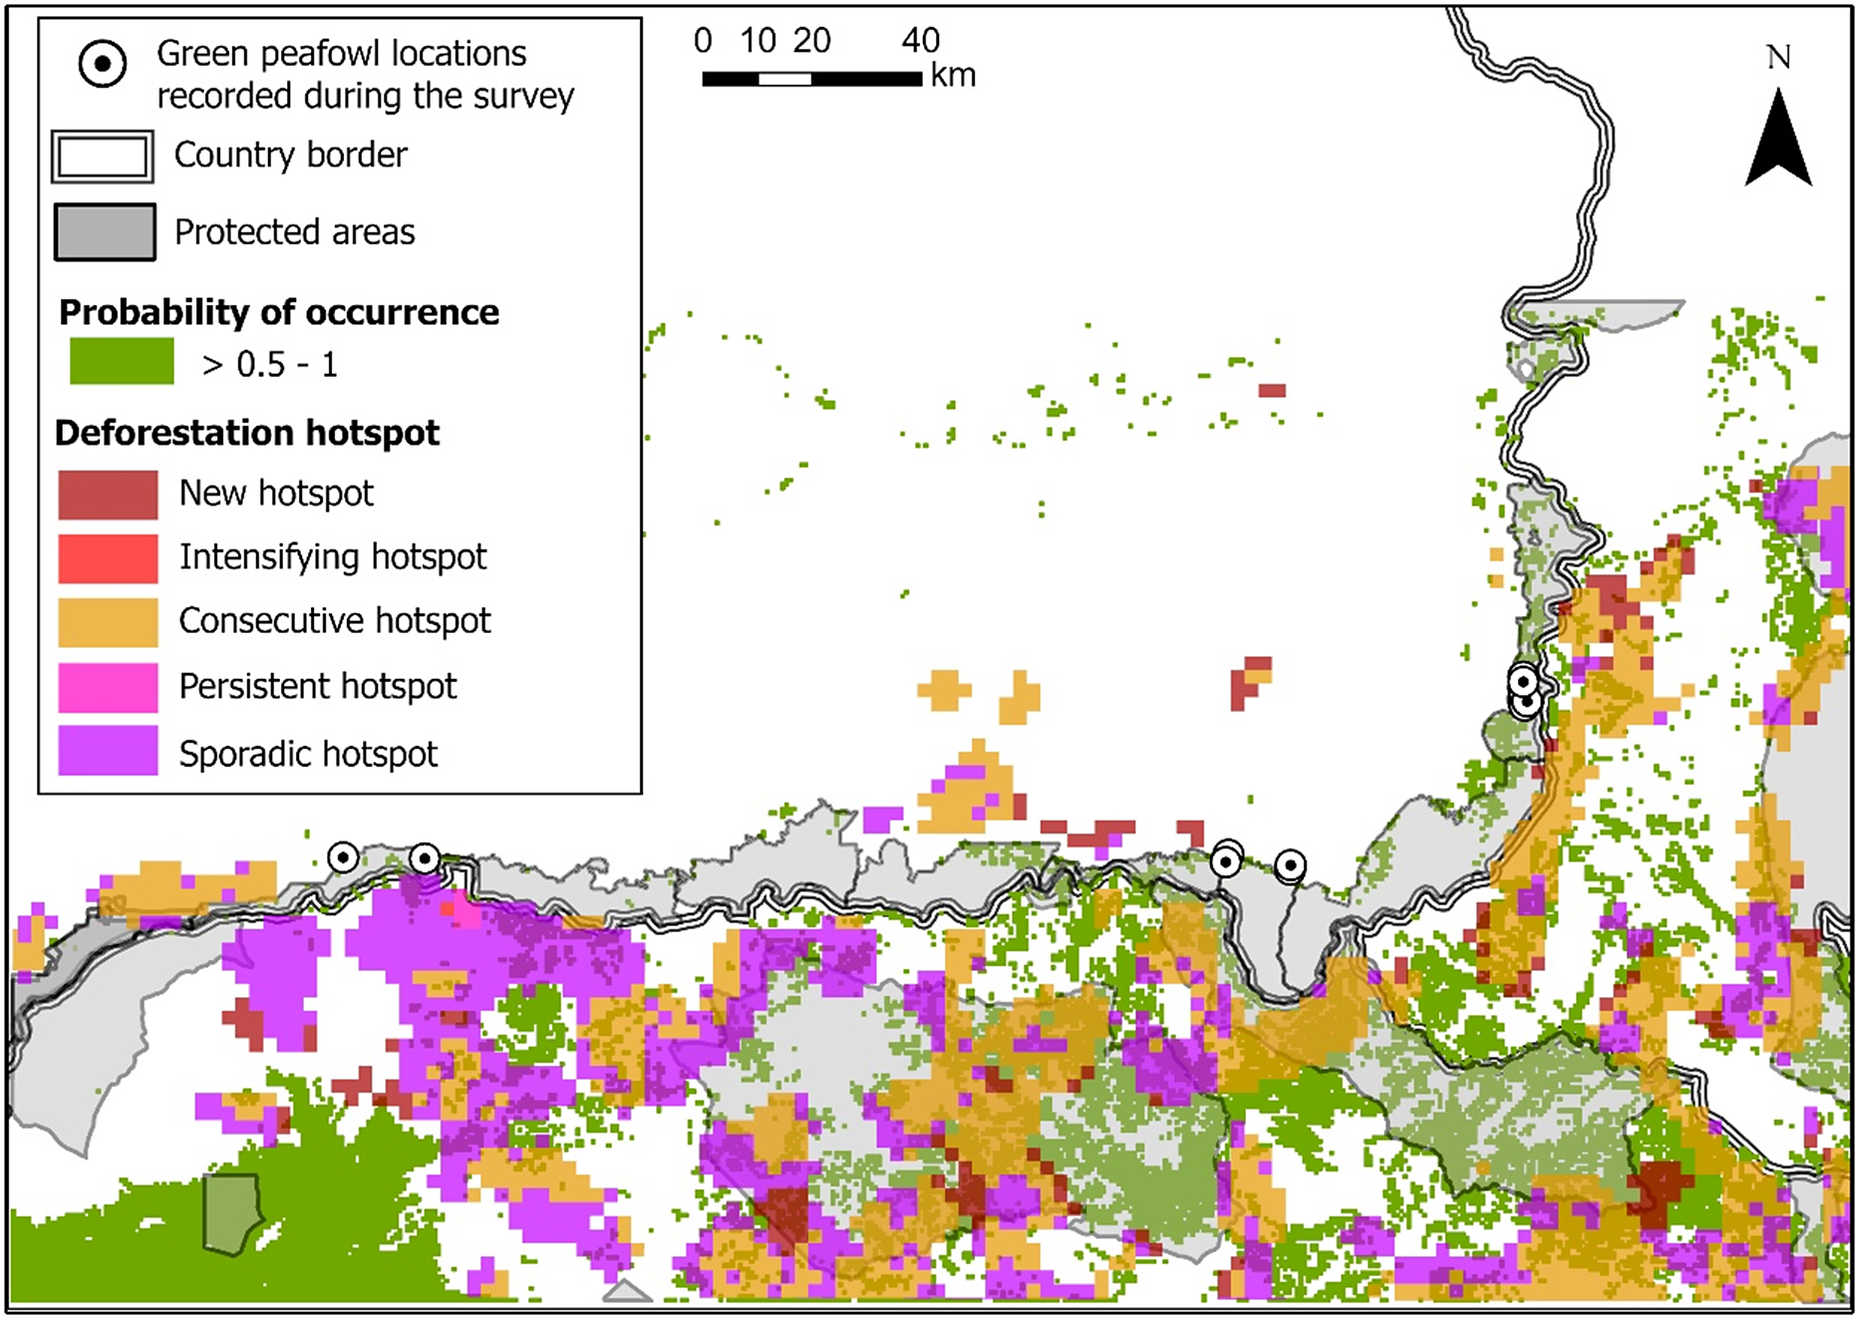
In the north-east Stronghold e, the total deforestation hotspot area covered 13,353 km2, 6,308 km2 classified as consecutive hotspots, 4,973 km2 as sporadic hotspots, 1,035 km2 as new hotspots, 31 km2 as persistent hotspots, and 6 km2 as intensifying hotspots. Of this area, 3,437 km2 fell within protected areas, comprising 2,080 km2 of consecutive hotspots, 1,065 km2 sporadic hotspots, and 292 km2 new hotspots (Figure 5). Additionally, 3,407 km2 of deforestation occurred within suitable habitat, comprising 1,954 km2 of consecutive hotspots, 1,142 km2 sporadic hotspots, 309 km2 new hotspots, and 2 km2 persistent hotspots.
Deforestation hotspots within Stronghold e.
Discussion
Our results confirmed that in both strongholds Green Peafowl primarily range in lowland dry forest, as observed in other parts of their range (Sukumal et al. Reference Sukumal, Dowell and Savini2020a). Unfortunately, this habitat is now highly fragmented, occurring only in small patches surrounded by agricultural land. However, the area is also extensively covered by native species plantations (e.g. teak), which may serve as corridors or suboptimal habitat (Win et al. Reference Win, Sukumal, Shwe and Savini2023), helping to support viable long-term populations. As for other sites where the species ranges between small patches of natural lowland habitat and plantations (Shwe et al. Reference Shwe, Sukumal, Oo, Dowell, Browne and Savini2021), one of the main threats in both strongholds is predation by domestic dogs, which poses a significant risk to Green Peafowl survival as reported for other areas. Dogs in those areas are both domestic animals, roaming the proximity of villages, and feral animals, widely ranging within the protected areas and surrounding farmlands as reported for Stronghold c (Marshall et al. Reference Marshall, Sukumal, Ngoprasert and Savini2023b) and broadly suggested for the whole region (Marshall et al. Reference Marshall, Grainger, Sukumal and Savini2022). As for other strongholds, we suggest managing dog populations with nonlethal methods, including sterilisation for pet dogs and trap-neuter-vaccinate-return programme for feral ones. Moreover, awareness among villagers on issues linked to dog–wildlife conflicts is also recommended (Marshall et al. Reference Marshall, Gore, Ngoprasert and Savini2023a).
Following an extensive survey across five protected areas in 2021, Stronghold b, located in north-western Thailand and eastern Myanmar around the Salawin River, was classified as a ‘potential stronghold pending management’ due to low overall detection numbers for Green Peafowl (Sukumal et al. Reference Sukumal, Thunhikorn and Savini2023). The two density estimates from our study provide mixed evidence for this classification. In OpLuang NP, density was relatively high at 0.51 birds/km2, roughly double the previous estimate of 0.27 birds/km2 reported for the entire area covered in the previous study (Sukumal et al. Reference Sukumal, Thunhikorn and Savini2023). However, both values were much lower than those reported for two other strongholds in Thailand, 15.8 birds/km2 in northern Stronghold c (Sirindnirun et al. 2021) and up to 11.34 birds/km2 in western Stronghold d (Sukumal et al. Reference Sukumal, Dowell and Savini2017). Unfortunately, as in the rest of Stronghold b, density in MaePing NP could not be estimated because detections were too few, even though the area is extensively covered by apparently suitable dry forest. Overall, this stronghold contains relatively little suitable habitat, largely due to its hilly and montane topography. However, this habitat faces very low pressure from deforestation, as most hotspots do not affect the dry forests. These findings highlight the importance of the stronghold for the long-term survival of Green Peafowl and support previous recommendations for increased active management (Sukumal et al. Reference Sukumal, Thunhikorn and Savini2023).
The survey conducted across six protected areas on the Thai side of Stronghold e estimated a density of 0.93 birds/km2, with detections recorded along 7 of 45 transects in 3 of the 6 protected areas surveyed. This result aligns with estimates from Siem Pang WS, the only other protected area surveyed on the eastern edge of the stronghold in northern Cambodia, where densities were 1.7 males/km2 in riverine habitat and 0.35 males/km2 in non-riverine habitat (Loveridge et al. Reference Loveridge, Kidney, Ty, Eang, Eames and Borchers2017). The low density estimated for the Thai side of the stronghold could be explained by the low extension of relatively low-quality suitable habitat found in this area. Stronghold e consists of a large, continuous expanse of suitable habitat in the Cambodian lowlands, with only a few fragments remaining in Thailand on the upper Phnom Dangrek cliff, mostly formed by low quality habitat on a large extent of rocky exposed ground. These fragments represent remnants of the extensive deforestation that swept across north-eastern Thailand in the 1950s. However, in the past two decades, deforestation has not been a major issue here, most likely due to the widespread landmine fields in the area dating back to the Khmer Rouge period. The Thai section of the stronghold is effectively isolated from the rest by the steep elevation difference between the cliff top and base (between 150 m and 200 m). The largest portion of suitable habitat, with the highest predicted occupancy, is found in the lowlands of northern Cambodia, where deforestation hotspots are widespread due to a national increase in deforestation (Pauly et al. Reference Pauly, Crosse and Tosteson2022). No population estimates are available for Green Peafowl in the area, and extensive fires pose an additional threat, having been reported to reduce the species’ viability (Sim et al. Reference Sim, Wee, Alcantara and Park2023; Sukumal et al. Reference Sukumal, Grainger and Savini2020b). Cambodia has also reported widespread snaring (Gray et al. Reference Gray, Belecky, O’Kelly, Rao, Roberts and Tilker2021), which negatively affects ground-dwelling species. Collectively, these threats pose a serious risk to the survival of Green Peafowl in both the short and long term, underscoring the need for an extensive, systematic survey to establish a baseline for future monitoring. Hybridisation with Blue Peafowl presents an additional threat, as most detections occur along small, fragmented habitat edges near human settlements where domestic Blue Peafowl are commonly kept. During our survey, hybrid individuals were observed in PhanomDongrak WS. As this threat is often underestimated by protected area management, urgent action is needed to reduce the risk by actively removing Blue Peafowl or hybrids, when observed, from any protected area and proximity.
Supplementary material
The supplementary material for this article can be found at http://doi.org/10.1017/S0959270925100385.
Acknowledgements
This research project was supported by King Mongkut’s University of Technology Thonburi (KMUTT), Thailand Science Research and Innovation (TSRI), and National Science, Research and Innovation Fund (NSRF) Fiscal Year 2023 (Grant number FRB660073/0164) and Fiscal Year 2024 (Grant number FRB670016/0164). Special thanks to the chiefs of OpLuang National Park (NP), MaePing NP, Buntharik-Yotmon Wildlife Sanctuary (WS), Yoddom WS, PhanomDongrak WS, HuaituptunHuaisamran WS, Huaisala WS, and PhuchongNayoi NP for their assistance in coordinating logistics during data collection. English editing was provided by O. Nnaemeka. The research permit was granted by the Department of National Parks, Wildlife and Plant Conservation. Special thanks to Peter Garson and two anonymous reviewers for their constructive comments.