Introduction
Gliomas are the most common primary tumours of the central nervous system and their management has historically been one of the most challenging fields in medicine.Reference Barnett 1
Malignant gliomas are widely infiltrative in their extension with indistinct tumour margins that are difficult to accurately defineReference Stupp, Hegi and Mason 2 , Reference Teoh, Clark, Wood, Whitaker and Nisbet 3 and delivering radiotherapy is complex due to the proximity between tumour and organs at risk (OARs).
Cognitive symptoms for patients with high-grade gliomas (HGG) can vary from acute to chronic memory loss, personality change, confusion, speech problems and severe headaches.Reference Teoh, Clark, Wood, Whitaker and Nisbet 3 Other common symptoms of HGG include muscle weakness, visual symptoms, and changes in sensation.Reference Batchelor 4 Alongside the neurocognitive damage caused by the tumour, the effect of radiation to normal brain tissue (NBT) also results in cognitive impairmentReference Schagen, Klein and Reijneveld 5 and can be one of the more troubling side-effects of radiotherapy to the brain.Reference Ricard, Idbaih, Ducray, Lahutte, Hoang-Xuan and Delattre 6 , Reference Symonds, Deehan, Mills and Meredith 7
In practice, many departments have progressed to intensity-modulated arc therapy (IMAT) also referred to as RapidArc and volumetric-modulated arc therapy (VMAT) from the manufacturers of Varian and Elekta, respectively. VMAT techniques make it easier to target brain tumours whilst reducing dose to critical structures nearby.Reference Teoh, Clark, Wood, Whitaker and Nisbet 3 , Reference Symonds, Deehan, Mills and Meredith 7 Such damage limitation strategies are increasingly important for the long-term clinical outcome of patients with HGG who are benefiting from combined chemo-radiation programmes.Reference Mirimanoff, Gorlia and Mason 8 However, a recent review by Teoh et al.Reference Teoh, Clark, Wood, Whitaker and Nisbet 3 has raised concerns regarding the progress to IMAT as the optimal method of treatment delivery; specifically with regards the dose to NBT from IMAT compared with three-dimensional conformal radiotherapy (3DCRT).
As survival outcomes improve for patients with HGG,Reference Teoh, Clark, Wood, Whitaker and Nisbet 3 , Reference Mirimanoff, Gorlia and Mason 8 an increase in number of patients suffering from late effects of radiation may also be possibly seen. Hence, innovative methods to minimise treatment-related, long-term toxicities are needed to further improve outcomes for these patients.Reference Panet‐Raymond, Ansbacher and Zavgorodni 9
Purpose
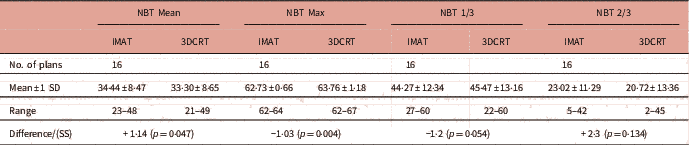
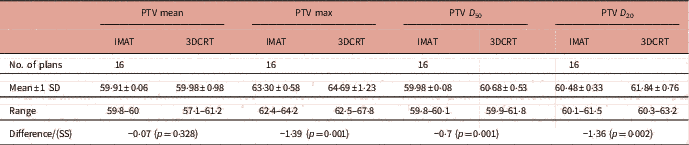
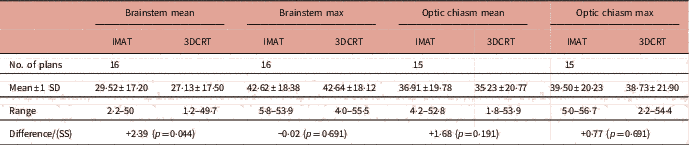
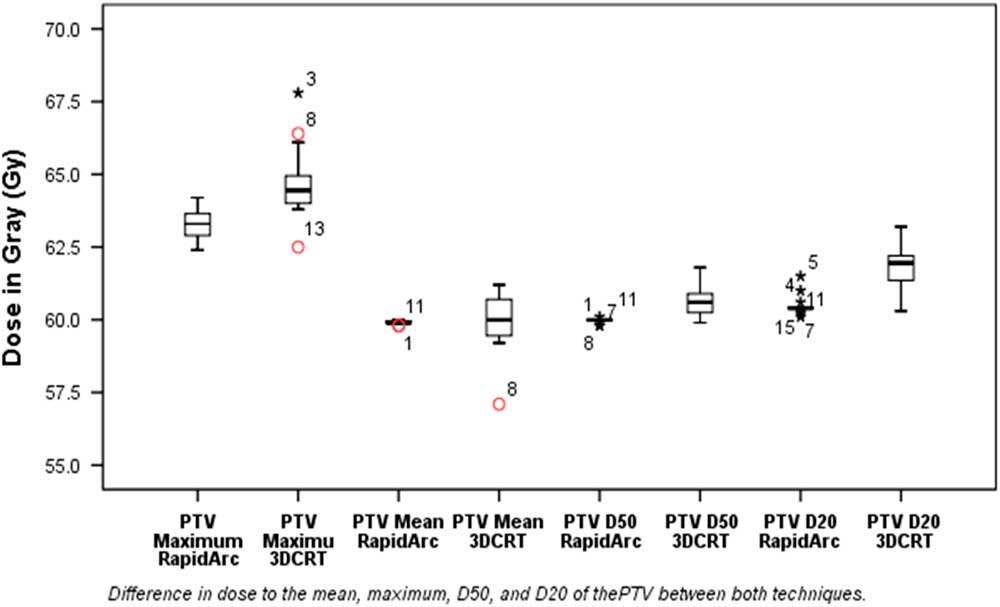
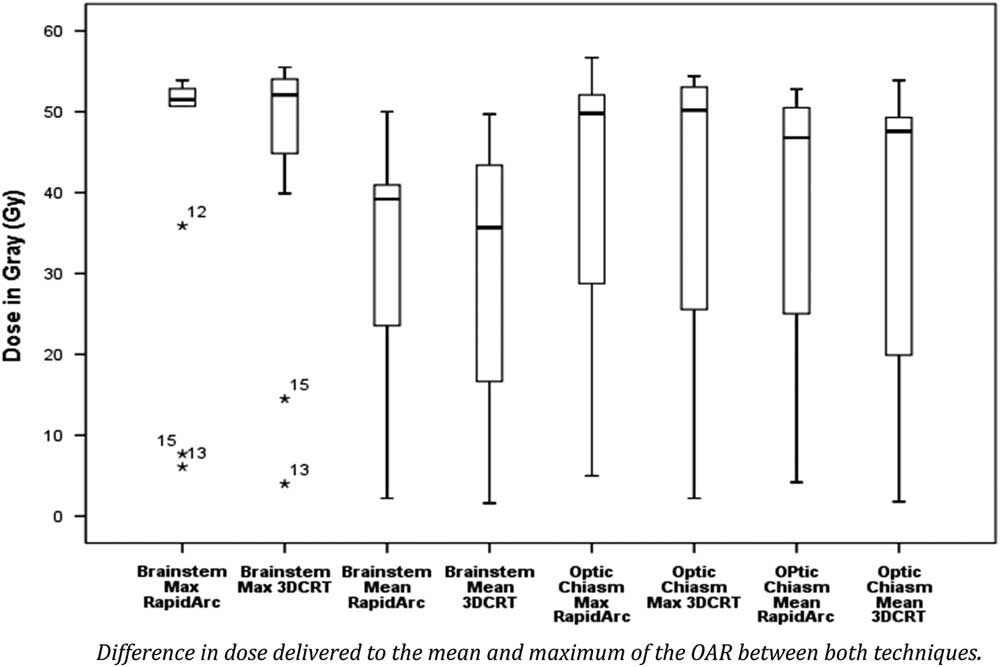
This study was a service evaluation of local department practice which has progressed from 3DCRT to IMAT as the standard technique used for treating brain tumours. This study set out to compare dose–volume histograms (DVH) of previously treated 3DCRT plans with corresponding IMAT plans based on the same patient data. The primary outcome was the maximum, mean, 1/3 and 2/3 doses to the NBT outside of the planning target volume (PTV) see Table 1. The maximum, mean, D 50 and D 20 doses to the PTV were also analysed (Table 2). The D 50 was analysed as this is the median dose to the PTV. The D 20 is where the highest dose is received by 20% of the PTV. D 20 was evaluated as a measure of the homogeneity of the dose within the PTV, according to department protocol; the maximum dose, D max, was used rather than D 98 as this metric is used in the department protocol. Secondary outcomes were maximum and mean doses to the brainstem and optic chiasm (Table 3).
Statistics for normal brain tissue (NBT) data (Gy)

Notes: Values are expressed as p-value (p=), mean±1 SD or as mean value according to data distribution shown in Table 1.
Abbreviations: SD, standard deviation; SS, statistical significance.
Statistics for planning target volume (PTV) data (Gy)
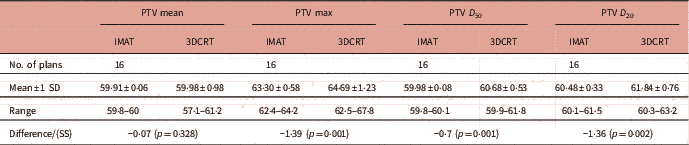
Notes: Values are expressed as p-value (p=), mean±1 SD or as mean value according to data distribution shown in Table 2.
Abbreviations: SD, standard deviation; SS, statistical significance.
Statistics for organs at risk (OARs) data (Gy)
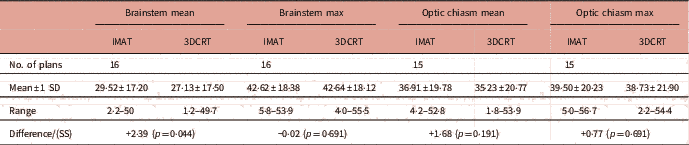
Notes: Values are expressed as p-value (p=), mean±1 SD or as mean value according to data distribution shown in Table 3.
Abbreviations: SD, standard deviation; SS, statistical significance.
Method
A total of 16 3DCRT treatment plans of WHO grade 3 gliomas created between 2011 and 2013 were randomly selected. The sample size is comparable with similar studies.Reference Sharyan, Allehyani and Tolba 10 – Reference Shaffer, Nichol and Vollans 13
The 3DCRT treatment plans were prescribed 60 Gy in 30 fractions, and calculated with 6 MV photons, adhering to department protocols. All patients were immobilised supine in a beam direction shell.
The 3DCRT treatment plans contours were based on International Commission on Radiation Units (ICRU) report 50 and 62. 14 , 15 Gross tumour volume (GTV) was defined as the contrast-enhancing tumour on a T1-weighted magnetic resonance image fused with a computed tomography (CT) scan, both 2·5 mm slice thickness. The GTV and the post-operative tumour bed were expanded by 2·5 cm (in three dimensions) within anatomic routes of spread to create the clinical target volume (CTV). Any oedema noted on the scans was also included in the CTV. The CTV was then expanded isotropically by 0·5 cm to create the PTV. Contoured OARs were the brainstem, optic chiasm, right and left optic nerves, retinas, lenses, lacrimals and the normal brain. Treatment plan 2, did not have the optic chiasm contoured owing to increased distance between the tumour and the optic chiasm.
IMAT planning
The 3DCRT treatment plans were re-planned with the IMAT technique using the Eclipse Varian Medical Planning System version 13.6 (Varian Medical Systems, Palo Alto, CA, USA). The addition of ICRU report 83 16 was used for creating the IMAT treatment plans. For the purpose of this study it was decided to use ‘like for like’ with the prescription of 60 Gy in 30 fractions.
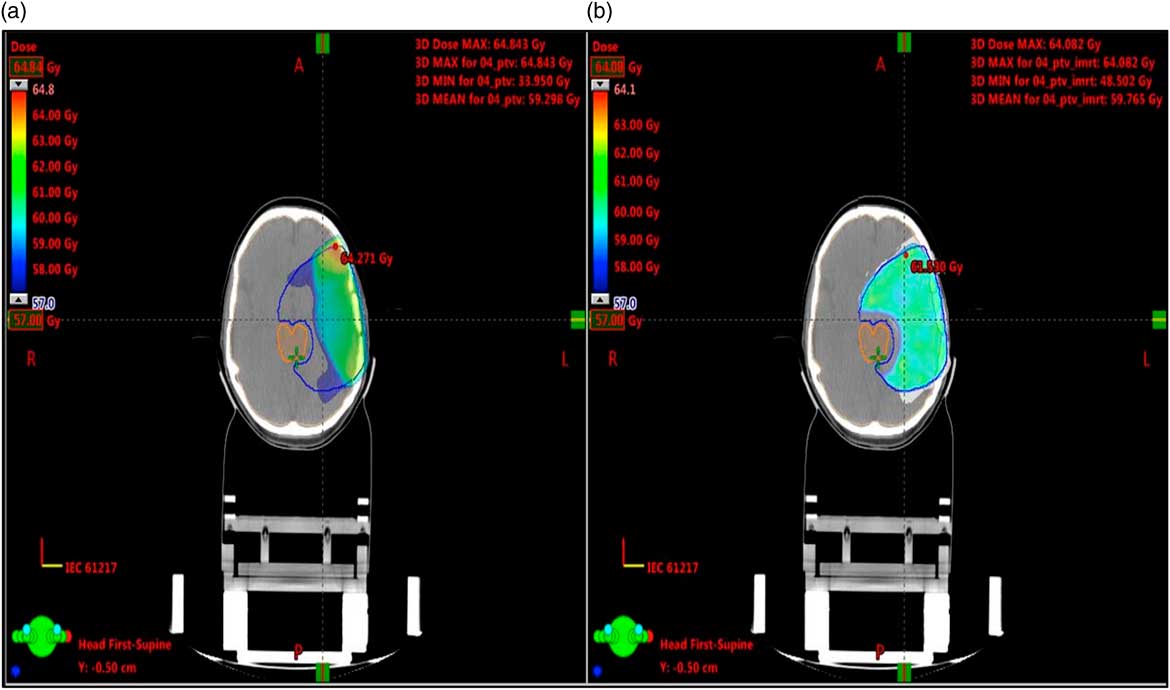
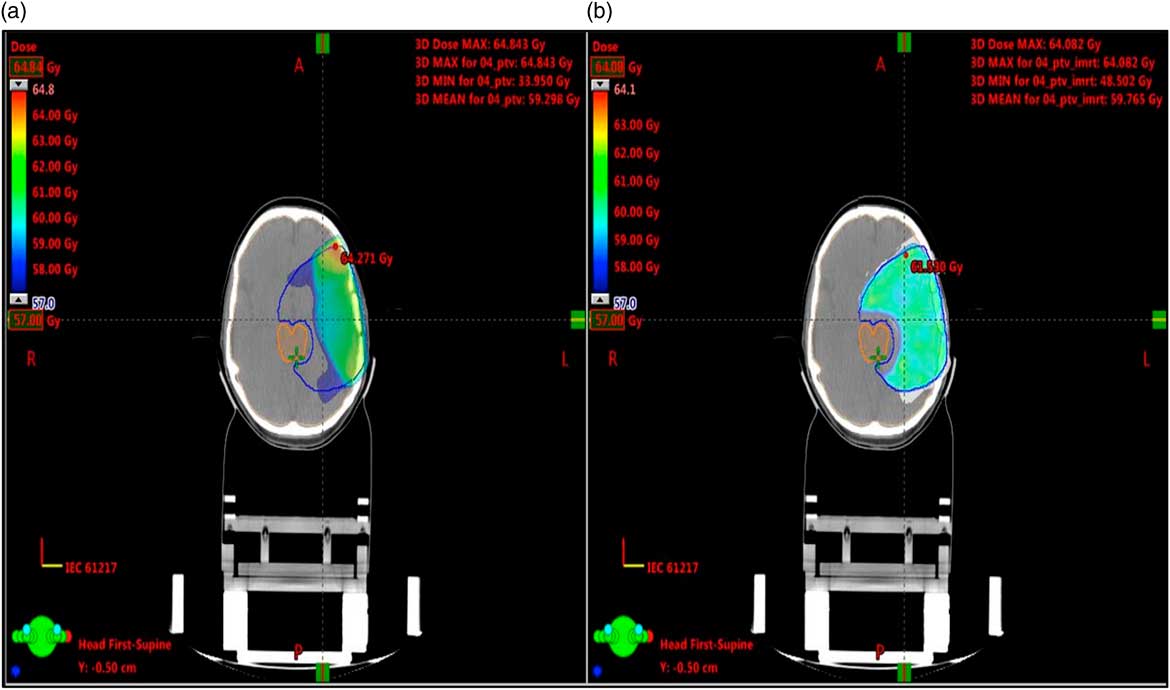
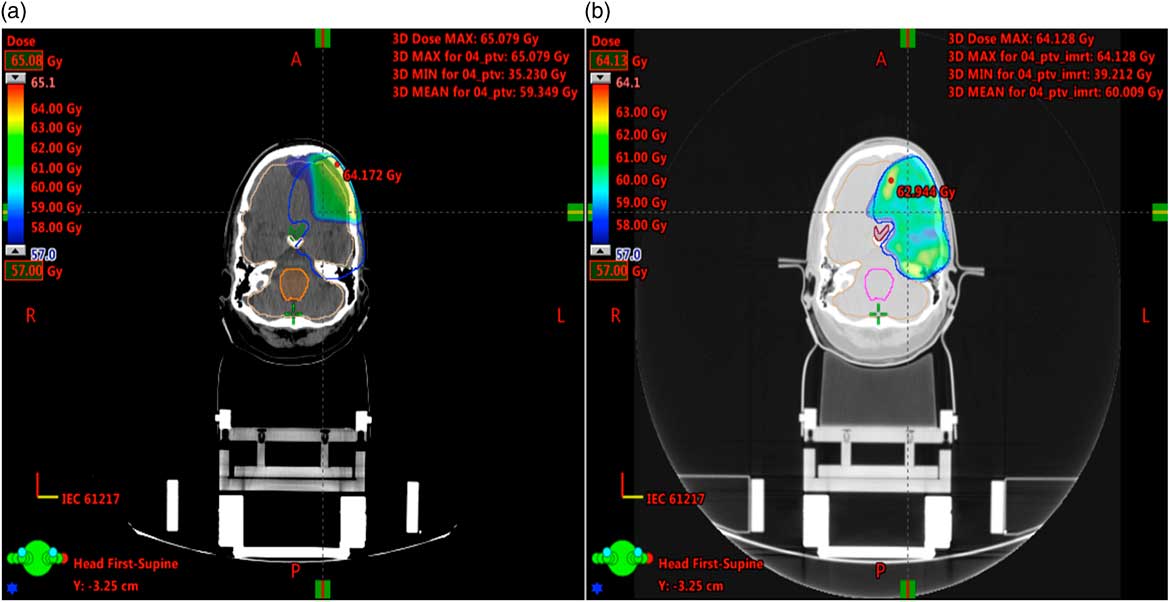
The OARs were at least two slices thick, so that meaningful DVH could be calculated. A margin of 3 mm planning risk volume (PRV) was added to the OARs. Where the PTV overlapped an OAR, the overlap region was designated only as OAR rather than PTV, using the ‘Boolean’ technique and creating an additional PTV. Therefore, the original PTV was modified to exclude the OAR, as illustrated by the exclusion of the brainstem from the PTV in Figure 1. None of the CTVs overlapped with OARs.
Illustrates the dose distribution with the exclusion of brainstem from planning target volume (PTV) for (a) three-dimensional conformal radiotherapy (3DCRT) and (b) intensity-modulated arc therapy (IMAT) for the same patients plan at the same CT slice. Blue line=PTV; pink line=brainstem.
The IMAT plans were created with two goals in mind: firstly to achieve PTV coverage without violating PTV conformity, OAR doses and avoid hotspots. Second to reduce OAR doses as much as possible without compromising the PTV coverage and conformity. Following department protocol the maximum dose within the PTV was 105% and the minimum dose within the PTV was 95%.
IMAT plans were created using two full gantry rotation arcs. Several studies have found that the use of two arcs result in better plan quality as using a single arc is insufficient to achieve dose constraints.Reference Teoh, Clark, Wood, Whitaker and Nisbet 3 , Reference Sharyan, Allehyani and Tolba 10 , Reference Wagner, Christiansen, Wolff and Vorwerk 11
Analysis
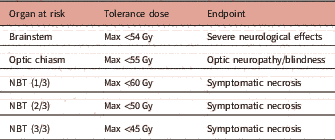
A comparative visual dosimetric analysis was performed on the 32 CTs and the DVHs of each treatment plan were statistically compared. The statistical analysis of tolerance doses for the NBT, brainstem and optic chiasm were made using the QUANTEC dose tolerance data by Marks et al.Reference Marks, Yorke and Jackson 17 and the department protocol as surrogate (Table 4).
Tolerance doses used for creating treatment plans
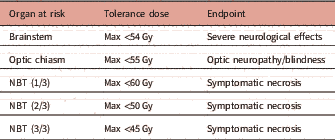
Note: Adapted from department protocols and Marks et al.17
Abbreviation: NBT, normal brain tissue.
Mean doses were not considered clinically relevant for the serial OARs: optic chiasm, and brainstem, but was relevant for the parallel OARs: retina and lens,Reference Marks, Yorke and Jackson 17 – Reference Knisely and Baehring 19 so it was ensured that ipsilateral (if possible) and contralateral doses to OAR were within their tolerance.
The Wilcoxon matched-pair signed-rank test for non-parametrically distributed data was used to compare the means between 3DCRT and IMAT treatment plans. All statistical tests were two-tailed. SPSS software version 24 was used for statistical analysis.
Results
Tables 1, 2 and 3 illustrate the results for NBT, PTV and OAR data, respectively.
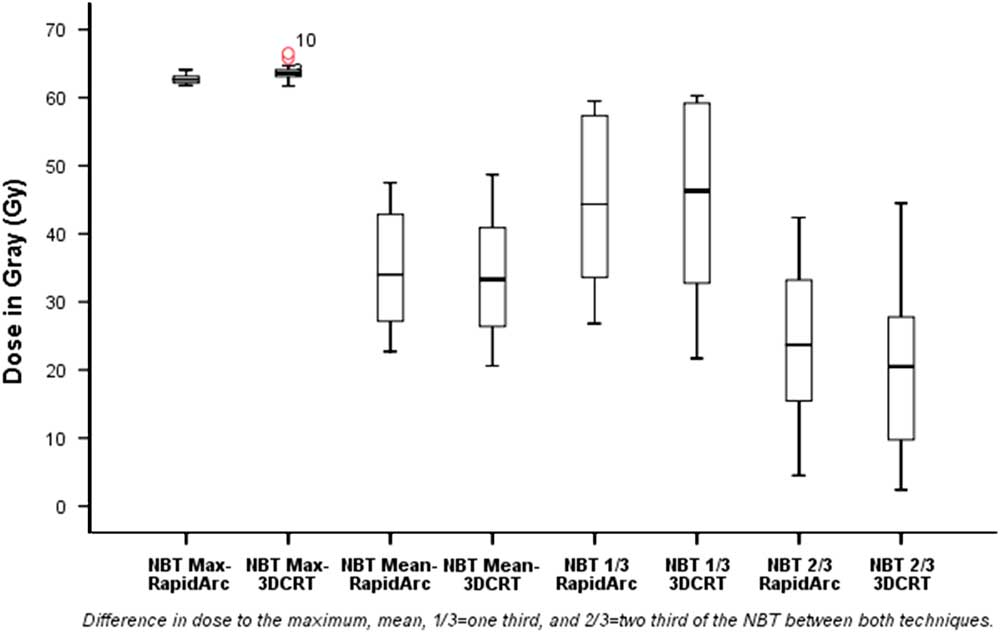
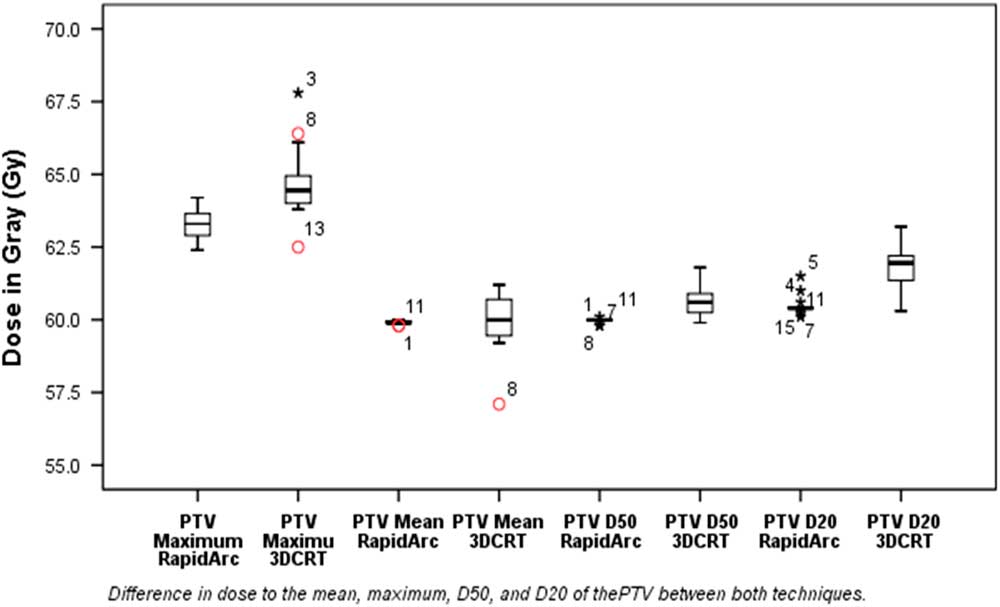
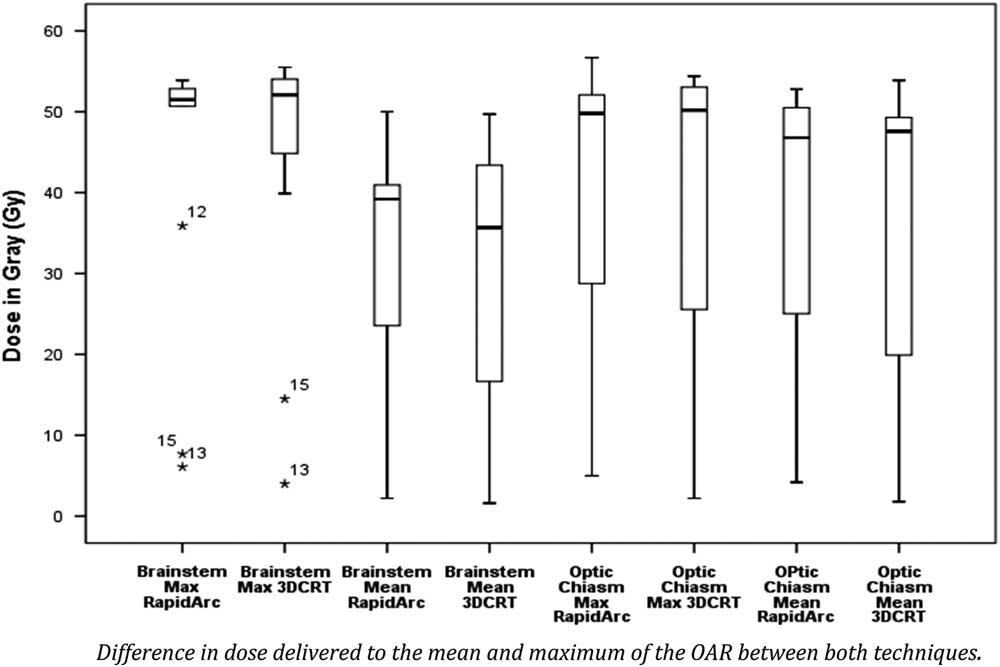
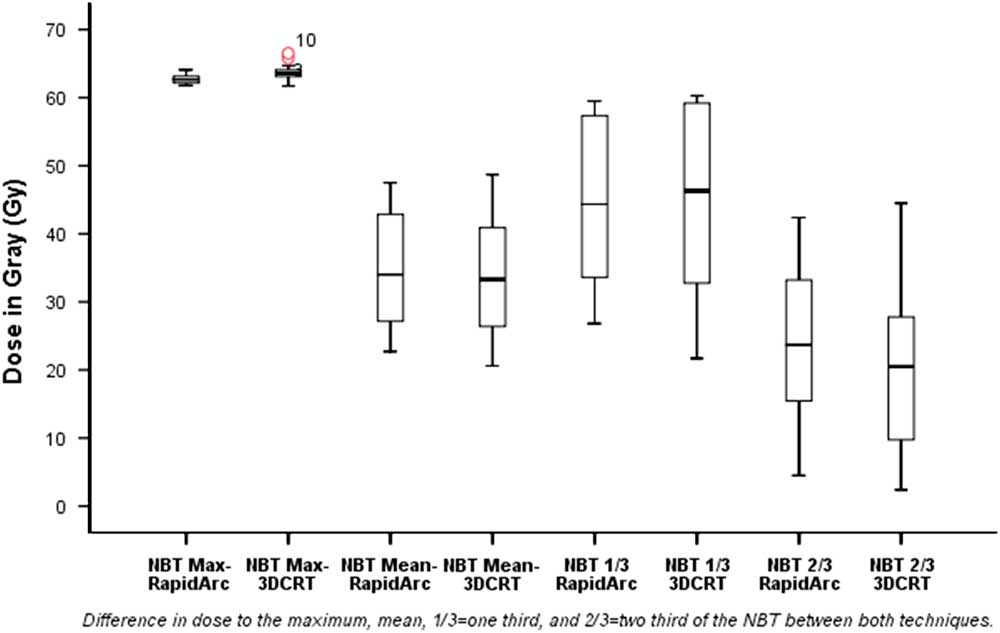
Figures 2, 3 and 4 illustrate the data in boxplot form. Extreme outliers are marked with an asterisk (*) on the boxplot and mild outliers are marked with a circle (O) on the boxplot.Reference Horber 20
Boxplot illustrating statistics for NBT data. Dose delivered to normal brain tissue (NBT) 3DCRT v. IMAT. NBT, normal brain tissue; 3DCRT, three-dimensional conformal radiotherapy; IMAT, intensity-modulated arc therapy.
Boxplot illustrating statistics for PTV data. Dose delivered to PTV 3DCRT v. IMAT. PTV=planning target volume; 3DCRT, three-dimensional conformal radiotherapy; IMAT, intensity-modulated arc therapy.
Boxplot illustrating statistics for OAR data. Dose delivered to OAR 3DCRT v. IMAT. OAR=organ at risk; 3DCRT, three-dimensional conformal radiotherapy; IMAT, intensity-modulated arc therapy.
Discussion
Study findings
3DCRT and IMAT technique treatment plans for patients with HGGs (grade 3) were analysed. The first question addressed was; which is the better technique in regards to delivering a lower integral dose to the NBT outside of the PTV? The second question addressed was; which technique was better in regards to optic chiasm and brainstem (OAR) sparing. The PTV coverage was also assessed to determine if low dose to the NBT and OAR sparing was achieved at the cost of PTV coverage.
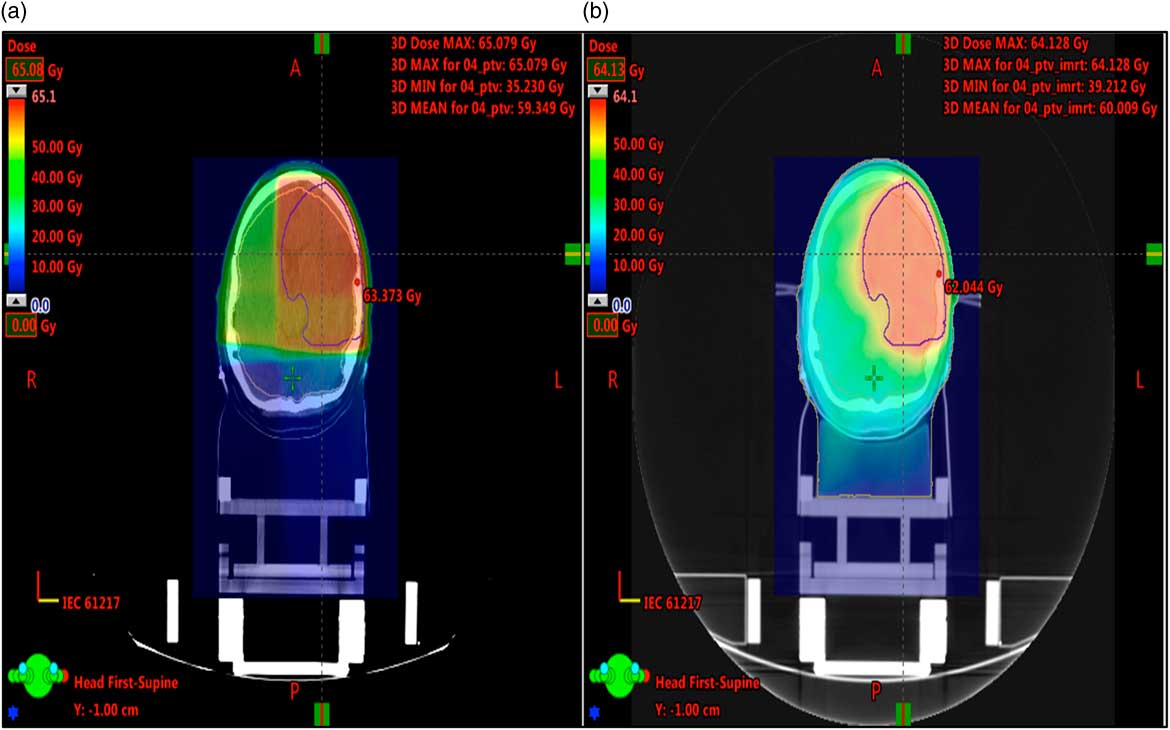
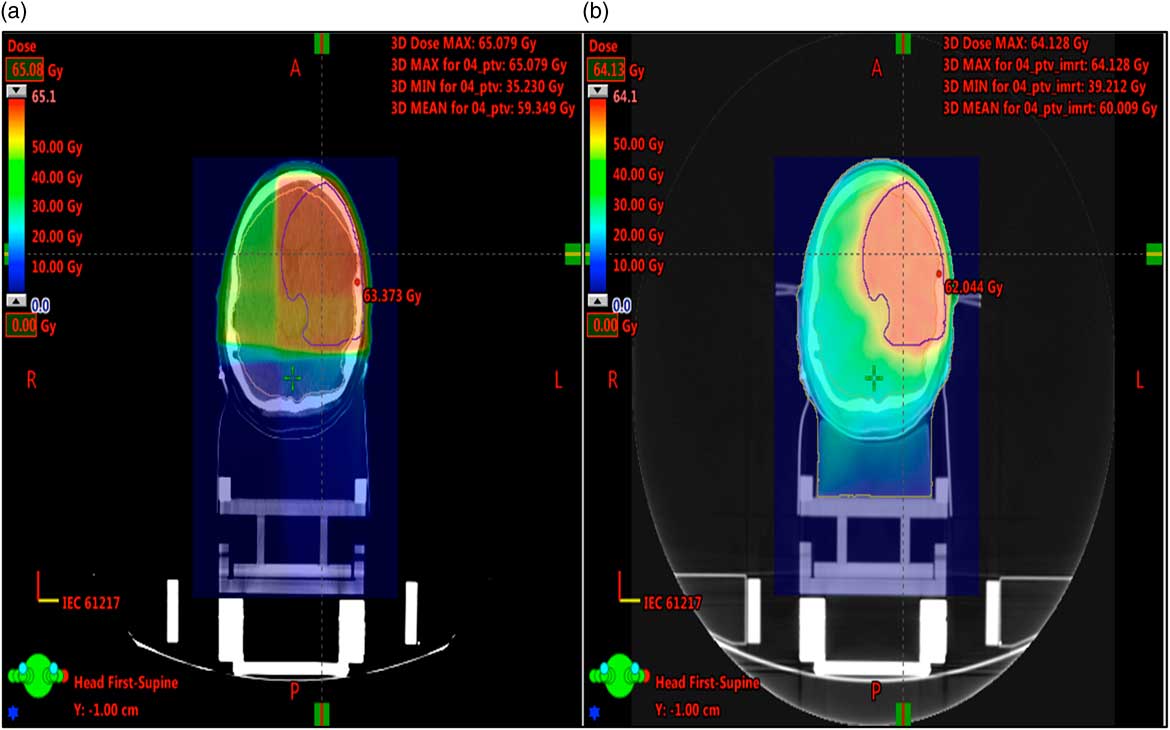
Through IMAT, a larger volume of NBT was typically irradiated with a small dose resulting in an overall higher dose; this is illustrated in Figure 5.
Illustrates the same axial slice of treatment plan 3 for both techniques, (a) 3DCRT and (b) IMAT. A larger volume of the NBT is receiving dose, using IMAT. NBT, normal brain tissue; 3DCRT, three-dimensional conformal radiotherapy; IMAT, intensity-modulated arc therapy.
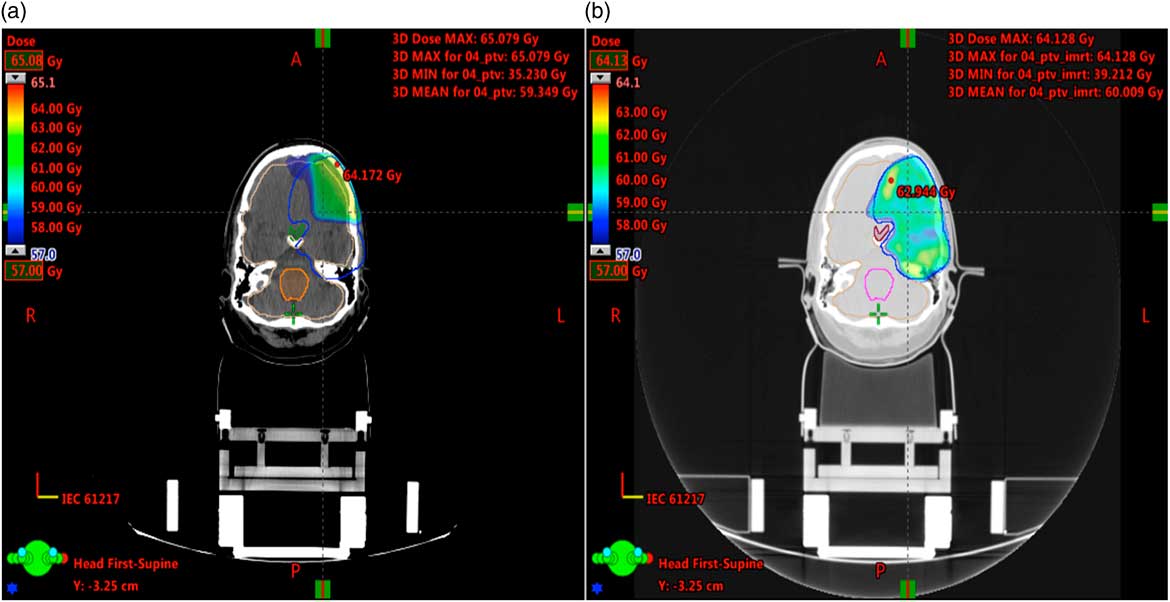
This study found that the PTV coverage using 3DCRT decreased significantly if located nearby the brainstem Figure 1 and optic chiasm Figure 7. This was because the dose limits were lower to the OAR (Table 4), in comparison with the prescribed dose aimed at the tumour (60 Gy). Wagner et al.Reference Wagner, Christiansen, Wolff and Vorwerk 11 noted that the PTV coverage decreased to 68·2% of the volume covered by the prescribed dose using 3DCRT. This is because the single fraction to OAR had to be reduced to 1·8 Gy; reducing the dose to the tumour concurrently. This implicates the lower biological dose delivered to the tumour. Wagner et al.Reference Wagner, Christiansen, Wolff and Vorwerk 11 concluded that these patients should therefore not be treated with 3DCRT technique due to the close proximity of PTV and OAR.
A significant difference was shown (Table 1 and Figure 2) between the two techniques for NBT mean (p=0·047) and NBT max (p=0·004). However, it is important to consider that the Wilcoxon signed rank test illustrates p-value based on the range difference. The NBT is not defined as an OAR because planners experience with Eclipse has shown for HGG that the brain dose is not reduced with the use of normal brain planning goals. The volume of PTV affects the dose the NBT receives, for example if the PTV is covering 1/3 of the NBT then it is difficult for the dose to be within tolerance. Thus, the likelihood of a small difference in increase or reduced dose to the NBT being clinically significant is modest when treating a high volume of the brain to a high total dose. Hence, it is important to not use the statistical values alone in order to reach a conclusion.
A reduction of NBT max with IMAT from 63·76 to 62·73 Gy is unlikely to lead to a noticeable reduction in symptomatic necrosis based on the Quantec data.Reference Marks, Yorke and Jackson 17 This reduction in IMAT dose for NBT max possibly balances the small increase by IMAT for NBT mean. The average difference in dose for the NBT 1/3 was +2·3 Gy more delivered by IMAT, but no significant difference (p=0·134) was illustrated, whereas this difference in actual dose is generous, based on the prescription dose.
Therefore, based on this analysis of a small sample, there is probably no clinically important difference for NBT outcomes.
The statistical data for PTV max, mean, D 50 and D 20 doses was comparable between both techniques (Table 2). The IMAT techniques offer good PTV coverage and conformity even when the PTV was close to OARs (Figure 1 and 7). Only parts of the PTV, overlapping with an OAR, achieved a lower dose of ~54 Gy to the PTV in PRV created.
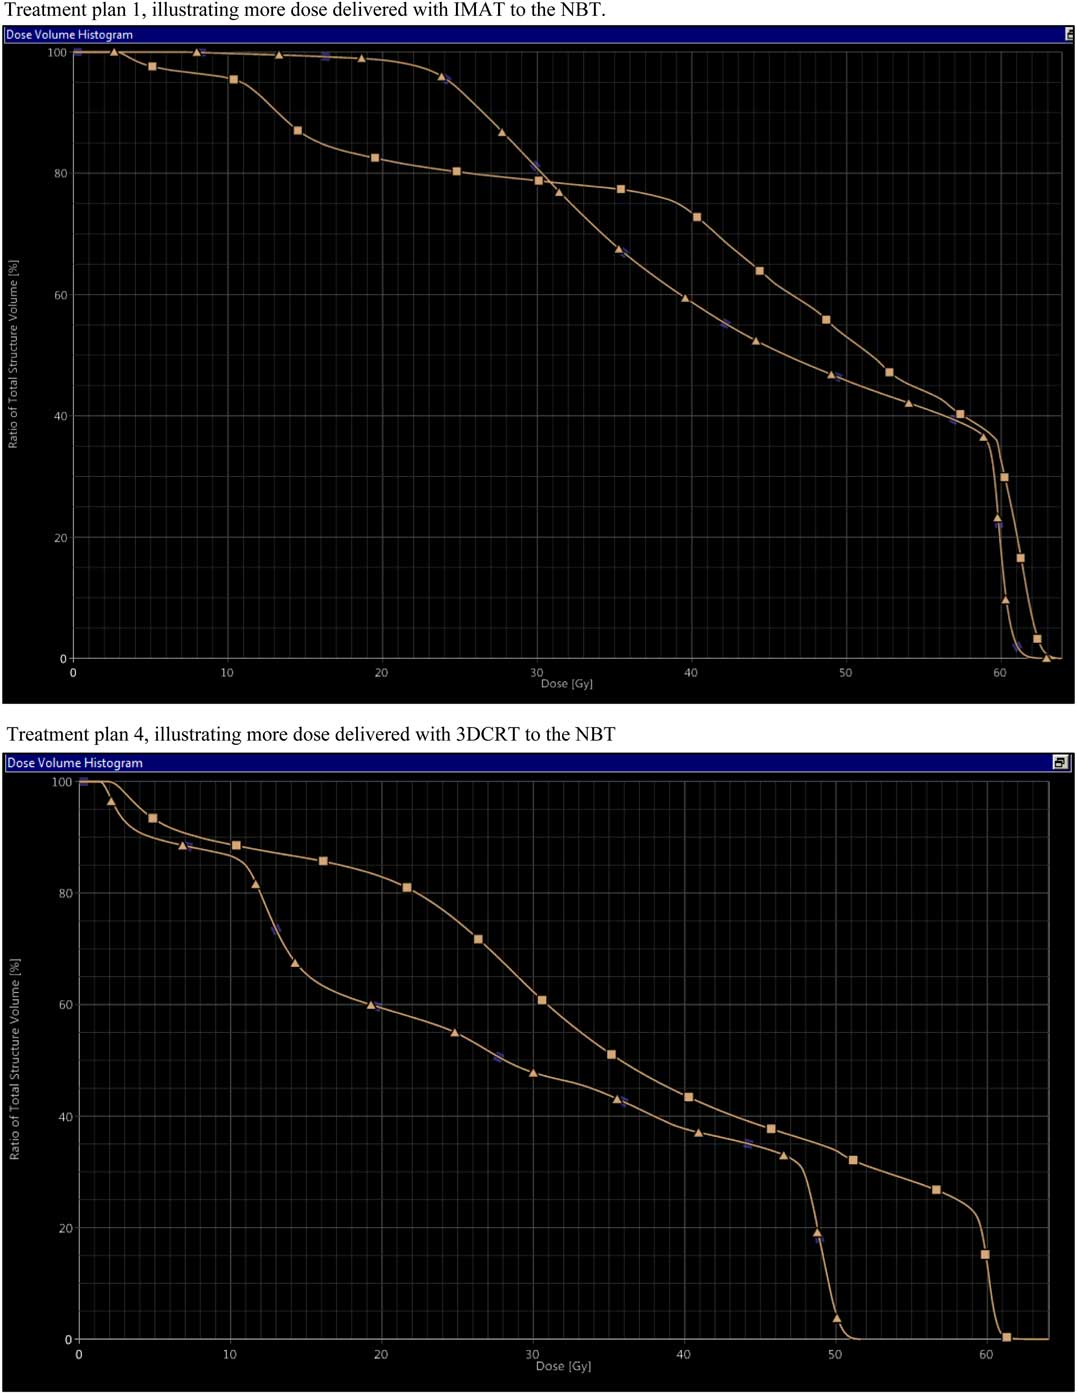
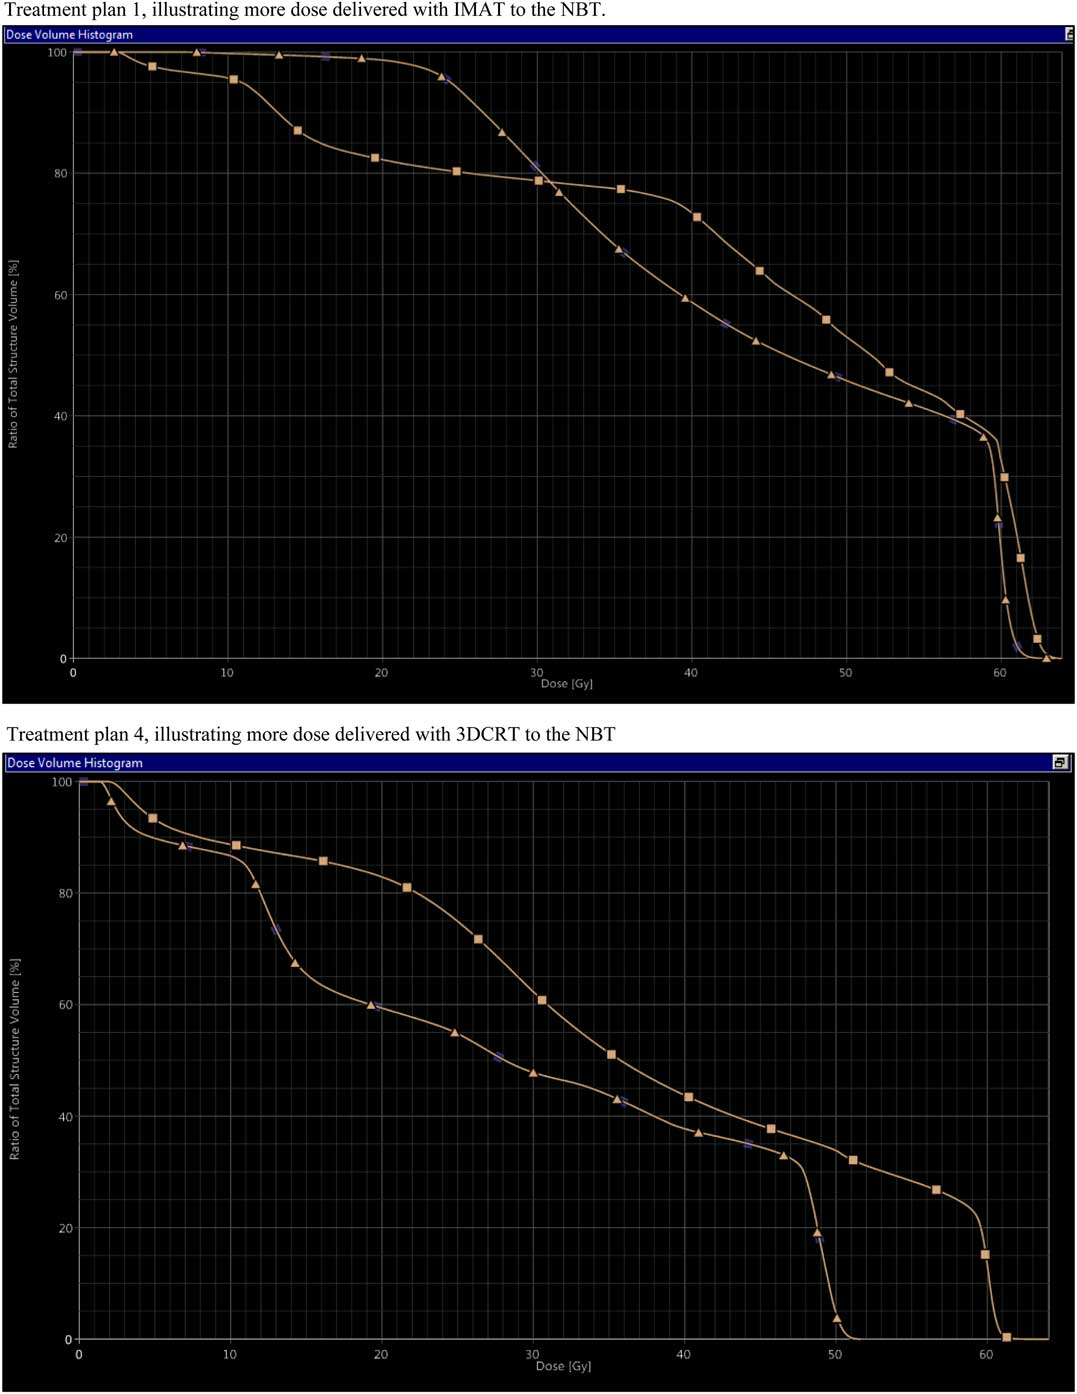
Depending on the PTV location, not all OARs can be taken into the optimisation process. This was also evident in the Sharyan et al.Reference Sharyan, Allehyani and Tolba 10 study, in which the maximum dose to the right optic nerve was higher than left optic nerve due to the tumour position being on the right. However, in our study the DVH of treatment plan 1 shows higher dose delivered with IMAT to the NBT, whereas treatment plan 4 illustrated an overall higher dose delivered with 3DCRT (Figure 6). Sharyan et al.Reference Sharyan, Allehyani and Tolba 10 demonstrated that there were no significant differences in the PTV conformity index between the two modalities (p=0·462).
Illustrates the DVHs of the NBT for two different treatment plans. Treatment plan 1; Δ=IMAT, Δ=3DCRT. Treatment plan 4; Δ=3DCRT, Δ=IMAT. Treatment plan 1, illustrating more dose delivered with IMAT to the NBT. DVH= dose–volume histogram; NBT, normal brain tissue; IMAT, intensity-modulated arc therapy; 3DCRT, three-dimensional conformal radiotherapy.
Sharyan et al.Reference Sharyan, Allehyani and Tolba 10 found the brainstem maximum dose was within the tolerance criteria <54 Gy for IMAT but exceeded the criteria in 3DCRT at 60·97 Gy. Our study found a small but statistically significant difference for the brainstem mean between the two techniques (p=0·044), demonstrating an increase in maximum dose +2·39 Gy to the brainstem with IMAT (Table 3 and Figure 4). The DVHs of treatment plan 5 demonstrated equal doses delivered to the brainstem using both techniques. Whereas for plan 4 and 11 the IMAT dose had a steeper drop off as desired in radiotherapy treatment. The brainstem and optic chiasm are serial organs, so it is vital to maintain their dose within tolerance.Reference Marks, Yorke and Jackson 17
The optic chiasm max and mean doses were comparable with both modalities. Similar to Sharyan et al.Reference Sharyan, Allehyani and Tolba 10 study in which the optic chiasms were within tolerance levels for both techniques. In our study IMAT was able to spare the brainstem and optic chiasm for more treatments plans. Thus, patients with a tumour nearby optic chiasm and brainstem may benefit treatment with IMAT. Figure 7 illustrates the difference in dose delivered by both techniques to the optic chiasm in DVHs.
Illustrates the poor PTV coverage and conformity of the planning target volume using the 3DCRT technique, compared with the IMAT technique, due to the presence of the optic chiasm. (a) 3DCRT, Green line=optic chiasm, orange line=brainstem. (b) IMAT, purple line=optic chiasm, pink line=brainstem. Blue line=PTV in both treatment plans.
Our study and evidence from previous studiesReference Wagner, Christiansen, Wolff and Vorwerk 11 – Reference Shaffer, Nichol and Vollans 13 , Reference Fogliata, Clivio and Nicolini 21 demonstrated that IMAT can lead to reductions in maximum doses delivered to critical structures but at the expense of increased mean dose to the NBT. There is currently insufficient evidence to demonstrate if the increase in dose to NBT compared with the reduced dose to OARs is statistically or clinically significant. It is important to acknowledge that the Quantec data by Marks et al.Reference Marks, Yorke and Jackson 17 was produced based on data using 3DCRT techniques, so can not be equally applicable to the relatively new IMAT techniques. Nevertheless, it is evident that IMAT does lead to better PTV coverage.
Limitations
It is important to consider that the 3DCRT treatment plans used in this study were phased treatments. The 1st phase delivered 2 Gy per fraction to the PTV even if there was OARs involved, and the 2nd phase of the treatment resulted in large uncovered areas in the PTV affecting the PTV’s overall coverage and conformity.
In this study, planning goals for each treatment plan were met so it was deemed ‘clinically acceptable’. The planner in this study did not continue optimising to achieve the best plan possible due to time constraints. Further, optimisation may have led to larger differences than those seen in Tables 1–3.
This study did not set out to evaluate time differences but, as identified by Sharyan et al.Reference Sharyan, Allehyani and Tolba 10 , it was noted that IMAT techniques required longer to plan. However, advantages of IMAT (relating to PTV coverage and OAR sparing) may outweigh the limitations associated with additional planning time.
Furthermore, lower number of monitor units with IMAT, implies less scattered radiationReference Goswami, Mitra and Banerjee 12 and significant reduction of delivery time demonstrated in many studies.Reference Sharyan, Allehyani and Tolba 10 – Reference Shaffer, Nichol and Vollans 13 Consequently, organ motion during treatment delivery is less problematic and patient comfort is enhanced through as time spent immobilised in a beam direction shell is reduced. Patient throughput may also be increased as a result of reduced treatment times.
HGG are classified as grade 3 and 4. Our study included only grade 3 whereas other studies included patients with both grade and so definitive comparisons are not possible.
Conclusion
Our evaluation found that IMAT was at least comparable with 3DCRT in relation to minimising dose to NBT and ensuring good PTV conformity. Improved PTV conformity with IMAT was particularly noted in cases where the PTV was in close proximity to OARs. Similarly doses delivered to OARs using IMAT were also comparable with 3DCRT.
Financial Support
This research received no specific grant from any funding agency, commercial or not-for-profit sectors.
Conflicts of Interest
None.
Acknowledgements
The authors would like to acknowledge Dr Chris Bragg and all the Clinical Technicians at Weston Park Hospital. With thanks to the Sheffield Teaching Hospitals NHS Trust for granting permission for this project to be carried out. This study supports the continued use of IMAT for the treatment of high-grade gliomas.