Introduction
Major depressive disorder (MDD) is a complex and burdensome mental health disorder made up of a wide variety of symptoms (APA, 2000; WHO, 2001; Kessler et al. Reference Kessler, Berglund, Demler, Jin, Koretz, Merikangas, Rush, Walters and Wang2003; Hardeveld et al. Reference Hardeveld, Spijker, De Graaf, Nolen and Beekman2010). Structured interviews and questionnaires, such as the Hamilton Depression Rating Scale (HAMD; Hamilton, Reference Hamilton1960) and Beck Depression Inventory (BDI; Beck et al. Reference Beck, Ward, Mendelson, Mock and Erbaugh1961; BDI-II; Beck et al. Reference Beck, Steer and Brown1996b) are important and commonly used tools to screen for, study, and follow the course of MDD (Beck et al. Reference Beck, Steer, Ball and Ranieri1996a). In longitudinal studies, a total score, which results from simply adding all symptom scores, is often used as a measure of changes in depression severity. Relatively few studies use a more fine-grained analysis, in which the reduction of depression severity is studied by examining specific (clusters of) symptoms of depression instead of using the total score (e.g. Bhar et al. Reference Bhar, Gelfand, Schmid, Gallop, DeRubeis, Hollon, Amsterdam, Shelton and Beck2008; Stewart & Harkness, Reference Stewart and Harkness2012; Fournier et al. Reference Fournier, DeRubeis, Hollon, Gallop, Shelton and Amsterdam2013).
What all the above studies have in common is that they are based on the latent variable model. According to this model, symptoms of a given disorder are assumed to share an essential property; namely, their causal dependence on a latent variable, from which all symptoms arise (Borsboom, Reference Borsboom2008; Kendler et al. Reference Kendler, Zachar and Craver2011). In this perspective, symptoms experienced by patients are merely effects of the relevant latent variable (in this case depression). Standard models assume the symptoms to be statistically independent given the latent variable, and as a result, symptom associations are viewed to be spurious (Borsboom, Reference Borsboom2008). Specifically, in the standard model, symptoms are not considered to have autonomous influence on one another. The latent variable approach, as utilized in standard models, is therefore not suitable to examine the dynamic relations between symptoms. The recently developed network approach (Cramer et al. Reference Cramer, Waldorp, van der Maas and Borsboom2010) steps away from this latent variable model by proposing that research should no longer focus exclusively on the mean level of symptoms or change therein (e.g. an overall score or a reduction of symptoms). Instead, this approach emphasizes that clinical research should also focus on the relation between individual symptoms from one time point to another, which we denote here as short-term dynamics.Footnote †Footnote 1
The importance of examining these short-term dynamics is supported by various sources. First, theories of treatments for depression tend to focus on the short-term symptom dynamics when describing their proposed mechanisms of change. For example, according to Beck's et al. (Reference Beck, Rush, Shaw and Emery1979) cognitive theory, change in cognitive processes (e.g. negative thinking) leads to changes in symptoms such as affect (Beck, Reference Beck1964; Rush et al. Reference Rush, Kovacs, Beck, Weissenburger and Hollon1981). Second, in clinical practice it is commonly observed that if patients experience relief in one symptom (e.g. sleeping problems), other symptoms start to wane as well, indicating the start of recovery; this is especially notable when symptoms are systematically assessed at the start of each therapy session, as is the case in cognitive therapy (Beck et al. Reference Beck, Rush, Shaw and Emery1979). Third, recent studies indicate that depression risk factors and stressful life events have differential effects on depressive symptoms (Cramer et al. Reference Cramer, Borsboom, Aggen and Kendler2012; Fried et al. Reference Fried, Nesse, Zivin, Guille and Sen2013). As Cramer et al. (Reference Cramer, Borsboom, Aggen and Kendler2012) showed, correlations between symptoms were directly influenced by the stressful life events and could not be explained by changes in an underlying common cause, in this case the risk to develop depression. This further supports the idea that symptoms have an autonomous influence on one another. Being able to objectively describe such symptom-by-symptom interactions can give important clues for clinical research and practice.
Apart from their substantive plausibility, network approaches open up a new range of research questions. For example, estimating a network of symptoms from depression questionnaires allows for an objective assessment of the centrality of symptoms (Boccaletti et al. Reference Boccaletti, Latora, Moreno, Chavez and Hwang2006; Opsahl et al. Reference Opsahl, Agneessens and Skvoretz2010). Symptoms with a central position in the network are probably the most important or influential ones and are therefore likely to cause the symptom spread to continue. Studying these central symptoms can give clues for further clinical research. One could investigate, for instance, the commonly held assumption that anhedonia (loss of pleasure and interest) and depressed mood are central symptoms of depression as stated by the most prevalent diagnostic systems DSM-IV-TR (APA, 2000) and ICD-10 (WHO, 2008). In addition, once the network has been estimated, the community structure of the network can be examined (Girvan & Newman, Reference Girvan and Newman2002). A community is present if some clusters of symptoms are more strongly interconnected with each other than with symptoms that are not part of the cluster. In this way, the dynamic architecture of depression can be investigated.
This paper will be the first to investigate the short-term dynamics of one of the most widely used psychological questionnaires for depression: the BDI-II. Inspired by the possibilities of the network approach, we will apply a novel method developed by Bringmann et al. (Reference Bringmann, Vissers, Wichers, Geschwind, Kuppens, Peeters, Borsboom and Tuerlinckx2013) that is able to explore these symptom dynamics, and infer a network structure of BDI-II symptoms. Until recently, it was not possible to infer these kinds of directed and weighted networks from clinical questionnaires since two important requirements for studying short-term dynamics, intensive longitudinal data in which a set of symptoms is measured frequently across time, and a suitable statistical method, were lacking. Intensive longitudinal data is still sparse, but in a recent study by Lemmens et al. (Reference Lemmens, Arntz, Peeters, Hollon, Roefs and Huibers2011; Lemmens et al. unpublished observations) such data for the BDI-II were collected. Second, the newly developed vector autoregressive (VAR) multilevel method, which is a combination of multilevel (hierarchical) and time-series models, is suited for analysing these kinds of clinical longitudinal data. These data have rather short time series (~20 time points) for a large sample of patients (Bringmann et al. Reference Bringmann, Vissers, Wichers, Geschwind, Kuppens, Peeters, Borsboom and Tuerlinckx2013). Note that since only few studies have investigated single specific (clusters of) symptoms of the BDI-II or even interactions between symptoms in general, all analyses are exploratory.
The structure of the paper is as follows: first, we will infer the network(s) representing the short-term dynamics of BDI-II symptoms. Second, we will study the centrality of symptoms. Based on the DSM-IV and ICD-10, one would expect the BDI-II items that are intuitively most closely related to the main symptoms, anhedonia and depressed mood (namely items: ‘loss of interest’, ‘loss of pleasure’ and ‘sadness’), to be the most central ones in the network(s). In the third and last part, we will analyse whether communities are present in BDI-II network(s). Since the network(s) consists of a fair number of symptoms (i.e. 21), we expect the emergence of new clusters of symptoms or community structures.
Method
Data
The data in the current study come from a large randomized clinical trial (RCT), which examined the effectiveness, relapse prevention and mechanisms of change of cognitive therapy (CT) v. interpersonal psychotherapy (IPT) for depression (Lemmens et al. Reference Lemmens, Arntz, Peeters, Hollon, Roefs and Huibers2011; Lemmens et al. unpublished observations). In this study, 182 patients (aged between 18 and 65 years) with a DSM-IV diagnosis of MDD were randomly allocated to one of three conditions: (a) CT (n = 76), (b) IPT (n = 75), or (c) an 8-week waiting-list control (WLC) condition followed by treatment of choice (CT or IPT, n = 31). In the current study, we did not differentiate between patients who started therapy immediately and who started after 8 weeks. This resulted in a sample size of 99 for the CT condition (mean age = 40 years, s.d. = 12 years, 80% female) and a sample size of 83 for the IPT condition (mean age = 41 years, s.d. = 12 years; 64% female). There were no significant differences in demographic and clinical characteristics between the groups. Each patient participated in 3–20 weekly individual sessions, depending on the progress of the patient or due to drop out. On average, patients completed 14 sessions (s.d. = 5).Footnote 2 The BDI-II was administered before each session to assess depression severity. Of the 2661 sessions, 2.5% of the BDI-II data were missing. Further details concerning the design of the trial and effectiveness of the interventions have been fully reported elsewhere (Lemmens et al. Reference Lemmens, Arntz, Peeters, Hollon, Roefs and Huibers2011; Lemmens et al. unpublished observations).
BDI-II
The BDI-II (Beck et al. Reference Beck, Steer and Brown1996b; Dutch translation by van der Does, Reference Van der Does2002) is one of the most widely used and empirically validated questionnaires for screening depression. The BDI-II is a self-report questionnaire measuring the severity of depression with 21 items. Each item is rated on a 4-point Likert-scale ranging from 0 to 3. The total score, ranging from 0 to 63, is constructed by adding the item scores, with higher scores reflecting more severe depressive symptomatology.
Interventions
CT and IPT are two of the most empirically validated psychotherapies used for treating depression (Hollon et al. Reference Hollon, Thase and Markowitz2002; Cuijpers et al. Reference Cuijpers, van Straten, Andersson and van Oppen2008, Reference Cuijpers, Geraedts, van Oppen, Andersson, Markowitz and van Straten2011). CT is based on Beck's et al. (Reference Beck, Rush, Shaw and Emery1979) cognitive theory, which states that depression results from maladaptive information-processing strategies that are maintained by dysfunctional behavioural responses. CT focuses on identifying and changing dysfunctional cognitions, schemas and attitudes in order to treat depression. In IPT, the interpersonal model of depression is central (Klerman et al. Reference Klerman, Weissman, Rounsaville and Chevron1984). According to this model, major disturbances in the interpersonal domain may cause and maintain depression. It is assumed that depressive symptoms can be reduced through the improvement of interpersonal functioning.
Statistical analysis
The BDI-II network
First, we inferred the BDI-II network by analysing the short-term dynamics between the 21 symptoms across the 20 weeks of therapy with a modified version of the multilevel VAR method (Bringmann et al. Reference Bringmann, Vissers, Wichers, Geschwind, Kuppens, Peeters, Borsboom and Tuerlinckx2013).Footnote 3 In the multilevel VAR method, the time dynamics between the 21 symptoms of the BDI-II from one moment to the other are represented by a VAR model (see also Tschacher et al. Reference Tschacher, Zorn and Ramseyer2012 for a similar approach). In the VAR model, the dependent variable (e.g. symptom ‘sadness’, item 1) at time point t (e.g. session 2) is regressed on the lagged t − 1 (e.g. session 1) versions of the independent variables (Box et al. Reference Box, Jenkins and Reinsel1994; Walls & Schafer, Reference Walls and Schafer2006).Footnote 4 The independent variables in this study are all the symptoms of the BDI-II, measured at the previous time point (in this case the previous session). To account for differences between patients, all regression coefficients were assumed to be normally distributed at the population level. As a consequence, we obtained a multilevel model consisting of fixed (average) and random (individual) effects.Footnote 5 Each BDI-II symptom was used as a criterion variable once, which means that 21 multilevel VAR models were estimated.
In order to estimate a multilevel VAR model, data need to be stationary. An implication of this assumption is that that the variables will fluctuate around the same mean over time (Lütkepohl, Reference Lütkepohl2005). Since BDI-II symptoms decreased over the course of treatment (Lemmens et al. unpublished observations), the means changed significantly, which indicates a non-stationary process. For this reason, a linear trend in the multilevel VAR model was included, making the data trend stationary (Hamaker & Dolan, Reference Hamaker and Dolan2009). This implies that the short-term dynamics or the session-to-session fluctuations of the symptoms (as represented by the network) and the decrease of symptoms across the sessions (as represented by the linear trend) are modelled separately. Therefore, change in the short-term dynamics is in principle unrelated to change in the mean level of the BDI-II symptoms. Note further that stationarity also implies the assumption that the effects of symptoms on other symptoms are stable across time.
In order to obtain the BDI-II network, the estimated fixed effects of the multilevel VAR analyses were used (Snijders & Bosker, Reference Snijders and Bosker2012). Fixed effects represent the average connection strengths of the arrows in the network among the 21 symptoms and indicate whether the symptoms are positively or negatively related to each other. The fixed effects represent either autoregressive effects (self-loops) or cross-regressive effects (connections between different variables) in the network. Note that the network only represents the dynamic relations between the symptoms (the slopes of the multilevel VAR model) and not the mean scores (the intercepts of the multilevel VAR model) of the symptoms.
The estimated fixed effects or connections of the network resulted in a directed weighted network structure of the BDI-II, which was visualized using qgraph (Epskamp et al. Reference Epskamp, Cramer, Waldorp, Schmittmann and Borsboom2012), a package for the statistical programming language R. Arrows or connections in the network represent more than mere associations between symptoms: because symptoms are measured over time, the connections can be viewed as an approximation of causality, resembling Granger causality (Granger, Reference Granger1969; Tschacher et al. Reference Tschacher, Zorn and Ramseyer2012). The network analyses were based on all the connections of the network. However, for reasons of clarity, we only visually present the strongest connections in the inferred network; that is, those connections which surpass the significance threshold (5%) using the false discovery rate (FDR) method (Benjamini & Hochberg, Reference Benjamini and Hochberg1995; Benjamini et al. Reference Benjamini, Krieger and Yekutieli2006). In the visually presented network, symptoms that are more strongly related to each other tend to be closer together in the figure (this is a result of the node placement algorithm; see Fruchterman & Reingold, Reference Fruchterman and Reingold1991; Epskamp et al. Reference Epskamp, Cramer, Waldorp, Schmittmann and Borsboom2012).
Since the current study included two different therapy groups (CT and IPT), it is possible that two different network structures give rise to the data. We tested this in two ways: first, we fitted a model with the two networks separately and cross-correlated their estimated network links. Second, we compared a model in which we included two networks with a model which had one common network; for this purpose, we used Bayesian Information Criterion (BIC; Schwarz, Reference Schwarz1978). The model with the lowest BIC is the preferred model.Footnote 6
Centrality analysis
In the second analysis, the inferred network was further analysed by estimating the centrality of the BDI-II symptoms. In a centrality analysis, one can determine the relative importance or influence of a symptom in the network. We performed three types of centrality analyses: outdegree, indegree and betweenness centrality (see Opsahl et al. Reference Opsahl, Agneessens and Skvoretz2010).Footnote 7 Outdegree centrality indicates how many outgoing arrows or how much information a symptom sends to other symptoms it is directly connected to. In the same way, indegree centrality indicates how many incoming arrows a symptom receives from the directly connected symptoms. Betweenness centrality takes into account both the direct and indirect connections of a symptom. A symptom with a high betweenness centrality is a symptom located on many paths between other symptoms and thus is a symptom through which the information in the network has to pass often. Therefore, a symptom with a high betweenness centrality is important in funneling the information flow or the symptom spread in the network.
Community structure analysis
As a third analysis, we performed a community structure analysis. In complex networks, new structures of clusters can often be found. An example of such a cluster is a community, in which groups of symptoms are densely interconnected among each other, but sparsely connected to the overall network. We used the Walktrap algorithm, which is suited for weighted networks (Pons & Latapy, Reference Pons and Latapy2005). This algorithm does not take directions of the arrows into account, so we summed the connection strengths (arrows) between two symptoms to have an appropriate undirected network suitable for analysis. The Walktrap algorithm uses random walks on the network to find communities or densely interconnected symptoms. The algorithm reveals how many groups can be found and also to which group a symptom of the network belongs to. All the analyses were performed with statistical software R (R Core Team, 2014).
Results
The BDI-II network
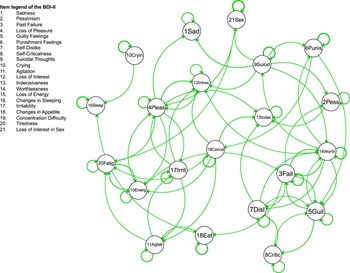
Fig. 1 shows the inferred network of the dynamics between the 21 BDI-II symptoms. The analysis of cross-correlations and the model-fitting approach using BIC indicated that the network structure did not differ across the two therapy groups (r = 0.86, p < 0.0001; one network: BIC = 77367.65 v. two networks: BIC = 80574.09). Therefore, only one network was needed, representing both treatment groups. From the figure, it is evident that the strongest connections between symptoms are all positive in sign. Thus, when a symptom score increases, it is likely that other symptom scores also increase the next session, leading to an increase in the severity of symptoms in general. For example, if a participant reports feelings of guilt (‘guilty feelings’, item 5) in one session, that participant is more likely to report feelings of failure about the past (‘past failure’, item 3) the next session. The strength of the relationship between symptoms translates into the thickness of the arrows in the figure: the stronger the symptoms are related the thicker the arrow between two symptoms, and the closer the symptoms tend to be together in the figure. This is expressed in, for example, the placement of the symptoms ‘past failure’ (item 3) and ‘worthlessness’ (item 14).
The BDI-II network. In this network, the connections between the 21 symptoms that surpass the significance threshold are visualized. Because of multiple hypothesis testing, we do not use the traditional 0.05 cut-off for p values as the standard (which would inflate the number of unimportant links to be visualized); instead, we control the false discovery rate (FDR) at 5% (Benjamini & Hochberg, Reference Benjamini and Hochberg1995; Benjamini et al. Reference Benjamini, Krieger and Yekutieli2006). Here, the 75 connections that pass the FDR threshold are visualized.

Apart from the connections between the symptoms, self-loops can contain important information. For example, the self-loop of the symptom ‘loss of interest in sex’ (item 21) is clearly the strongest connection of the network, meaning that when a participant reports loss of interest in sex one session, he or she is highly likely to report this in the next session as well. Furthermore, self-sustaining loops are apparent in the network. For example, ‘worthlessness’ (item 14) and ‘guilty feelings’ (item 5) seem to mutually influence each other. It should be mentioned that there are negative connections in the complete network as well. However, since these are rather weak, they did not pass the threshold for visualization in Fig. 1. Note, however, that all connections are taken into account in the further analyses.Footnote 8, Footnote 9
Centrality analysis
Fig. 2 presents the results of the centrality analysis. Fig. 2a indicates that the symptom ‘loss of pleasure’ (item 4) has one of the highest outdegrees, meaning that when one reports loss of pleasure in one session, it is likely that one will also report an increase in other symptoms in the next session. This is in contrast to, for instance, the symptom ‘changes in sleeping patterns’ (item 16), which is less likely to directly affect other symptoms the next session.
(a) Outdegree, (b) indegree and (c) betweenness centrality for all BDI-II symptoms. The black dots are the model-based estimates of outdegree, indegree, and betweenness centrality. The higher the centrality index score the more central the symptom is in the network.

Fig. 2b indicates that the symptoms ‘indecisiveness’ (item 13), ‘loss of interest’ (item 12), ‘past failure’ (item 3) and ‘sadness’ (item 1) feature higher indegrees and thus receive a lot of information from other symptoms. This is in contrast to ‘suicidal thoughts’ (item 9): this symptom is unlikely to be influenced by other symptoms, and is more likely to influence other symptoms (see also Fig. 2a).
Fig. 2c indicates that the symptoms ‘loss of pleasure’ (item 4) and ‘past failure’ (item 3) feature the highest betweenness centralities, but they also have one of the highest outdegree (‘loss of pleasure’) and indegree (‘past failure’) centrality scores, respectively. Thus, the symptoms ‘loss of pleasure’ and ‘past failure’ are important in funneling the activation flow or symptom spread in the network.
Community structure of the BDI-II network
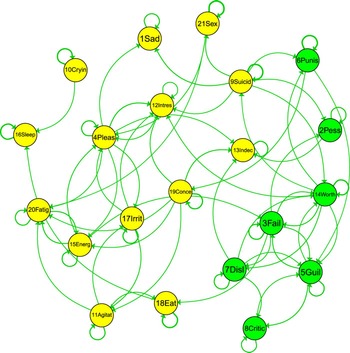
The community structure analysis using the Walktrap algorithm indicated a two-cluster solution (see Fig. 3).Footnote 10 This community structure means that symptoms in one cluster are more densely interconnected among themselves and more sparsely connected to symptoms in another cluster. The green cluster in Fig. 3 consists of the symptoms ‘guilty feelings’ (item 5), ‘past failure’ (item 3), ‘self-dislike’ (item 7), ‘self-criticalness’ (item 8), ‘worthlessness’ (item 14), ‘punishment feelings’ (item 6) and ‘pessimism’ (item 2), which are often described as cognitive symptoms. Items in the yellow cluster mainly consist of physical and affective symptoms of depression that appear related to loss of energy and pleasure.
Community structure of the BDI-II network with the two clusters indicated by two different colours.

Discussion
In this paper, we derived for the first time a network that represents the session-to-session dynamics of one of the most widely used and empirically validated self-report measures for assessing the severity of depression: the BDI-II (Beck et al. Reference Beck, Steer and Brown1996b). Results indicate that, in this network, all BDI-II symptoms are directly or indirectly connected. In addition, the strongest connections between the symptoms are uniformly positive, indicating that, in general, when a symptom changes in severity, other symptoms tend to change in the same direction. This pattern of symptom dynamics is independent of the overall decrease in symptom scores as this trend was modelled separately; hence, the pattern does not reflect the common influence of treatment or recovery. In addition, for each symptom–symptom relation, we controlled for the effect of all other symptoms in the network. Thus, the evidence from this study points to the conclusion that direct effects among symptoms of the BDI-II are prevalent, and in fact connect all symptoms assessed in the questionnaire. In other words, symptoms of depression form a network of direct interactions.
Centrality analyses of the symptoms suggested that some symptoms are likely to have a larger influence on the symptom spread than other symptoms. As one may expect based on, e.g. the DSM-IV, the symptom ‘loss of pleasure’ (item 4) is one of the most central items in the symptom network and thus has a relatively large effect on the enduring of depressive symptoms in general. Somewhat more surprisingly, the symptoms ‘sadness’ (item 1) and ‘loss of interest’ (item 12) have a high indegree centrality, but quite a low outdegree and betweenness centrality, which means that they tend to increase in severity as other symptoms become more severe, but do not play a large role in funneling the symptom spread themselves. Thus, these symptoms may serve a mainly reactive role in the short-term dynamics of depression. Additional studies are needed to confirm these results, preferably engaging different depression questionnaires, such as the HAMD.
Based on theory, one may expect a difference in symptom dynamics for subjects receiving CT and IPT because both treatments are assumed to work through different mechanisms. We did not observe such differences. A potential explanation for our findings could be that the dynamics between symptoms are similar when the treatments that are being compared are equally effective in reducing pathology, a fact that has been well established for CT and IPT for depression (Cuijpers et al. Reference Cuijpers, van Straten, Andersson and van Oppen2008; Hollon & Ponniah, Reference Hollon and Ponniah2010). Alternatively, it might be the case that differences between CT and IPT actually do exist, but that we did not capture them in the current study because the BDI-II is, due to its design, insensitive for the differences between the two treatments. For example, even though the BDI-II includes items on several cognitive components (key elements of CT), items referring to problems in the interpersonal domain (core of IPT) are lacking. Further research involving other questionnaires is necessary to indicate if there are differences in symptom dynamics between therapies. A final possibility is that the difference between CT and IPT does not lie in symptom–symptom interaction, as studied in this paper, but in differences that arise in, e.g. stepwise changes in symptomatology. In this case, therapy effects might be detected in the way symptoms decrease or increase from one time point to another. Models that may be used to analyse such differences, while accounting for the network of symptom-symptom interaction, are currently unavailable; however, nonlinear statistical network inference techniques that may be used to model such processes are within reach, and could be used to investigate this issue in the future.
In the present study, community analyses revealed two groups of symptoms. The result appears to accommodate emerging evidence from the biomedical literature, which points to two types of depression: melancholia and atypical depression (Lamers et al. Reference Lamers, de Jonge, Nolen, Smit, Zitman, Beekman and Penninx2010, Reference Lamers, Rhebergen, Merikangas, de Jonge, Beekman and Penninx2012). The current community clusters resemble these different depression types, as the green cluster in Fig. 3 has similarities to melancholic type, whereas the yellow cluster resembles atypical depression. It is also interesting to note that the community structure result, based on multiple time points, is similar to the two-factor solution of the BDI-II, based on pooling across subjects at one time point (as found in e.g. Beck et al. Reference Beck, Steer and Brown1996b; see also Steer et al. Reference Steer, Ball, Ranieri and Beck1999; Arnau et al. Reference Arnau, Meagher, Norris and Bramson2001). Except for ‘suicidal thoughts’, all other symptoms in the green cluster of Fig. 3 are the same as in the cognitive dimension of the two-factor solution of the BDI-II, whereas the yellow cluster could be interpreted as the somatic-affective or non-cognitive dimension. Although it is a good sign that the results we find are consistent with what one typically finds using factor analysis, our approach leads to a different way of thinking, different strategies for intervention, and to very different conclusions. In the latent variable approach, there are just two clusters of symptoms, which is a static result. In the network view, the result concerns the communication between symptoms that is denser within the cluster than with symptoms that are not in the cluster, leading to new hypotheses on how interventions should be operationalized, namely focusing on the interaction between symptoms. Thus, the existence of such patterns of influence is not a replication of the results of factor analysis on individual differences; rather, it may be seen as a potential explanation for these results (Wichers, Reference Wichers2014).
Several findings of this paper suggest further research. One important issue is how our results, which only involved participants with a diagnosis of depression, compare to results from unaffected individuals. For example, it is important to investigate whether a similar network characterizes healthy individuals. One hypothesis would be that there are no distinct symptom clusters in healthy subjects, but that instead all symptoms are similarly (and weakly) connected. Such a network would be more resilient, since activation would not spread as easily, and it would be less likely to ‘get stuck’ in a cluster of symptoms. Another important topic for future research involves the difficult question of how to relate different time scales (Boker et al. Reference Boker, Molenaar and Nesselroade2009). This is because the symptoms that characterize depression are likely to influence each other in different time windows. For example, sleep problems are likely to exert effects in a pattern of a day-to-day variation, whereas mood states are much quicker and may affect each other within minutes. The question of how the dynamics of these different time scales interact with each other is, in our view, one of the main puzzles to be solved in the study of symptom dynamics.
Regarding clinical practice, the relevance of the methodology and results of our approach may lie in opportunities to determine symptom centrality. For example, network analyses may be used to indicate which symptoms should be targeted first, and in this sense may help in setting up treatment strategies. Ideally, such analyses should be based on person-specific analyses (cf. Molenaar & Campbell, Reference Molenaar and Campbell2009). Unfortunately, at the moment such analyses are not computationally feasible for large networks of 21 symptoms. However, future development of the multilevel VAR method, combined with a higher frequency of within subject assessment, should make it possible to take this procedure a step further, which may eventually lead to person-specific therapeutic interventions. Information about person-specific network centrality would not necessarily require pre-treatment assessment, and the high frequency assessment could be informative at any point, even if started during therapy. For example, if a centrality analysis of an individual network reveals that for that specific person ‘loss of pleasure’ is the most central symptom, therapy that intervenes on this symptom would be more effective than treatment that intervenes on non-central symptoms; for other persons, different interventions may be preferable. In a similar vein, one could hypothesize that if ‘suicidal thoughts’ is the most central symptom for a given person, this may signal acute need for care. Furthermore, since ‘suicidal thoughts’ has a high outdegree, and is thus likely to trigger other symptoms, but a low indegree, and is thus not likely to be influenced by the other symptoms, interventions should be directly targeted at this symptom. Given the increased opportunities for assessing highly intensive time series within individuals, person-specific treatment protocols based on networks of symptom dynamics are rapidly becoming a realistic possibility. Thus, the network perspective is a promising new research field, which can give guidance to research on depression and to psychological research in general.
Acknowledgements
We are grateful to Markus Eronen, Verena Schmittmann and Madeline Pe for valuable input and comments on the manuscript. Furthermore, we would also like to thank the three anonymous reviewers for their helpful comments. The research leading to the results reported in this paper was sponsored in part by Belgian Federal Science Policy within the framework of the Interuniversity Attraction Poles program (IAP/P7/06), as well as by grant GOA/15/003 from the KU Leuven, and grant G.0806.13 from the Fund of Scientific Research Flanders.
Declaration of Interest
None.