


1. Introduction
The Sea-ice transport through fram Strait (fs) is one of the major export processes contributing to the mass balance of the arctic ocean. net annual Sea-ice volume exported through fs into the greenland–icelandic–norwegian (gin) Sea amounts to about 10% of the total Sea ice of the arctic ocean and is the Single largest Source of fresh water in the gin Sea (Reference Aagaard and CarmackAagaard and carmack, 1989). interannual perturbations in the Sea-ice transport through fs therefore result in a major change in the Surface Salt content of the gin Sea and can modify the major water mass formation processes through convection there. this in turn can result in Significant changes in the export of dense water from the gin Sea into the atlantic and then impact the global ocean thermohaline circulation (Reference Dickson, Meincke, Malmberg and LeeDickson and others, 1988; Reference Karstensen, Schlosser, Wallace, Bullister and J.Karstensen and others, 2005). estimates of the Sea-ice volume flux through fs (1970s–90s) range from 1600 to 5000 km3 a–1 and Show high interannual variability. during 1991–99, averaged transports amount to 2218±497km3 a–1, with individual annual values ranging from 1792 km3 (1998/99) to 3364 km3 (1994/95). See Reference Kwok, Cunningham and PangKwok and others (2004a) (kcp04 hereafter) for details. key parameters for estimates of the Sea-ice volume flux are the area covered by Sea ice, its motion and its thickness. observations of the first two parameters are available on a daily basis (area) or every other day (motion), based on all-weather and daylight-independent Space-borne passive and/or active microwave Sensors Since at least late 1978 (e.g. Reference Agnew, Le and HiroseAgnew and others, 1997; Reference Kwok, Schweiger, Rothrock, Pang and KottmeierKwok and others, 1998; Reference Cavalieri, Parkinson and VinnikovCavalieri and others, 2003). in contrast, knowledge of the Sea-ice thickness was limited in the past to a few measurements, obtained, for example, by drilling, moored upward-looking Sonars (uls; Reference T., Nordlund and KvambekkVinje and others, 1998), Submarine-based Sonar (e.g. Reference WadhamsWadhams, 2000) and ground-based or airborne electromagnetic (em) thickness Sounding (Reference HaasHaas, 2004a, Reference HaasB). previous ice-volume transport estimates through fs were obtained primarily using data from moored uls by extrapolating local thickness estimates across the entire fs to obtain a complete cross-strait ice-thickness profile (e.g. Reference T., Nordlund and KvambekkVinje and others, 1998). only recently Reference Laxon, Peacock and SmithLaxon and others (2003)obtained a first estimate of the arctic Sea-ice thickness distribution from Space-borne radar altimetry, although Severe limitations apply concerning the covered area, the minimum observable ice thickness and the temporal resolution. progress was obtained in ice-thickness observations after the launch of icesat (ice, cloud, and land elevation Satellite) in 2003. the Satellite carries the geoscience laser altimeter System (glas) measuring its height above the earth’s Surface, from which the Sea Surface height (ssh) and the Sea-ice freeboard height can be inferred. Reference Kwok, Zwally and YiKwok and others (2004b) provide a first estimate of the Sea-ice thickness distribution from icesat data.
In this paper, present State-of-the-art distributions of Sea-ice concentration (area) and motion are combined with Sea-ice thickness distributions of two glas measurement periods in the fs region to obtain the Sea-ice volume flux distribution.
2. Data and Techniques
For our estimates of Sea-ice volume flux, Satellite information about Sea-ice area, its drift and thickness have to be combined (see fig. 1). other information from in Situ and airborne Sources is only used indirectly (e.g. as geoid model and in the form of prior information on Sea-ice density and as Snow depth and density).
Schematic flow diagram of quantities involved in the estimation of the Sea-ice volume flux.

2.1. sea-ice freeboard
The glas instrument aboard icesat permits observation of the Sea ice up to 86˚ n. here the ‘GLAs/IcesAT l2 Sea ice
Altimetry data’ product (gla13) of the first two icesat measuring periods, 20 february–19 march 2003 (period i) and 26 September–17 november 2003 (period ii), is used. by measuring twice the laser pulse travel time at 1064 nm wavelength between the Sensor and the Surface, the height of the Sensor, D laser, above the Surface is obtained for a footprint of 64m diameter every 170m along track (see fig. 2; Reference ZwallyZwally and others, 2002). icesat’s orbit and thus its height above a reference ellipsoid, h ellip, is determined with an accuracy of 5 cm. by Subtracting D laser from h ellip the mean Surface elevation in the footprint above the reference ellipsoid is obtained. after atmospheric and tidal corrections, the total error budget for a Single icesat Surface elevation measurement was estimated as 13.8 cm (Reference ZwallyZwally and others, 2002). by Subtracting the geoid height, h geoid, and the contribution to Ssh due to the ocean dynamics, Δh, an estimate of the Sea-ice freeboard height, F (called ice freeboard henceforth), can be obtained (see fig. 2). Δh contains contributions caused by ocean currents, Steric Ssh changes, atmospheric pressure loading, and ocean and earth tides. accordingly, the ice freeboard, F, is given as
Schematic diagrams Showing the interrelation of ice freeboard, F, Snow depth, s, and Sea-ice thickness, I, (left) and an artist’s view of Icesat above the three involved Surfaces: reference ellipsoid, geoid and Sea Surface (right).


As with all altimeter Studies, an accurate geoid is a prerequisite for estimating the ice freeboard. in a preliminary Study, Spreen and others (http://earth.esa.int/workshops/cryosat2005/proceedings.html) found that using the project-provided geoid (EGM96) causes unrealistically large variations of the Ssh (several meters) in Some regions of the greenland Sea. we therefore use a more recent gravity field compiled by the arctic gravity project (arcgp). it represents today’s best geoid north of 64˚n and combines gravity data from Several airborne Surveys, Surface measurements (ground, helicopter, marine), Submarine data, Satellite altimetry and gravity recovery and climate experiment (grace) data on a 50 ×50 grid (Reference Forsberg and KenyonForsberg and kenyon, 2004; Reference Forsberg and SkourupForsberg and Skourup, 2005). for our purposes, the arcgp geoid heights are interpolated bilinearly onto the locations of the icesat measurements before they were Subtracted from the Surface elevation data. as explained in figure 2, the dynamic part, Δh, of the ocean has to be removed next from the remaining Ssh field before an estimate of the ice freeboard can be obtained. no measurements or models exist to date, which would provide an accurate estimate of the dynamic Ssh field during periods i and ii. instead, Δh has to be inferred from the icesat data themselves. for that purpose we use the ‘lowest-level elevation method’ proposed by zwally and yi (http://earth.esa.int/workshops/cryosat2005/) to obtain the absolute ice-freeboard estimates. a Similar method was used for airborne laser measurements by Reference Hvidegaard and ForsbergHvidegaard and forsberg (2002).
We adapted this method for our purpose as follows: (1) we divided the daily gla13 dataset into Separate icesat overpasses and took only elevation measurements with positive data-quality flags, and an uncorrected reflectivity between 0.1 and 0.9. additionally we removed outliers and Spikes by filtering. (2) we removed elevation data located in open water by using Sea-ice concentrations calculated with the artist Sea ice (AsI) algorithm from brightness temperatures measured by the 89ghz channels of the advanced microwave Scanning radiometer for the earth observing System (AMSR-E) (Reference KaleschkeKaleschke and others, 2001; Reference spreen, Kaleschke and HeygsterSpreen and others, 2005a) on a 6.25 km ×6.25km grid. elevations in areas with zero ice concentration are excluded from further analysis. the Same ice concentrations are also used later to obtain the ice area. (3) we filtered out the large-scale dynamic variability of the Ssh by Smoothing the remaining elevations with a 50 km boxcar running mean and Subtracting the Smoothed from the original elevations. the lowest 2% of the data points in these residual minimum elevations are identified and assumed to represent areas of open water or young, thin ice. this assumption is reasonable, because Such areas (leads) are abundant in the Study region (sea-ice concentrations calculated on a 25 km×25km grid rarely exceed 98%), and the combination of the frequent Sampling (every 170 m along track) and the Small footprint Size (64 m) of the glas ensures Several leads are hit during one icesat overpass. it Should be mentioned that in the marginal ice zone (miz) this 2% rule certainly results in an underestimation of open-water areas. (4) we fit the remaining minima linearly using a least absolute deviation method to account for remaining trends in the elevations after boxcar averaging. (5) the derived Ssh was Subtracted from the measured elevations to obtain the ice freeboard.
Following this approach, the ice freeboard distribution is calculated for periods i (february/march 2003) and ii (october/november 2003), yielding a mean value of 55±18 cm for period i and of 34±19cm for period ii. the Stated ± bands describe the variability of the ice freeboard in our Study region (see fig. 3). for all error estimates See Section 4 below.
(a, b) Mean Sea-ice thickness derived from Icesat observations; (c, d) Sea-ice volume flux in the direction indicated by the ice motion vectors (AMSR-E ice drift); and (e–h) zonal distribution of the meridional Sea-ice volume flux and Sea-ice drift velocity across 79˚N (black line in mid-panels) and 80˚ N. (a), (c), (e) and (f) are for February/March 2003 (period I), and (b), (d), (g) and (h) are for October/November 2003 (period II). Gridcells with no Icesat and/or no AMSR-E data are marked gray in (a–d). Drift vectors Start at lower left corner of every third gridcell. Dates are yyyy.mm.dd. The black lines in (e) and (g) are the 79˚N transect, and the blue lines the 80˚N transect; error bars denote the rms error budget of the transect data points (see text for further details). Note the different vertical Scale in (e) and (g). The lines in black in (f) and (h) are the Sea-ice drift velocities obtained from AMSR-E data (Ezraty and others, 2005), and in blue from enhanced-resolution QuiksCAT data (Reference HaarpaintnerHaarpaintner, 2006). The green line Shows the mean March (f) and October (h) ice drift of the years 1991–2002 across a Slightly different transect (KCP04).

2.2. sea-ice thickness
To retrieve ice thickness, I, from the ice freeboard, F, prior information about Snow thickness, s, and the densities of ice, ρ I, of Snow, ρ s, and of water, ρ W , is needed (see fig. 2). because today no reliable Satellite Snow-depth measurements are available covering our Study region and period, we used in Situ Snow-depth and -density measurements available in the vicinity of our Study area in combination with a Snow climatology. Snow thickness, and Snow- and ice-density measurements from the R/v Polarstern, which operated in april 2003, 1 month after period i, north of Svalbard as part of the cryovex (cryosat validation experiment) 2003 campaign, were taken as reference for period i. the observed mean Snow thickness, s, was 20 cm (range: 0–70 cm) with a density, ρ s, of 330 kgm–3. the mean ice density, ρ I, was 850 kgm–3 (range: 825–890 kgm–3). here the upper limit of ρ I = 890 kgm–3 was taken in order to account for the considerable fraction of first-year ice in the Study area, which is not represented properly by these ice density measurements, of predominantly multi-year ice. a water density, ρ W, of 1023.9 kgm–3 was used. the Snow depth was assumed to be Smaller on top of thin ice as compared to thick ice. furthermore, an isostatic balance was assumed (on average), i.e. the Snow depth on freely floating ice was assumed to be always less than or equal to the ice freeboard. this yields the following Snow thickness parameterization: if the ratio s/F>0:8 then s=0:8F; otherwise the constant Snow depth s = 0.2 m is used. with these parameters the ice thickness, I, for period i can be calculated from the ice freeboard, F, according to the archimedes principle as:

For period ii, Snow parameters can be expected to Substantially differ from those of period i (e.g. Reference WarrenWarren and others, 1999). in Situ measurements representative for Snow conditions during period ii are not available. alternatively, climatological Snow depths (Reference WarrenWarren and others, 1999) could be used, Showing values in the range of 19 and 32 cm for october and march (during periods ii and i) for the whole of the arctic, respectively. however, these values are based on observations made during 1954–91, predominantly in the central arctic. meanwhile the ice age and thickness and presumably also the Snow depth has changed, but most probably not the Seasonal cycle, i.e. the ratio between Spring and fall Snow depths Should be the Same. therefore, we estimated the Snow depth of period ii by taking the Snow depth, s, measured during cryovex as reference, as s = 19/32 ×0.2m = 0.12 m. after Reference WarrenWarren and others (1999) the Snow density in the arctic varies Seasonally rather than Spatially So that their Snow density estimate for october/november, of ρ s = 280 kgm–3, is taken for period ii. this is Supported by their Snow density measurements of 325 kgm–3 for march/april, which match well with the measurements during cryovex, of 330 kgm–3. this leads to estimates of the ice thickness during period ii as:

The Sea-ice thickness distributions as derived from the glas ice-freeboard estimates using equations (2) and (3) for the fs region are Shown in figure 3a and b. they are Scaled with asi Sea-ice concentrations Sampled onto the used 25 km grid. thus the given thickness is the mean Sea-ice thickness in the relevant gridcell including the open-water part. the mean Sea-ice thickness amounts to 3.0 and 1.9m during periods i and ii, respectively. the mean error budget of every gridcell is of the order of 1 m for both periods.
2.3. sea-ice volume flux
Finally, the Sea-ice volume flux out of every gridcell was
Obtained by combining Sea-ice motion data with the Sea-ice thickness estimates derived from icesat data. for this purpose, we used two independent validated (with buoys from the international arctic buoy program (IABP)) ice-drift datasets: firstly, ice drift estimated on a 31.25 km ×31.25 km grid from AMSR-E 89 ghz data (ezraty and others, 2005), and interpolated for our purposes onto the used 25 km× 25 km grid, and Secondly, ice drift derived from enhanced-resolution quikscat/seawinds data on a 25 km grid (Reference HaarpaintnerHaarpaintner, 2006).
The Sea-ice volume flux, vf, is calculated by multiplying the Sea-ice thickness, I, of every gridcell with the grid Size, G, and the absolute value of the Sea-ice motion, M, of this cell:

The Spatial distribution, mean amount and direction of the Sea-ice volume flux estimated with equation (4) using the AMSR-E drift is Shown for the fs region for periods i and ii in figure 3c and d.
3. Results and Discussion
Maps of Sea-ice volume flux, Shown in the middle row of figure 3, illustrate that Such estimates can now be achieved by combining Sea-ice parameters, available from various Satellites. the maps represent the mean daily flow of ice volume for every gridcell in the direction of the AMSR-E-based ice-drift vectors during periods i (left) and ii (right). inflow from neighbouring gridcells is not considered. the figure clearly Suggests that the ice volume flux through fs is not evenly distributed across the Strait, but Strongly concentrated toward its western portion. near greenland, thick landfast ice prevails. accordingly, its ice motion and volume fluxes tend to be negligible. however, east of this region the volume flux reaches its highest values, coincident with the east greenland current (egc) axis which Supports the transport of thick multi-year ice from fs Southward. further eastward the flux values decline towards the open-water area. overall, the ice thickness and ice volume flux is Smaller during period ii than during period i. this can be explained to Some extent by the thinning of ice through melting during Summer months (about 1 m). moreover, the ice-drift distribution Suggests that the ice in the fs region and the egc during period i originates from a thick-ice region north of greenland, while during period ii the ice flux tends to originate from the transpolar drift with Smaller ice thickness. the Sea-ice drift of period i appears to be, on average, about twice what is Shown for period ii.
The meridional ice volume flux across 79˚n and 80˚n for our measurements using the AMSR-E ice-drift estimates is Shown in figure 3e and g for periods i and ii, respectively. to calculate this meridional flux, data of three gridpoints around these latitudes (approximately one north, one at the latitude and one South) have been averaged. also Shown as error bars are the root-mean-square (rms) values of the flux calculated by error propagation (see Section 4). the ice volume flux is maximum between –10˚ and –5˚ e. calculating the total flux through the transect at 79˚n gives 5.6±1.0km3 d–1 for period i, and 2.1 ±0.4km3 d–1 for period ii. from these values the monthly (30 days) volume fluxes result in 168±31 and 62 ±13km3, respectively. when quikscat instead of AMSR-E ice-drift estimates are used, we obtain larger values of 7.9 ±1.2 km3 d–1 for period i, and 2.6±0.5km3 d–1 for period ii, and the corresponding monthly fluxes result in 236±37km3 and 77±14 km3, respectively. the large discrepancy of more than 25% and up to 40% between these two estimates is likely caused by difficulties for the AMSR-E or quikscat or both ice-drift calculation methods in reproducing the high drift Speeds and their variability in the fs region. the quoted overall accuracy of 2.6 cms–1 for both datasets cannot explain the discrepancy. Reference HaarpaintnerHaarpaintner (2006) States that the quikscat ice-drift errors are largest in dynamic regions like fs. it is likely that the Same is true for the AMSR-E ice-drift data.
For both periods the Sea-ice volume flux through the transect at 80˚n (for AMSR-E drift Shown in fig. 3e and g) is larger than the flux through the transect at 79˚N (period i: 6.0 ±1.1km3 d–1 (80˚ n) to 5.6 ±1.0km3 d–1 (79˚ n), period ii: 2.8±0.5km3 d–1 (80˚ n) to 2.1±0.4km3 d–1 (79˚ n) for AMSR-E drift; and period i: 8.6±1.3km3 d–1 (808 n) to 7.9 ±1.2km3 d–1 (79˚ n), period ii: 3.3 ±0.5 km3 d–1 (80˚ n) to 2.6 ±0.5 km3 d–1 (79˚ n) for quikscat drift). the influence of melting between the two transects is Small during our measurement periods. the main reason for the differences is errors. the Sea-ice volume fluxes of both transects for period i agree within their error bars. at the beginning of period ii (26 September 2003), it is the end of the Summer and thus there is Significantly less ice at 79˚N in the egc than at 80˚ n. furthermore, Some ice might be detached from the main ice Stream in that region and drift in the open Sea. if the Sea-ice concentration in that area is less than approximately 15%, it will not be detected anymore by the Sea-ice concentration algorithm and thus is lost for the ice volume calculation. this might explain the Systematic Shift to higher values at 80˚ n. also a convergent ice-drift Situation between 79˚N and 80˚N can cause differences between the two fluxes.
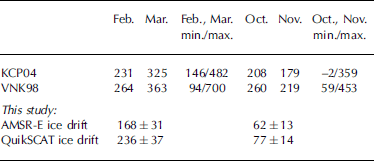
Our results can be compared to findings from KCP04 for the period 1991–99, and Reference T., Nordlund and KvambekkVinje and others (1998; VNK98 hereafter) for the period 1990–96. both Studies used ice-drift estimates from Satellite passive microwave Sensors (special Sensor microwave/imager (ssM/I)) in combination with ice-thickness estimates obtained from ice-draft measurements by uls near 79˚ n, 5˚W. in contrast to our approach, their ice thickness, and thus the ice volume flux, includes the Snow cover cumulatively. during their analysis, the ice-thickness distribution along the transect at 79˚N has been parameterized and then Scaled with the thickness determined by the uls. our results using the higher ice-drift Speeds (quikscat) tend to agree better with those previous results as Summarized in table 1. we note, however, that their analysis did not include the year 2003, and a direct comparison in the presence of interannual variability is therefore not possible. overall our fluxes are Smaller than those quoted by KCP04 and VNK98, especially for period ii. nevertheless, our results appear in the range of volume fluxes observed by the two previous Studies (as Shown by the min./max. values in table 1). our relative uncertainty for the total ice volume flux through the 79˚N transect is around 18% and comparable to the uncertainties of 12–20% published by VNK98 for their method.
Monthly mean ice-volume fluxes (km3) through Fs for the years 1991–99 (KCP04) and 1990–96 (VNK98) in comparison to our findings for the year 2003 using two ice-drift datasets (AMSR-E and QuiksCAT). The minimum and maximum values of the related Study period are also given
The mean ice-drift velocity derived from AMSR-E and quikscat data through the transect at 80˚N for IcesAT periods i and ii together with the mean ice drift for march and october for the period 1991–2002 (KCP04) is Shown in figure 3f and h. the flux gate of KCP04 connects Svalbard at ∽80˚N with greenland at ∽81˚N and thus is not identical to our transect. the maximum quikscat ice-drift values for IcesAT period i are Similar to the results of KCP04; AMSR-E ice-drift values are more than 15% Smaller. both the quikscat and the AMSR-E, zonal ice-drift distribution are much narrower than that for march 1991–2002 (fig. 3f). therefore, the integrated ice drift along our transect is Smaller than that along the mentioned flux gate for march 1991–2002, resulting in a Smaller total flux at Similar zonal ice-thickness distribution. part of the differences in the Shape of the distributions can be attributed to the Slightly different location of the two used gates. another reason could be the much longer averaging period (10 year mean of march) compared to our Study (1 year mean). for IcesAT period ii (october/november) both the quikscat- and the AMSR-E-derived maximum ice-drift values are much Smaller (>50%) than for october 1991–2002 (fig. 3h). this is a Strong argument for an extraordinarily Small ice volume flux during IcesAT period ii compared to previous years, which would explain our Smaller result.
4. Error Discussion
Sea-ice thickness is the parameter with the largest uncertainty in our Study. we do not have any Simultaneous Sea-ice thickness measurements which could be used for evaluation, but the R/v Polarstern was in the fs region 1 month after IcesAT period i. the mean ice thickness measured between 4 and 19 april 2003 by helicopter-borne em Sounding (Reference HaasHaas, 2002, 2004a) during the expedition in the region marked with a black Square in figure 3a was 2.3±0.4 m. our mean ice-thickness estimate from 1 month before in that region is 3.2±0.5 m, i.e. about 1 m larger. however, the time difference between the datasets of about 1 month, and the fact that the em-sounding and the icesat measurements both cover only a Small Subsection of the black Square in figure 3a, will lead to a difference. we also note that on average 200–500 Single icesat measurements contribute to the ice thickness in each gridcell in that region, which corresponds to only two to four icesat overpasses during period i. therefore care is needed in interpreting the difference between em-sounding and icesat data. ideally, one would combine Simultaneous icesat estimates and em Sounding. no Such coincident dataset exists, and to analyze our results quantifiably, more evaluation datasets are needed.
According to Reference ZwallyZwally and others (2002), the assumed rms error for individual icesat elevation measurements is 13.8 cm. ocean Swell can cause additional inaccuracies, particularly in the MIZ. because the ice freeboard is only of the order of a few tens of centimetres, we averaged all individual freeboard estimates of periods i and ii over 25 km×25km gridcells. the total number of measurements per gridcell from all icesat overpasses of periods i and ii is extremely variable and ranges from 1 to 4500. the large range is caused by data quality rejections and the accelerated poleward decrease in the distance of adjacent icesat overpasses causing a pronounced north–south gradient in the number of measurements per gridcell, which may Stem from just one icesat overpass within the considered period. the 13.8 cm random uncertainty in the Single-shot elevation measurement then reduces to an error of about 2 cm for our ice freeboard estimates in each gridcell (depending on the number of measurements per gridcell). but, in addition, we have to assume the presence of Systematic errors, mainly due to the uncertainties in the Ssh determination. for example, we cannot be Sure, that the 2% rule picks up all open-water measurements and that the Ssh is represented well by the linear fit. in particular, the 2% rule and Subsequent Ssh determination is applied to that Section of each icesat overpass which crosses our region of interest, but without taking into account the different length this Section may have. evidence of this uncertainty is found in figure 3a, where the arrow points to a line of Seemingly too large ice thickness. therefore we now assume an overall constant error σ Fh of 15 cm in mean ice freeboard for every gridcell of both periods.
The error, σC, for the monthly mean Sea-ice concentration, C, of one period was assumed to be 0.05 (5%) for every gridcell, which is at the upper limit (Reference Kern, Kaleschke and ClausiKern and others, 2003; Reference spreen, Kaleschke and HeygsterSpreen and others, 2005). the rms error of the mean ice freeboard including open water per gridcell is then given as

The Second term is Small compared to the first term if C > 50% and F < 80 cm. to estimate the accuracy of the Sea-ice thickness (calculated with equation (2)) the errors of Snow depth and ice, Snow and water density are needed. due to its variability and the Sparse coverage of in Situ measurements, the uncertainty in Snow depth, σs, is considered to be quite high: σs = 0.25s for both periods. the error of the Snow density ρ s is estimated to be 15 kgm–3 for period i and 20 kgm–3 for period ii considering the change in the mean Snow density for adjacent months (Reference WarrenWarren and others, 1999). the error of the water density ρ W is about 0.5 kgm–3 (Reference Laxon, Peacock and SmithLaxon and others, 2003); its contribution is neglected here. for the ice density, ρ I, an uncertainty of 20 kgm–3 is chosen from other Studies (e.g. Reference Laxon, Peacock and SmithLaxon and others, 2003). the error, σI, of the ice thickness is calculated from:
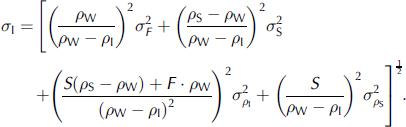
This introduces an error of approximately 1 m into our Sea-ice thickness estimates of 1.9 and 3.0m for periods i and ii, respectively.
Finally the error in the ice-drift Speed M is needed and could be taken as 2.6 cms–1 (2.2km d–1) for both ice-drift datasets (ezraty and others, 2005; Reference HaarpaintnerHaarpaintner, 2006). this is the mean drift error for the whole of the arctic derived by comparison to iabp buoy drift Speeds. however, Reference HaarpaintnerHaarpaintner (2006) Stated that the error is larger in dynamic regions Such as fs, and by comparing the mean monthly drift Speeds at our transect at 80˚n (see fig. 3f and h) we also find larger differences between the two datasets. therefore we doubled the Single-measurement ice-drift error to σM s = 4.4 kmd–1. this leads to

For the mean drift error, σM, of a period of n days (n days = 28 for icesat period i and n days = 41 for period ii).
The mean error, σ Vf, of the ice volume flux calculated with equation (4) is then given as

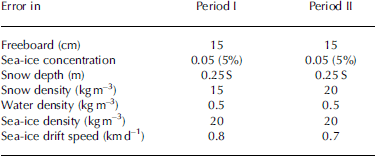
Again we come up with large error budgets of around 45%. the quantity of the error varies depending on the value of vf (e.g. σ Vf = 0.17 km3 d–1 for vf = 0.4 km3 d–1 and σ Vf = 0.07 km3 d–1 for vf = 0.12 km3 d–1). all assumed errors for the different quantities are Summarized in table 2.
Mean errors per gridcell of all quantities used to derive the Sea-ice volume flux
A Sensitivity Study was carried out in order to examine the Systematic error that could be caused by a Systematic bias in the input parameters. as with regard to the ice thickness, we found the Systematic error caused by a bias in Snow density (±30 kgm–3) to be negligible (<0.05 m) compared to that caused by a bias in the Snow thickness (±10 cm), which is about 0.2 m. the error caused by a bias in the ice density (±30 kgm–3) is largest; it increases with freeboard height and is larger for an under- than an overestimation of the real ice density. this error takes a value of 0.5 m (1.5 m) for an ice thickness of 2m (5 m), if the real ice density is underestimated by 30 kgm–3. as with regard to the ice volume flux, the Systematic error caused by the Same biases (see above) is negligible in the case of the Snow density, and is <0.1km3 d–1 in the case of the Snow depth and therefore Small compared to the other contributions (see below) for an ice thickness above about 2 m. the Systematic error in the ice volume flux caused by a bias in the ice density or the ice-drift Speed (2cms–1) depends on ice thickness and drift Speed and takes values of, for example, 0.08–0.13 and 0.15–0.26 km3 d–1 at an ice thickness of 3 m and ice-drift Speeds of 6 and 12cms–1, respectively. we note here that these Systematic errors are not influenced by an improvement in the Ssh estimation, which leads to the conclusion that future work Should focus equally on this improvement and on the validity of the input parameters, especially ice density and ice-drift Speed, where a bias may have an equally large impact on the estimated ice volume flux.
5. Conclusions
We presented here a multi-sensor Satellite approach to estimate ice volume transport, which, for the first time, allows information to be obtained about Spatial Structures in Sea-ice volume fluxes on a monthly basis. the approach combines Surface elevation measurements obtained by the icesat glas instrument with the Surface area flux obtained from passive (AMSR-E) and active (quikscat) microwave observations. to obtain quantitative ice-thickness estimates from glas measurements, its individual measurements have to be averaged over (at least) a month. the approach is applied to data of the first two icesat measurement periods (february/march and october/november 2003) in the fs region. estimated meridional ice-volume fluxes across 79˚n amount to approximately 200 and 70 km3 for periods i and ii, respectively. the fact that these values are at the lower bound of earlier observations using ULs-derived ice thickness, particularly for period ii, can to Some extent be explained by a Significantly Smaller ice-drift Speed observed during this period as compared to earlier years. because of a large interannual variability in ice drift, a direct comparison between our results and those of earlier Studies would not be meaningful and therefore is not the goal of this paper.
The parameters Ssh, ice density, Snow density and Snow depth, which determine the accuracy of our ice volume flux estimates, are highly variable and cannot be determined with Sufficient accuracy. a careful error and Sensitivity analysis reveals that Ssh, ice-drift Speed, Snow depth and ice density can be of equal importance for the accuracy. regarding Ssh, improved estimates can be expected from a more accurate geoid and better ocean flow information, which together could allow a more accurate estimation of the ice freeboard, a reduction of the averaging period, and thus ice volume flux estimates for Shorter periods (ice area and drift are available daily). ice-drift Speed estimates may improve when using an approach especially tuned for the highly dynamic fs region. further validation of the AMSR-E Snow-depth algorithm for arctic Sea ice may improve the Situation with respect to Snow depth (Reference Comiso, J.C., Cavalieri and MarkusComiso and others, 2003). at the time of writing, the Snow-depth estimates available from AMSR-E data are Significantly Smaller than in Situ measurements available in the fs region. thus these data are not used in this Study. most difficult would be an improvement with respect to the ice density, which may be achieved, however, by distinguishing at least first- and multi-year ice and assigning different density values for each class.
If more icesat glas 13 data become available to us, the new measurement periods can be added to our analysis of the Sea-ice volume flux. it is very unfortunate for our analysis that icesat only operates for 3 months per year at maximum. therefore there will always be large gaps in this time Series. also, during Summer months the ice-drift retrieval using AMSR-E or quikscat data is hampered, if not impossible, due to melting conditions on the ice Surface. thus for Summer months our method would have to use other ice-drift data (e.g. from Synthetic aperture radar) which are not available on a Similar daily and Spatial basis.
Our approach of estimating Sea-ice volume transport is entirely Satellite-based and can therefore be applied to other geographical regions than the greenland Sea. we anticipate that our method can be easily adapted to new freeboard measurements like the ones expected to be available from the upcoming cryosat-ii mission. cryosat-ii will measure continuously and thus the gaps in the time Series could be Significantly reduced by use of these data.
Acknowledgements
This work was Supported by the german research foundation (DFG) project SFB 512-E1. the authors gratefully acknowledge the provision of icesat and AMSR-E data by the us national Snow and ice data center (NsIDC), boulder, co. in particular, we thank r. ezraty and f. girard-ardhuin of the institut français pour l’exploitation de la mer (ifremer), brest, france, for provision of and Support to Sea-ice-drift data from AMSR-E.we thank the two anonymous reviewers for helpful comments.



