


1. Introduction
The accumulation rate of snow on polar ice sheets is of primary glaciological and climatic significance. Glaciologists seek to understand the spatial distribution of accumulation rates (e.g. Reference Vaughan, Bamber, Giovinetto, Russell and RVaughan and others, 1999) in order to estimate ice-sheet mass balance and to use as a boundary condition for numerical models of ice-sheet behavior. Climatologists are interested in the distribution of snowfall in order to correctly parameterize the global water budget (e.g. Reference BromwichBromwich, 1988) and because temporal variations in accumulation rate are potential evidence of climate change (e.g. Reference Morgan, Goodwin, Etheridge and WookeyMorgan and others, 1991).
The traditional method for determining ice-sheet accumulation rates is to study ice-core stratigraphy. Snow deposition and preservation leads to a series of identifiable layers that can be dated by a variety of techniques (e.g. Reference Pourchet, Pinglot and LoriusPourchet and others, 1983; Reference Mosley-Thompson and ThompsonMosley-Thompson and Thompson, 1985; Reference AlleyAlley and others, 1997). Accurate measurement of these layers combined with a well-constrained depth–density profile enables the determination of accumulation rates. Ice cores, by definition, provide point records of accumulation rate, and commonly one core provides the only estimate of snowfall for a region extending tens or hundreds of kilometers from the core site.
The spatial scale of significance for a single ice-core record is a critical issue. Small-scale surface roughness, such as sastrugi, introduces a high-frequency, quasi-stochastic variability into ice-core records of annual layer thickness, but can generally be neglected (Reference Van der Veen and BolzanVan der Veen and Bolzan, 1999) at depths beyond the near-surface layers. A more serious problem arises for cores collected at sites not located on stationary ice divides. In those cases, the flow of ice affects the stratigraphic record by advecting snow away from its original site of deposition. Earlier studies have shown that low-amplitude undulations, typical of ice-sheet interiors, can affect the deposition of snow through the influence of katabatic winds (Reference Gow and RowlandGow and Rowland, 1965; Reference WhillansWhillans, 1975; Reference Richardson and HolmlundRichardson and Holmlund, 1999; Reference SommerSommer and others, 2000). Increases in surface slope tend to increase katabatic wind speeds, which in turn inhibits snow deposition or actively erodes previously deposited snow. In such cases, local minima in accumulation rates are usually found on the upwind side of topographic highs, while accumulation rates are largest in troughs (Reference Gow and RowlandGow and Rowland, 1965). An ice-core record recovered down-glacier from a region of undulating topography will therefore contain a history of accumulation in which potential climate-change signals are convolved with ice-flow effects. This scenario, not altogether uncommon, demonstrates the need for caution when interpreting ice-core records of accumulation rate.
A case in point is a ∼2000 year record of annual layer thicknesses derived from a 202 m deep ice core collected at South Pole (Reference Hogan and GowHogan and Gow, 1997). This record displays a multi-centennial-scale variability in accumulation rate that has been interpreted as evidence for changes in climate. The aim of the present study is to reinterpret the causes of the multi-centennial-scale variability using independent measurements of ice-sheet surface topography, ice flow and local accumulation rates, collected as a part of a separate study to calculate mass balance. A new interpretation shows that nearly all the observed accumulation variability can be explained by differential snow accumulation on undulations up-glacier from the ice-core recovery site.
2. South Pole Accumulation Record
The distribution of annual layer thicknesses (accumulation rate) in a core collected at South Pole is described by Reference Hogan and GowHogan and Gow (1997). The 202 m core was collected during the 1981/82 austral summer field season adjacent to Amundsen–Scott South Pole Station at an elevation of ∼2800m on the East Antarctic ice sheet. Annual layer thicknesses were converted to water equivalent thicknesses using field measurements of firn density corresponding to each depth interval. The core was dated by visible stratigraphy, in which each annual layer is represented by a couplet of low-density summer hoar and denser fine-grained winter snow. Hogan and Gow’s record is reproduced in Figure 1.
2000 year record of water equivalent accumulation from a core at South Pole. The record has been smoothed using a 20 year mean, with the plotted point representing the mean of the 20 preceding (older) years. Adapted from Reference Hogan and GowHogan and Gow (1997).
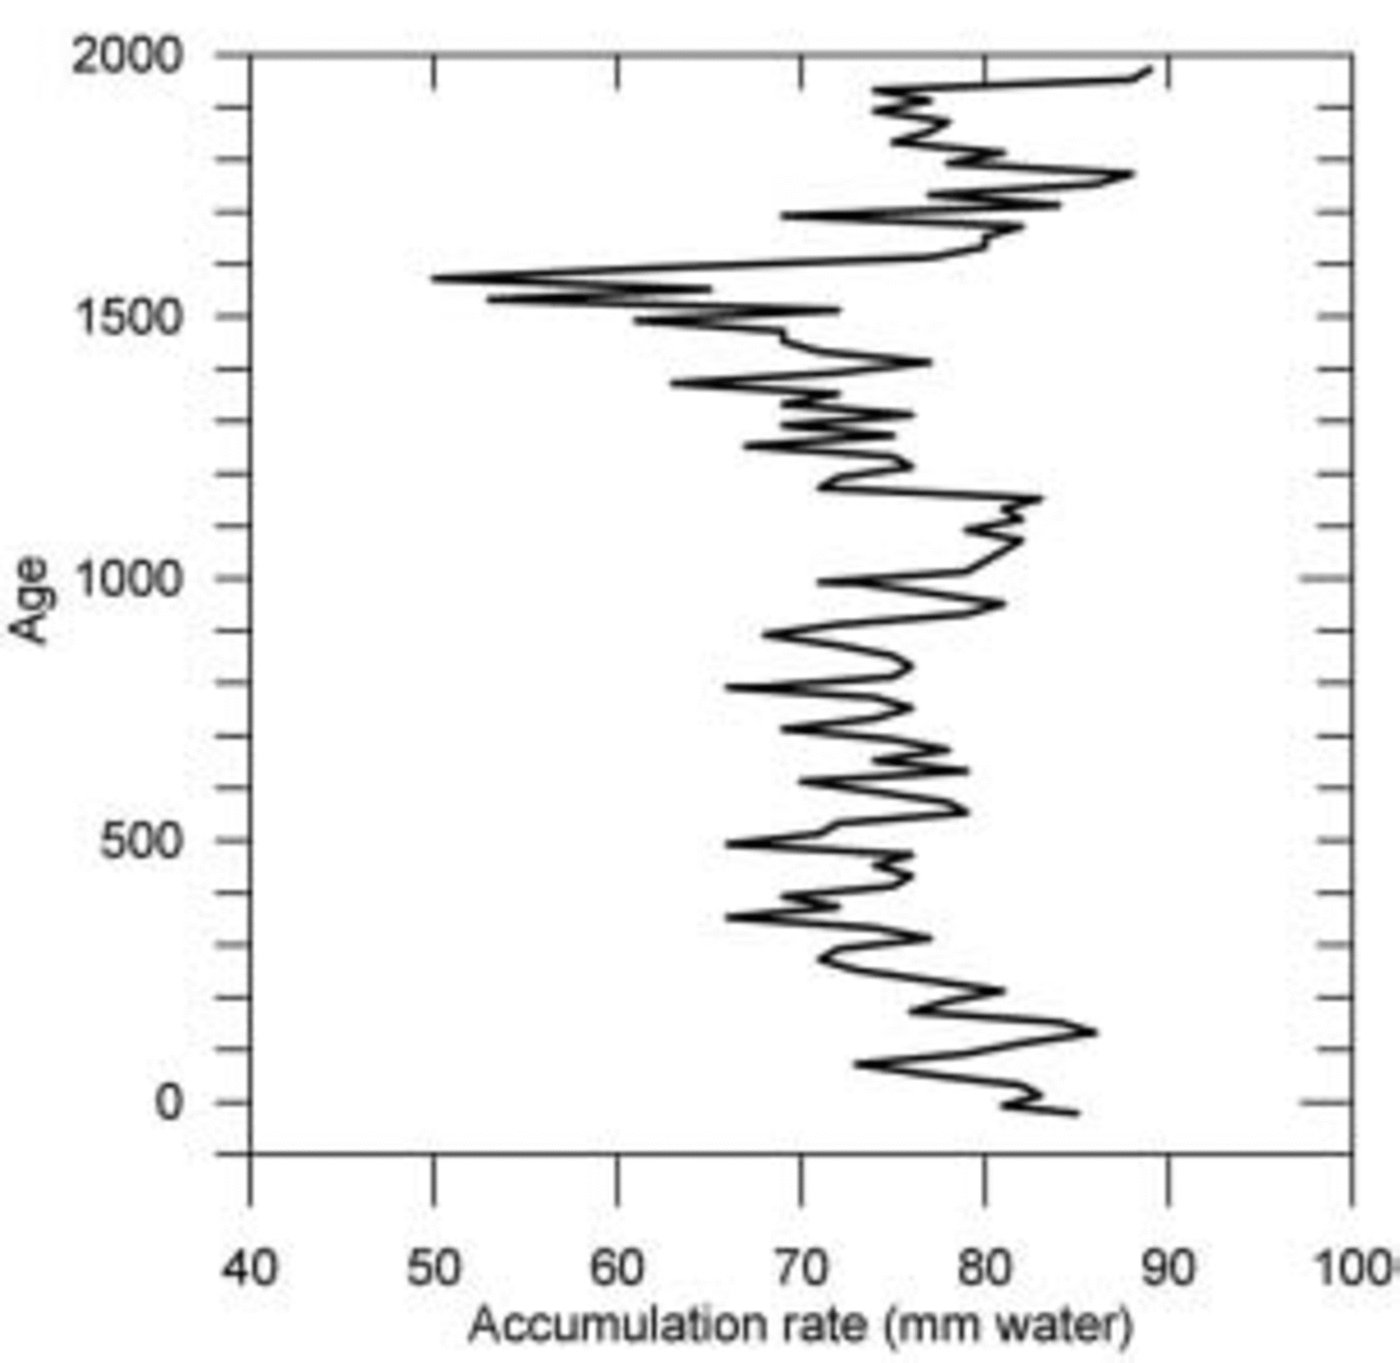
The mean accumulation rate, derived from the 2000 annual layers, is ∼0.075ma–1w.e. However, Figure 1 demonstrates that there have been periods in the record when accumulation rates have varied substantially from the long-term mean. Beginning with the earliest 800 years of the record, there is a gradual decrease in annual water equivalent accumulation (Reference Hogan and GowHogan and Gow, 1997). The next ∼300 years show a slight increase in accumulation rates until about AD 1200, when accumulation begins to decrease again. The most notable feature of the record occurs around AD 1600, when there is a marked drop in annual water equivalent accumulations. Mean accumulation rates during this century-long period are ∼0.055ma–1w.e., approximately 26% less than the 2000 year mean. This period is followed by a sudden, relatively rapid increase in accumulation (Reference Hogan and GowHogan and Gow, 1997). The most recent 300 years of the record are characterized by gradually increasing annual accumulations.
The upper part of the South Pole ice-core record overlaps with a 182 year record (AD 1760–1942) of accumulation derived from the wall of a snow mine excavated nearby (Reference Giovinetto and SchwerdtfegerGiovinetto and Schwerdtfeger, 1966). The snow-mine record also contains a trend of increasing accumulation rates during the last two centuries.
One explanation for the observed variability of annual accumulation in the South Pole core is related to climate. Reference Hogan and GowHogan and Gow (1997) interpret the increasing trend in water equivalent accumulation (i.e. the portion of the record since the interval around AD 1600 when accumulation was substantially reduced) as being due to more vigorous meridional transport of moisture to interior East Antarctica.
A second explanation is related to ice dynamics. Because the South Pole is not located on a stationary ice divide of the East Antarctic ice sheet, the older layers in the Hogan and Gow record were advected to the core site from their places of deposition up-glacier. The surface topography of ice-sheet interiors is characterized by a series of low-amplitude bumps with a spacing of 2–10km (Reference BuddBudd, 1970) leading to the possibility that the South Pole core site traveled through a field of undulations during the last 2000 years. This hypothesis is investigated in the following section.
3. Ice Dynamics at South Pole
As part of a program to calculate the mass balance of the East Antarctic ice sheet at South Pole, measurements of ice surface elevation, ice velocity and accumulation rate were acquired in the region surrounding the station. Fortuitously, two shallow firn cores were collected almost directly up-glacier from Reference Hogan and GowHogan and Gow’s (1997) core site, at places of markedly different surface slope. These data enable an assessment of the ice-dynamics influence on the long accumulation record.
3.1. Surface topography
The elevation of the ice-sheet surface was surveyed using global positioning system (GPS) techniques. Two types of kinematic surveys were undertaken, whereby a roving receiver was mounted on a vehicle and driven in a series of predetermined routes across the region of interest. A stop-and-go kinematic survey was conducted during the 1995/96 field season, and a fully kinematic survey was conducted during the 1997/98 season. Both surveys entailed the use of a local base station. The difference between the two types of survey is that stop-and-go surveying required the receiver to stop and make a short (<60 s) static observation at regular intervals (∼250m apart in this case). During the fully kinematic survey, the receiver collected position information every 5 s along track, resulting in a closer spacing of elevation measurements (approximately 35m apart, based on vehicle driving speeds during the survey). (Technological limitations did not allow for fully kinematic techniques during the first field season.) The survey data were post-processed relative to the same base station and the elevations adjusted for the 1995/96 snow surface. Root-mean-square uncertainties for the vertical component of computed positions never exceed 0.05 m.
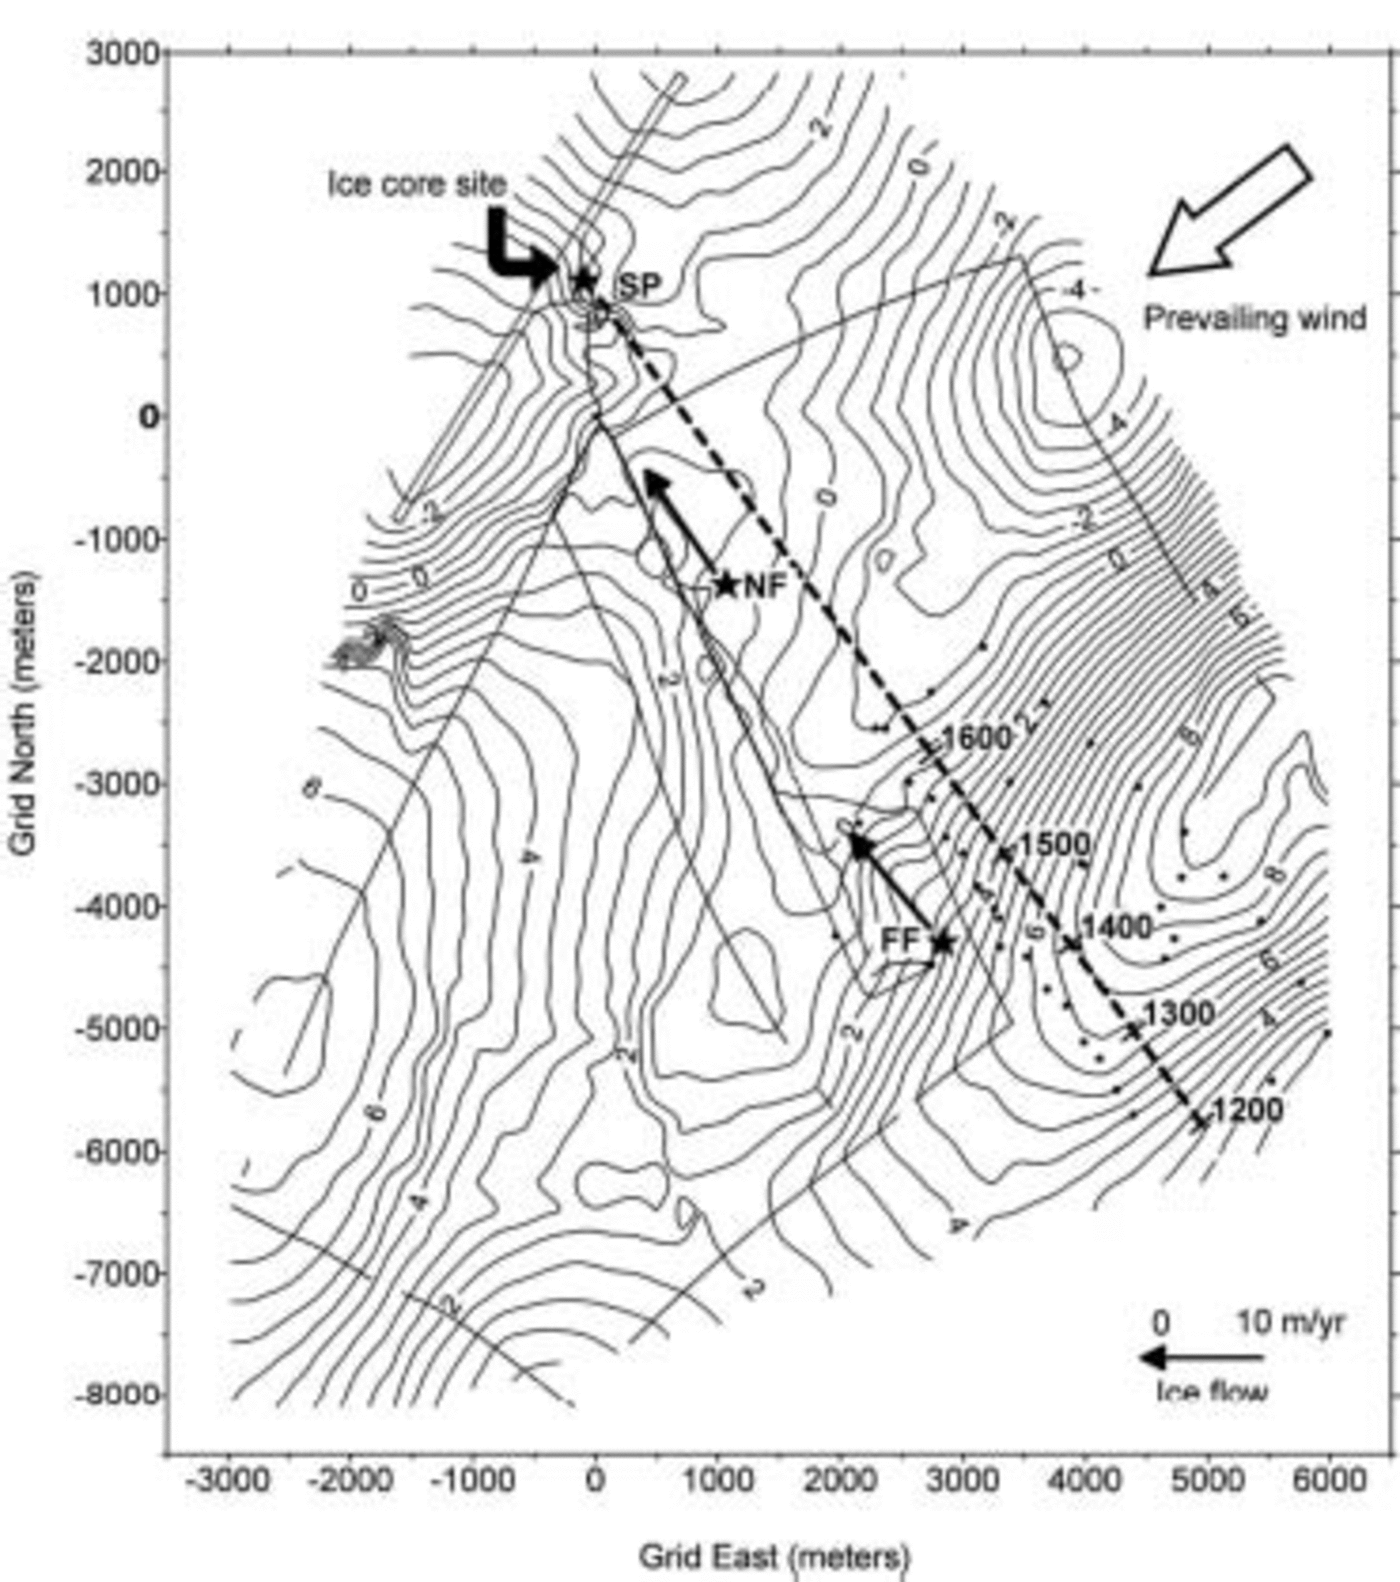
Survey data were gridded using a kriging algorithm. The derived map of surface topography is shown in Figure 2. The map reveals a complex two-dimensional mixture of flanks, ridges and depressions in the surface close to South Pole. Another map of surface elevations covering a wider area (∼40km×40 km), but at a lesser resolution (4m contour interval), appears in Van derVeen and others (1999). Together, both maps indicate a characteristic undulation wavelength of ∼5–8km in this region of the East Antarctic ice sheet.
Surface topography in the vicinity of Amundsen–Scott South Pole Station (SP) derived from kinematic GPS surveys. Stop-and-go survey data are indicated by dots, and the fully kinematic data by the heavy solid lines (for reference, the inclined lines at the upper left mark the boundary of the aircraft skiway). The contour interval is 0.5 m, and the origin for the local projection is the GPS base station (denoted GPS). Shallow firn cores were collected at the Far Field (FF) and Near Field (NF) sites. The flow vectors for these sites, based on repeat GPS surveys, are also shown. The 2000 year record of accumulation (Reference Hogan and GowHogan and Gow, 1997) was obtained from an ice core collected near SP. Its reconstructed trajectory is indicated with a dashed line, with ages corresponding to sites of deposition for layers in the core.
3.2. Ice flow
Ice velocity was measured at two locations, denoted NF (for Near Field) and FF (for Far Field) in Figure 2. The velocities were derived from repeat GPS surveys of markers at both locations, conducted annually between December 1995 and January 2000. Each survey consisted of a static observation (18–24 hours duration) using dual-frequency phase-tracking GPS receivers. Data were post-processed (see Reference Hamilton and WhillansHamilton and Whillans, 2000) to yield precise point positions for each occupation and subsequently ice-flow velocities for each location (Table 1).
Ice velocities and accumulation rates for the FF and NF sites close to South Pole. 1σ uncertainties are shown in parentheses
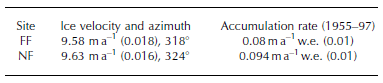
Flow speeds near South Pole are ∼10ma–1 in the direction of the 40˚W meridian. These results are consistent with separate ice-flow measurements conducted at the ceremonial South Pole marker (G. Shupe and L. Hothem, unpublished information).
3.3. Accumulation rate
Two shallow firn cores (∼12 m) were collected during the 1997/98 season, one each at the NF and FF sites (Fig. 2).
Core-processing procedures followed those described by Reference Whillans and BindschadlerWhillans and Bindschadler (1988) and Reference Whillans and BolzanWhillans and Bolzan (1988). The results of those analyses provide ∼40 year mean annual accumulation rates for each site, based on the detection of horizons containing elevated amounts of bomb fission material deposited after the 1955 South Pacific nuclear tests.
Accumulation rates around South Pole, averaged over the period 1955–97, are ∼0.09ma–1w.e. (Table 1) and are consistent with other measurements in this area (e.g. Reference Mosley-Thompson, Paskievitch, Gow and ThompsonMosley-Thompson and others, 1999). However, these values are slightly larger than the longer-term mean of 0.075 ma–1 w.e.) reported by Hogan and Gow (1997). This difference might be attributable to a ∼30% increase in accumulation since the 1960s, as reported by Reference Mosley-Thompson, Paskievitch, Gow and ThompsonMosley-Thompson and others (1999).
The new results from NF and FF indicate a notable difference between the two sites. Snow-accumulation rates are approximately 18% larger at the NF site compared to FF. This spatial gradient is interpreted as a function of topography (the two sites are only 4 km apart, so it is unlikely that there is any difference in the spatial pattern of moisture advection over the two locations). FF is located on the flank of an undulation, whereas NF is close to a relatively flat depression. The locally smaller accumulation rate at FF is consistent with the relatively steep surface slope at this site (cf. Reference Gow and RowlandGow and Rowland, 1965; Reference WhillansWhillans, 1975).
Surface topography influences snow-accumulation rates through the interaction with katabatic winds. Wind speeds increase when local surface slope steepens, thereby inhibiting the deposition of snow or actively eroding material from the surface (Reference WhillansWhillans, 1975). At FF, the prevailing regional wind direction is ∼45˚ different to the principal axis of slope (Fig. 2), so it is not clear how the process described above might operate. However, it is likely that winds diverge around the crest of the undulation located grid east of FF (Fig. 2), producing at least some downslope, or scouring, component of airflow over this core site. These enhanced winds are probably responsible for the reduced accumulation rate recorded in the shallow core at FF.
4. Discussion
The trajectory of Hogan and Gow’s ice core can be reconstructed using the ice-flow data described above. Using a flow speed of 10ma–1, the trajectory can be traced as far as ∼AD 1200 before it passes beyond the limit of the detailed elevation data (Fig. 2). Examination of the trajectory, and the topography encountered, enables a reinterpretation of the last ∼800 years of annual accumulation in the South Pole record (Reference Hogan and GowHogan and Gow, 1997).
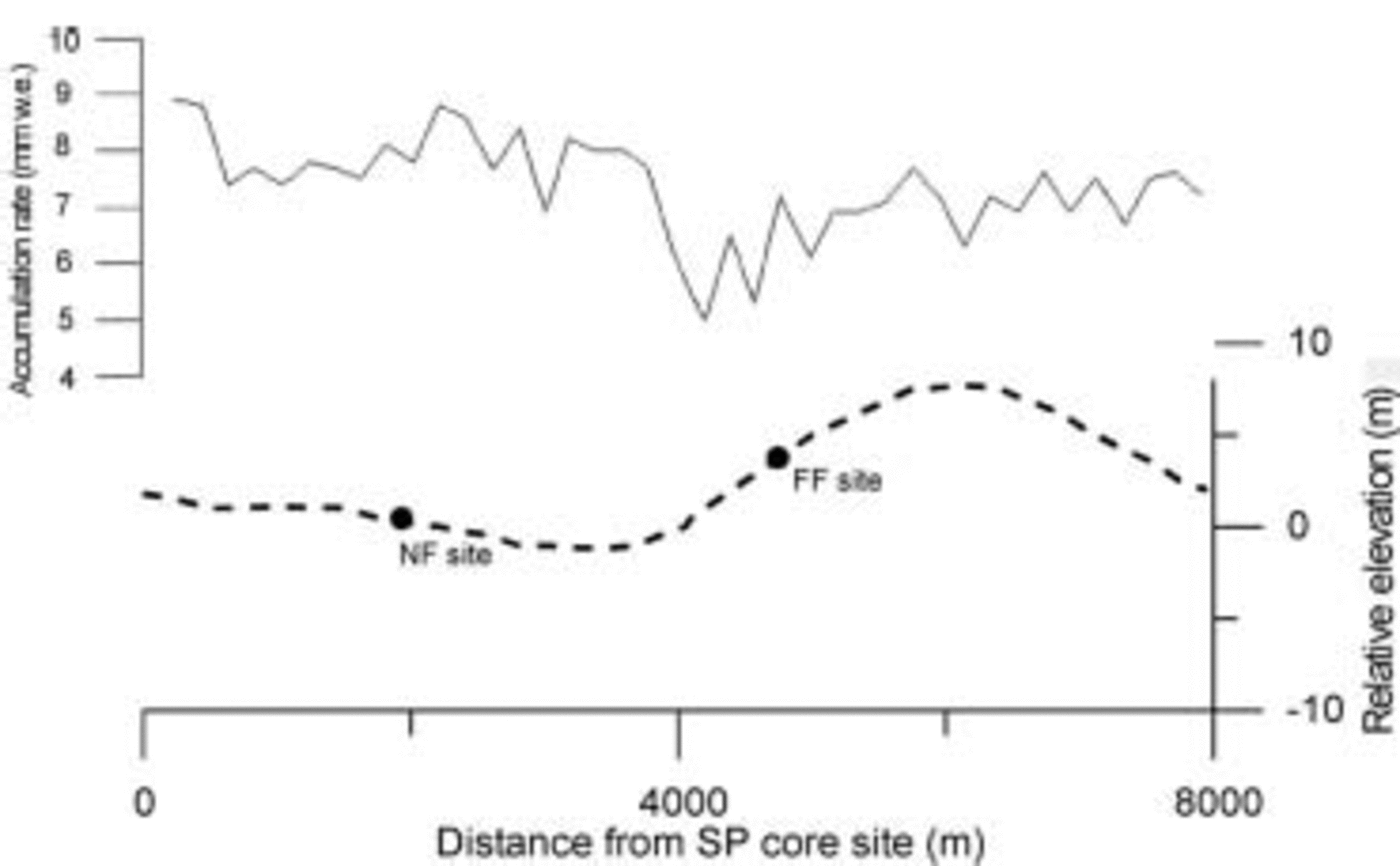
During the most recent 400 years of the record, snow has been deposited on a relatively flat surface. For the preceding period, ∼AD 1200–1600, snow deposition occurred on a relatively steep flank. Prior to that, snow was deposited on the crest of an undulation. These topographic regimes broadly correspond to changes in water equivalent accumulation (Fig. 3). The increasing accumulation over the last 400 years (Reference Hogan and GowHogan and Gow, 1997) is consistent with locally larger snow deposition in troughs and flat areas between ridge crests (Reference WhillansWhillans, 1975). The sudden increase in accumulation around AD 1600 (Reference Hogan and GowHogan and Gow, 1997) seems to be related to the change in surface slope, from steep flank to flat depression. During the time accumulation rates were substantially smaller than the rest of the record, snow was being deposited on the relatively steep flank (Fig. 3). Modern accumulation rates in this area, as measured in the FF core, are ∼18% smaller than in the flatter area down-glacier (NF), and this difference is comparable to the ∼26% decrease in accumulation reported by Reference Hogan and GowHogan and Gow (1997). If this analysis is valid, it implies that accumulation variability in the South Pole record has an ice-dynamics signature and does not support an interpretation of variable meridional moisture advection to interior East Antarctica.
Annual layer thicknesses from the Reference Hogan and GowHogan and Gow (1997) ice-core record (top line) plotted against elevation (dashed lower line) along the last 800 years of trajectory. Note the agreement between reduced accumulation rate and surface steepening.
The above analysis assumes that surface topography around South Pole has been time-invariant for the last millennium, which is perhaps an oversimplification.
Preferential deposition of snow in regions of decreased surface slope causes the topography to evolve over time. This evolution manifests itself as a migration of the undulations in the upwind direction (Reference Black and BuddBlack and Budd, 1964). Estimates of this migration rate range between 20 and 25ma–1 (Reference Black and BuddBlack and Budd, 1964; Reference WhillansWhillans, 1975). Ice motion further modifies the evolving topography by advecting it in the direction of glacier flow.
The evolution of topography around South Pole is a complex issue because the ice flow and prevailing wind directions are orthogonal to one another. In the absence of detailed modeling (cf. Reference Black and BuddBlack and Budd, 1964), or repeat mapping to detect migrating topography, it is not possible to quantify the effect of surface evolution on the accumulation record. However, modern changes in surface slope along the ice-core trajectory are qualitatively compatible with the accumulation rate variability in the record.
Other studies have noted a relationship between surface topography and snow accumulation at South Pole. Reference GowGow (1965) found that more snow accumulates in depressions than on crests and flanks, based on a limited number of exposed stake heights. Reference Mosley-Thompson, Paskievitch, Gow and ThompsonMosley-Thompson and others (1999) monitored a more extensive network of 236 stakes and noted that locally large accumulation rates, averaged over a 5 year period, were associated with topographic depressions.
The stake network data were used by Reference Van der Veen, Mosley-Thompson, Gow and MarkVan der Veen and others (1999) to argue that variability in several long accumulation records at South Pole (including Reference Hogan and GowHogan and Gow’s (1997) record) might have a topographic origin. That interpretation is supported by the present study which incorporates additional high-resolution elevation mapping and accumulation rates measured directly upflow from Hogan and Gow’s core site.
5. Summary
A millennium of annual water equivalent accumulation recorded in an ice core at South Pole (Reference Hogan and GowHogan and Gow, 1997) has been reinterpreted using measurements of local topography, ice flow and modern accumulation rates. The reconstructed trajectory of the ice core shows that periods of relatively large annual accumulation in the core correspond to deposition in a topographic depression. Similarly, a period of reduced accumulation is consistent with deposition on a relatively steep flank up-glacier of the ice-core site, where modern accumulation rates are ∼18% smaller than those measured nearby in a depression. The sudden increase in annual accumulation in the 17th century, as recorded by the core, corresponds to the present-day position of a change in surface slope from steep flank to flat depression. The analysis does not account for the evolution of surface topography over the time period covered by the record. However, the results are consistent with other studies that indicate a connection between local accumulation rate variability and surface slope at South Pole and elsewhere.
An ice-dynamics interpretation for accumulation variability observed in the South Pole record, and not climate (Reference Hogan and GowHogan and Gow, 1997), demonstrates the need for caution in using records of polar snow accumulation to infer climate change. A recommended procedure is to conduct a regional program of ice flow, topography and accumulation measurements in association with the recovery of centennial- or millennial-scale ice-core records. These ancillary data will facilitate the deconvolution of ice-dynamics effects from climate histories.
Acknowledgements
S. Price and B. Spikes supplied the necessary brute strength to collect the shallow firn cores at high altitude and in bad weather. E. Venteris and I. Whillans also assisted with the fieldwork. Comments from C. Richardson and T. Scambos improved the final manuscript. Support for this work was provided by the US National Science Foundation (OPP-9419396 and OPP-0196441).



