INTRODUCTION
Yams are usually regarded as demanding high soil fertility and are given first priority in the cropping cycle of traditional farmers employing long bush-fallow rotations (swidden farming). In surveys conducted by the author and collaborators in Papua New Guinea (unpublished), farmers reported that shortened fallows have been associated with progressive yield decline. However, reported responses to fertilizers have been erratic and usually of low magnitude, compared with effects of sett size or staking (Chapman, Reference Chapman1965; Enyi, Reference Enyi1972; Obigbesan, Reference Obigbesan1981; Vander Zaag et al., Reference Vander Zaag, Fox, Kwakye and Obigbesan1980). Similarly, Melteras (Reference Melteras2005) found little or no response to fertilizers in trials with various yam species in Vanuatu, despite well-characterized nutrient deficits in the soils tested (Melteras et al., Reference Melteras, O'Sullivan, Asher and Lebot2004).
Possible explanations were that the fertilizer placement or timing was inappropriate for efficient nutrient recovery by yam, or that the 2-m treatment separation was insufficient. An experiment was conducted in which roots were excavated at monthly intervals, and their length and depth measured (Melteras et al., Reference Melteras, Lebot, Asher and O'Sullivan2008). It was observed that the roots radiated horizontally from the crown of the planting sett, remaining shallow and with relatively little branching until they were near their maximum length (at 2–3 m from the planting position, but some exceeding 4 m), when they would branch and descend to around 30 cm depth. Relatively few root branches and fine roots were found within the planting mound until after tuberization, when roots developed on the new tubers. However, roots frequently occupied the mounds of adjacent plants.
The current experiment was conducted to quantify further the extent of yam root distribution horizontally and vertically, and the ability of yam to access nutrients at various locations relative to the planting position. Strontium (Sr) was used as a non-radioactive tracer of root activity. Strontium is an analogue of calcium (Ca), with low natural abundance in most soils. It has proven a useful tracer of root activity except where native Sr is unusually high (Lehmann and Muraoka, Reference Lehmann and Muraoka2001), or where soil exchangeable Ca is very high causing competitive inhibition of tracer Sr uptake (Pinkerton and Simpson, Reference Pinkerton and Simpson1979). Like Ca, it has low mobility in the soil (Pinkerton and Simpson, Reference Pinkerton and Simpson1979; Soileau, Reference Soileau1973) and is not phloem-mobile within the plant, accumulating with leaf age and transpiration. Unlike radioisotope tracers, the signal does not decay, making Sr ideal for use with a long-season crop such as yam. Its low cost, low toxicity and ease of analysis are further advantages for field applications.
MATERIALS AND METHODS
The trial was conducted at the Redlands Research Station of the Queensland Department of Primary Industries and Fisheries, Cleveland, Australia (27°31′S, 153°15′E, 35 m asl) between November 2004 and May 2005. The soil was a red-brown Krasnozems (Nitisol by FAO taxonomy), having a clay-loam texture, moderately high infiltration rate and internal drainage, and a high water holding capacity and cation exchange capacity. During the experimental period, 676 mm rain fell, and was supplemented with overhead irrigation as required. Mean daily maximum and minimum temperatures were 27.8 °C and 18.6 °C respectively. The experimental area, consisting of three planting rows 32 m in length and 1 m apart, was divided into seven plots using plastic sheet root barriers buried to 0.6 m and extending 2 m either side of the planting rows. Plants were spaced 1 m × 1 m (a normal spacing for yam crops in the Pacific), and root barriers were 1 m from adjacent plants. Planting material consisted of small whole tubers weighing from 100 g to 150 g, of Dioscorea alata cv. Paholo (originating in Tonga). All tubers were showing sprout buds at the time of planting. Setts were planted in a shallow planting hole with their crowns at natural ground level, and the soil mounded up to 15 cm over them. Each plant was staked with a single vertical stake 1.5 m high. Weed intensity was low and weeding was done by hand, taking care not to disturb soil near Sr placements and to remove weeds from the site in case they may have elevated Sr levels. No fungicides or pesticides were applied to the setts or the crop. Yam anthracnose (Colletotrichum gloeosporioides) is not known to occur in southeast Queensland, and no significant foliar disorders were observed on the crop.
Three separate experiments were included in the trial. The first tested the horizontal reach of roots. It consisted of seven rows of three plants, with strontium nitrate applied midway between the first and second row, such that plants varied from 0.5 m to 5.5 m from the source. Strontium was applied immediately before planting. A trench was dug 30 cm deep, 15 cm wide and 4 m long, extending 1 m either side of the planting rows. Strontium nitrate was applied in solution at 50 g Sr l−1. Six doses of 200 ml were applied (a total of 60 g Sr), each spread evenly along the trench at depth intervals of 5 cm, from 30 cm to 5 cm depth. The treated soil was loosened with the end of a stake to mix within the 5 cm band, before covering with each 5 cm layer, to achieve an approximately uniform vertical distribution within the band.
The second experiment compared four depths of placement, at 7, 15, 25 and 40 cm. The four plots each contained three rows of three plants. A trench was dug the length of all four plots, between the first and second plant row, before installation of the root barriers. After barriers were in place, the trench was back-filled to the required depth in each plot before applying 30 g Sr in solution, and filling over. The treated strip in each plot was 3 m long, extending 0.5 m either side of the plant rows.
The third experiment compared two fertilizer placements which had been used in field trials, with the aim of examining nutrient uptake by the plant treated and by adjacent plants. Each plot contained three rows of three plants, with 10 g Sr as Sr(NO3)2 solution applied to the central plant. In the ‘under sett’ treatment, the planting hole was dug to 20 cm depth, the Sr applied to the base and mixed into a layer about 5 cm deep, and covered with 10 cm of soil before placing the sett and mounding up. In the ‘around sett’ treatment, the Sr was applied after positioning the sett, in a ring of 15 cm radius around the sett. A shallow trench was formed with the point of a stake before the Sr was applied to it. Soil was then mounded up over the sett and the Sr band. A third placement option, banding midway between plant rows, was represented by the first three rows of Experiment 1: Sr was banded between rows 1 and 2, plants in these rows being regarded as treated, and row 3 being adjacent plants.
In addition to the above, 12 setts were planted 30 m away as controls to establish background Sr levels.
Young expanded leaf blades were sampled every four weeks from 5 to 17 weeks after planting (WAP). The leaves were taken from the 5th and 6th nodes from an active tip, as these leaves have been selected as the standardized index tissue in our studies of nutritional status of D. alata (O'Sullivan and Jenner, 2006). By 17 WAP, vines were crossing from one stake to the next too frequently to keep the plants separated, and sampled vines were traced with difficulty from the tip back to their base to ensure the plant of origin of sampled young leaves. It was anticipated that this would not be possible at later harvest dates. Therefore a second sample was taken at 17 WAP of the oldest non-senescent leaves, by tracing vines upward from the base. At 27 WAP, the oldest non-senescent leaves were again sampled. At 5–17 WAP, a single sample, each combining leaves from three vines, was taken from the central plant in each row of three, including four samples from control plants. At 27 WAP, each plant in each row was sampled, including 12 control plants.
Sampled leaves were washed briefly in running deionized water before drying at 65 °C for 48 h. Subsamples were wet-ashed in 5:1 nitric:perchloric acids before multi-element analysis by inductively coupled plasma atomic emission spectroscopy (ICP-AES). Calcium was found to give a small interference at the Sr wavelength, and Sr concentrations were consequently corrected according to the Ca concentration.
The relationship between [Sr] and [Ca] in control samples was modeled using SigmaPlot version 7, and the model used to calculate expected background [Sr] from sample [Ca]. Statistical analyses were performed using the general linear means procedure (glm) in SAS version 8, on the ratio of observed [Sr] to expected [Sr]. For each sampling date, prediction limits were determined for the control population, indicating 95% probability limit of individual measurements being attributable to background Sr:

where n and s are the sample number and standard deviation, respectively, of the control samples at each sampling date.
Samples with elevated Sr had greater variance than controls, hence treatments were compared using log-transformed data.
RESULTS
Vines emerged within two weeks of planting, but most vines were less than 1.5 m long at 5 WAP. Growth was vigorous up to 20 WAP, but by 27 WAP vines were senescent, with no active tip growth and oldest leaves shed from the lower 1–2 m of vines. Multi-element leaf analyses indicated no nutritional stress in the crop.
Characterization of background Sr concentrations
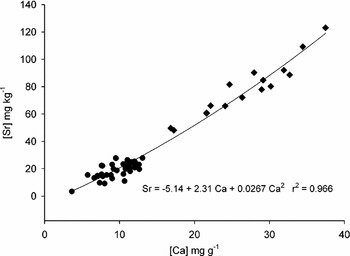
Strontium concentrations varied from 10 to 123 mg kg−1 in leaves from control plants, with young mature leaves averaging 21 mg kg−1 and older leaves averaging 78 mg kg−1. Variability in Ca concentration accounted for a high proportion of the Sr variability in control plants. However, the relationship between Sr and Ca concentrations was not linear, and a simple ratio of [Sr]/[Ca] yielded consistently higher values for older leaves and significant differences among harvest dates. A quadratic model was fitted (Figure 1), and used to estimate the expected background [Sr] (Exp[Sr]) from the [Ca] for each sample. It should be noted that [Sr] was not considered sufficiently high to affect uptake of calcium, being typically around 0.2% of [Ca], and never higher than 5% in response to treatments. Hence, Sr was expressed as a proportional increase over the expected background Sr, i.e.([Sr] −Exp[Sr])/Exp[Sr], or [Sr]/Exp[Sr] − 1. However, to avoid negative numbers, statistical analyses simply used the ratio [Sr]/Exp[Sr]. Expressing Sr data in this way reduced the coefficient of variation within controls to 8.8% compared with 25% for the simple ratio of [Sr]/[Ca], and eliminated statistical differences among sampling times and between old and young leaves.
Relationship between concentrations of Sr and Ca in leaves of control plants exposed only to native soil Sr (n = 52). Data are from young mature leaf samples (●) and older leaf samples (◆) from all sampling dates.

The [Sr]/Exp[Sr] data from treatments were interpreted on the assumption that values above the range attributable to background soil Sr represent significant uptake of the tracer, and therefore indicate the presence of roots of the sampled plant in the vicinity of the tracer placement. Hence 95% prediction limits were determined for the likelihood of individual measurements being attributable to background Sr. In subsequent data presentation, Sr levels above the upper prediction limit are regarded as significantly elevated due to tracer uptake.
Horizontal distance to Sr source
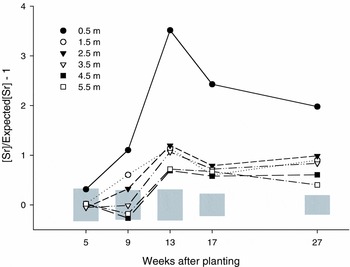
Plants adjacent to the tracer band were the first to show elevated Sr levels, and accumulated considerably higher levels than more distant plants (Figure 2). However, by 13 WAP, plants at the maximum distance of 5.5 m had Sr levels significantly higher than controls, indicating that some roots had reached this distance. At 27 WAP, the Sr concentration in plants at 5.5 m was significantly above background (p = 0.026) but less than that in plants at 1.5–3.5 m.
Elevation in Sr concentration, as a proportion of expected natural concentration, in leaves of yams planted at distances from the Sr source of 0.5 m to 5.5 m, sampled from 5 to 27 weeks after planting. Grey bars indicate the 95% prediction limit of individual measurements resulting from background Sr levels; data points outside grey bars indicate significant (p > 0.95) uptake of tracer Sr.

Depth of Sr source
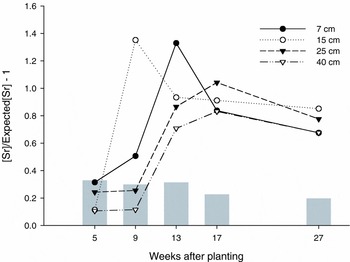
Elevation of leaf Sr due to the tracer was earliest and greatest when placed at 15 cm depth, followed by 7 cm (Figure 3). The 25 cm and 40 cm treatments showed no significant elevation until 13 WAP, but achieved final leaf concentrations not significantly different from those of shallower placements, indicating considerable root activity at these depths.
Elevation in Sr concentration, as a proportion of expected natural concentration, in leaves of yams adjacent to tracer bands placed at 7, 15, 25 and 40 cm depth. Grey bars indicate the 95% prediction limit of individual measurements resulting from background Sr levels; data points outside grey bars indicate significant (p > 0.95) uptake of tracer Sr.

Placement position of Sr source
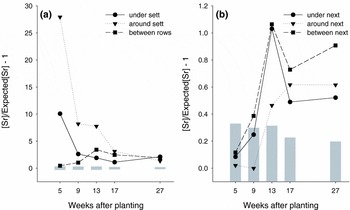
The Sr placement locations mimicked fertilizer placement options used in recent field trials (Melteras, Reference Melteras2005). Placement in a ring around the crown of the sett resulted in greatest uptake during early growth (Figure 4a). Strontium placed below the sett was also accessed during the first month, but to a lesser extent. Both treatments showed a marked decline in leaf concentration at subsequent sampling dates. Placement between the plant rows, 0.5 m distant from the sett, resulted in a small but significant uptake at 5 WAP and a gradual increase to 13 WAP.
Elevation in Sr concentration, as a proportion of expected natural concentration, in leaves of yams in response to tracer placed in each of three fertilizer placement positions, namely under the seed sett, around the crown of the seed sett within the mound, or midway between plant rows. Plants treated (a) are compared with plants adjacent to those treated (b). Grey bars indicate the 95% prediction limit of individual measurements resulting from background Sr levels; data points outside grey bars indicate significant (p > 0.95) uptake of tracer Sr.

Adjacent plants also accessed each placement, but to a significantly smaller extent (Figure 4b). None showed significant elevation of Sr at 5 WAP. In contrast to the treated plants, placement around the sett was accessed slowest by adjacent plants, possibly due to stronger root competition with the treated plant in this zone.
The difference in the y-axis scale between Figure 4a and 4b does not fully reflect the relative contribution of fertilizer uptake from adjacent plants. Quantitative comparison of the treatments requires interpretation of the dose and distribution relative to a fertilizer application in the field, in which each plant or row is similarly treated. With placement under or around the sett, each plant could potentially access fertilizer from each of eight adjacent plants (as well as those at greater distance). The magnitude of fertilizer accessed from adjacent plants would then become greater than that applied to the plant itself. For the ‘between rows’ treatment, it is difficult to compare the dose directly with the other two treatments, as the tracer band effectively treated six adjacent plants, while Sr was applied to only one plant per plot in the ‘under’ and ‘around’ treatments. Although the dose per treated plant was similar (10 g Sr), the total amount of Sr accessible, and the volume of soil in which it could be intercepted, was greater in the ‘between rows’ treatment. The ‘between next row’ plants (1.5 m from the treated band) would only have twice the exposure in a uniform field arrangement as in the single band trial.
DISCUSSION
Strontium proved a very effective and economic tracer in demonstrating the extent of the yam root system. However, variability in Sr concentration in leaf tissue was high, both in response to background Sr levels and to tracer uptake. This paralleled the high variability of Ca, a non-phloem-mobile nutrient, which accumulates progressively with leaf age and varies also in response to other factors affecting the transpiration history of a particular leaf, including recent weather and aspect within the canopy. Previous studies have reported Sr concentrations directly, or as a ratio of Ca concentration (Pinkerton and Simpson, Reference Pinkerton and Simpson1979; Soileau, Reference Soileau1973; Williams and David, Reference Williams and David1963). The need for conversion may depend on the experimental design and the tissue being sampled: whole shoots sampled at one time may show insufficient variability of Ca concentration to gain appreciably from the conversion. However, sampling of selected leaves or at various times will increase Ca variability. In the current study, the observed Sr concentration was expressed as a proportion of that expected on the basis of the empirical relationship between background Sr and Ca concentrations. This yielded a robust parameter eliminating differences due to leaf age and sampling time, and was superior to a simple ratio of Sr to Ca due to the nonlinearity of the relationship for this particular data set.
The reason for nonlinearity is not understood, but differences in Sr/Ca ratio in roots and shoots have been reported for a range of species including pasture and cereal crops (Williams and David, Reference Williams and David1963) and forest trees (Ash Dasch et al., Reference Ash Dasch, Blum, Eagar, Fahey, Driscoll and Siccama1992), indicating a preference for Ca over Sr in transport to the shoot. A higher preference for Ca over Sr in young tissues of low Ca status, compared with more mature tissues, would explain the shape of the relationship observed.
Strontium is presumed to be taken up predominantly by young, unsuberized roots, as is Ca (Pinkerton and Simpson, Reference Pinkerton and Simpson1979; Soileau, Reference Soileau1973). As a consequence, the changes in shoot Sr concentration over time should not be equated with the total root activity in the treated zone. The uptake is likely to be greatest when the roots first reach the treated zone, but to decline as roots in the zone mature. This peak and decline of Sr concentrations is seen in the data presented from the current study. Thus, although Sr concentrations at 27 WAP after planting may have been similar for all depth placements, those which resulted in earlier peaks may in fact correspond to greater nutrient uptake activity across the season. However, in the case of Sr placements close to the sett (either around or below the sett in Figure 4a), the very steep decline in Sr concentration from early to mid season samplings might indicate a paucity of subsequent fine root proliferation in these zones. It should be noted that the vine biomass was small at the first sampling date of 5 WAP, so the high concentration at this time does not correspond to a high uptake, in comparison with samples taken at 13–27 WAP when vine biomass was in the order of 20–50 times greater. To quantify further the pattern of fertilizer uptake activity, tracers such as Rubidium (Rb) or Caesium (Cs) may be more appropriate, although considerably more costly. These are analogues of K, which is absorbed more uniformly by the entire root system. However, Sr was well suited to the purpose of the current study, which was to demonstrate the extent of root distribution.
The recent study of Melteras et al. (Reference Melteras, Lebot, Asher and O'Sullivan2008) reported yam roots (D. esculenta) extending up to 4.5 m from the crown of the plant, substantially increasing earlier estimates of 2.5 m for D. rotundata Njoku et al., (Reference Njoku, Nwoke, Okonkwo and Oyolu1984) and 2 m for D. alata Budelman, (Reference Budelman1990). The current study further increases the reported extent of root reach in yams, to over 5 m. Furthermore, while earlier studies had reported a root depth up to 30 cm (Budelman, Reference Budelman1990; Melteras et al., Reference Melteras, Lebot, Asher and O'Sullivan2008), the current study suggests significant root activity to at least 40 cm. Root depth can be anticipated to depend on soil structure, but most soils suitable for yam tuber development would be likely to pose little impediment to root penetration to 40 cm and beyond. The horizontal growth of roots, which has been observed to occur within the top 10 cm of soil (Budelman, Reference Budelman1990; Melteras et al., Reference Melteras, Lebot, Asher and O'Sullivan2008; Njoku et al., Reference Njoku, Nwoke, Okonkwo and Oyolu1984) would be less sensitive to soil structure.
The rooting pattern of yam species would seem to be exceptional among field crops, but well suited to the yam's natural growing conditions as a vine within tropical forests. Even in their wild state, most yams are propagated from a tuber of the previous season's vine, rather than from seed. Hence, each generation grows in the same position as the last, and their wide-ranging roots may be a strategy to overcome exhaustion of the immediately surrounding soil, and to maximize nutrient capture from leaf litter.
With respect to yam nutrition field trials, the findings indicate that a considerable distance is required to separate fertilizer treatments. Plastic root barriers may be an option in some instances. It remains to be determined whether plots bounded by a plastic barrier would also require a guard row, as plants adjacent to the barrier may be disadvantaged by the lopsided distribution of nutrients available to them. Some investigators have used trenches to separate plots; the effectiveness of this strategy needs further verification. While trenches or root barriers are applicable to trial designs with discrete, randomized treatments, an alternative may be the use of continuous nutrient gradients. Nutrient responses in such trials are assessed by correlation of yield with nutrient availability or application rate across the gradient. There is some evidence that such trials have been successful in demonstrating fertilizer responses in yam (Melteras, Reference Melteras2005; Vander Zaag et al., Reference Vander Zaag, Fox, Kwakye and Obigbesan1980,). However, care needs to be taken in the interpretation of such trials, as the response of a particular plant may be more correctly attributed to the highest application rate within its reach, rather than to the application rate at its planting position.
Strontium placed around the head of the sett resulted in the most rapid and concentrated uptake, as it intercepted new roots radiating horizontally from the crown. This placement may be suitable for fertilizers applied at planting, particularly P. However, as discussed above, the extent of root activity in this zone across the growing season remains to be established. For top dressing of fertilizers such as N and K after crop establishment, this study demonstrated that inter-row application is accessible to the established root system. Inter-row application may be preferable to top-dressing on or around the mound or ridge, both in terms of minimizing damage to roots near their base, and in having a more stable soil moisture regime encouraging more constant root activity. However, Nwinyi and Enwezor (Reference Nwinyi and Enwezor1985) found inter-row application on ridged fields was usually less successful than fertilizer broadcast or banded on ridges, and attributed this to greater leaching or run-off on sandy soils with high rainfall. When fertilization was followed by a dry period, inter-row application yielded higher than other methods. Clearly soil ion exchange capacity, P-fixing capacity and water relations need to be considered in optimizing fertilization strategy, and fertilizer trials are needed to compare application methods for specific soil and climate conditions. However, this study suggests that the mound or ridge should not be seen as the focus of root activity, but more importantly as accommodating tuber development.
Acknowledgements
Thanks are extended to Ms Marie-Vianney Melteras for field and laboratory assistance and to Emeritus Professor Colin Asher for constructive contributions in the preparation of the manuscript.