


Introduction
Jakobshavn Isbræ becomes afloat in Jakobshavn Isfjord at 69° N, 49° W in Disko Bugt, West Greenland (see Fig. 1). It has the fastest sustained ice velocity, moving 7 km a−1 at its terminus for a half-century (Reference BaderBader, 1961; Reference Carbonnell and BauerCarbonnell and Bauer, 1968; Reference Lingle, Hughes and KollmeyerLingle and others, 1981; Reference Echelmeyer, Harrison, Clarke and BensonEchelmeyer and others, 1992; Reference Fahnestock, Bindschadler, Kwok and JezekFahnestock and others, 1993; Reference Fastook, Brecher and HughesFastook and others, 1995). Reference BaderBader (1961) defined “ice stream” as a fast current of ice imbedded in an ice sheet, based on Jakobshavn Isbr×. Reference Carbonnell and BauerCarbonnell and Bauer (1968) made the first use of aerial photogrammetry in glaciology to measure velocities of its floating portion. Reference Lingle, Hughes and KollmeyerLingle and others (1981) made the first measurements of tidal flexure along its grounding lines to study iceberg calving along tidal crevasses. Reference Echelmeyer, Clarke and HarrisonEchelmeyer and others (1991,Reference Echelmeyer, Harrison, Clarke and Benson1992) studied the surface morphology and mass balance, and Reference Fastook, Brecher and HughesFastook and others (1995) photogrammetrically mapped surface elevations and velocities of 10 000 km2 of ice converging on Jakobshavn Isfjord. Reference WongWong and others (1998) used radar sounding to map ice thicknesses over this area. Reference Iken, Echelmeyer, Harrison and FunkIken and others (1993) and Reference Funk, Echelmeyer and IkenFunk and others (1994) measured internal temperatures by thermal drilling into the main trunk of the ice stream, and modeled its dynamics where Reference Clarke and EchelmeyerClarke and Echelmeyer (1989) had measured ice thicknesses along seismic profiles. Reference Echelmeyer and HarrisonEchelmeyer and Harrison (1990) showed that seasonal variations of velocity across the grounding line of the main trunk were not above measurement errors, but tidal variations were, causing the rear grounding line to migrate. Reference ReehReeh (1968) and Reference Fastook and SchmidtFastook and Schmidt (1982) usedJakobshavn Isbræ to study calving caused by arching of floating ice along the calving front in response to the vertical asymmetry of the longitudinal gravitational force. Reference Weidick, Oerter, Reeh, Thomsen and ThoringWeidick and others (1990) showed that the calving front had three episodes of rapid retreat since the Last Glacial Maximum, first in Disko Bugt until 8000 years ago, then during Holocene climate warming until 5000years ago, and in Jakobshavn Isfjord after 1850, when the Little Ice Age ended. Reference BindschadlerBindschadler (1984) and Reference Pelto, Hughes and BrecherPelto and others (1989) estimated the mass balance of the Jakobshavn ice-drainage system in Greenland.
jakobshavn isbr×floating injakobshavn isfjord at 69° n, 49° w,west greenland. photo flight on 24 july 1985 by henderson aerial surveys, inc. surface elevations were contoured at 2 m intervals by kucera international.

Data Presentation
These earlier studies showed that the Jakobshavn ice drainage system was close to mass-balance equilibrium from 1964 to 1996, that Jakobshavn Isfjord continues beneath the main trunk of the ice stream for almost 100 km, that basal ice in the main trunk is sliding and is polythermal ice some 200m thick, that supraglacial lakes in the ablation zone can drain quickly through crevasses, that crevasses prevent surface run-off of summer meltwater, that crevasses become ubiquitous as ice becomes afloat, and that the relation between crevassing and calving is complex. Our study focused on this complex relationship. We densified by six-fold the number of surface elevation and velocity measurements made by Reference Fastook, Brecher and HughesFastook and others (1995) on floating and grounded ice at the head of Jakobshavn Isfjord, obtaining some 500 velocity vectors. These were controlled by fixed targets on the fjord sidewalls that were located by Doppler transit surveys from Earth-orbiting satellites, and triangulated to moving targets (crevasses, seracs, etc.) on the ice that were visible in aerial photographs obtained on 10 and 24 July 1985. The local geoid was represented by an ellipsoid with data collated within a geocentric coordinate system so that our data could be easily correlated with similar data from any other Greenland ice stream. A Lambert conic projection was used for visualizing data in the map plane, with each data point accurate to within 2.0 m horizontally and 3.5 m vertically. Details of these measurement procedures are in Reference PrescottPrescott (1995).
In addition to data collected on moving ice, elevations of ice-polished side-walls were mapped along Jakobshavn Isfjord. As seen in Figure 2, these elevations decrease to sea level downJakobshavn Isfjord over some 35 km, and correlate with retreat of the calving front since 1850, as reported by Reference Carbonnell and BauerCarbonnell and Bauer (1968) and byReference Weidick, Oerter, Reeh, Thomsen and ThoringWeidick and others (1990). The former ice elevations show that in 1850 Jakobshavn Isbræ was grounded in Jakobshavn Isfjord for some 20 km beyond the present-day grounding line, assuming that the fjord is not deeper than 1000–1500 m below sea level over this distance, as reported by Reference Echelmeyer, Clarke and HarrisonEchelmeyer and others (1991). Therefore, retreat of the calving front was accompanied by upslope ice thinning.
Thinning retreat of Jakobshavn Isbræ since the Little based Age in Greenland. Top: ice surface elevations in 1850 (?) 19 95). on the upper limit of glacially polished bedrock (Prescott, Bottom: retreat of the calving front, 1850–1964 (Reference Carbonnell and BauerCarbonnell and Bauer, 1968).

Surface elevations of floating and grounded ice at the head of Jakobshavn Isfjord are shown in Figure 3. The main trunk ofJakobshavn Isbræ curves into the fjord just south of a major icefall. A secondary and much shorter current of ice enters the fjord just north of the icefall. The two currents of ice meet at the base of the icefall, where several major longitudinal crevasses open and continue to the calving front, a distance of 10 km. These crevasses are collectively called the Zipper, because they seem to connect the two currents of ice. Floating ice is about 10m lower in elevation north of the Zipper. South of the Zipper, the thicker ice spills over the lower south fjord side-wall and forms a grounded ice lobe in compressive flow that generates concentric folds along the lobe margin, except along a small stream-fed ice-dammed lake, where a calving ice wall develops. A local ice dome 20 m higher than surrounding ice is about 3 km behind the calving front on the south side. A supraglacial lake covers thin ice at the base of the icefall just north of the Zipper, indicating that thin ice pours over a bedrock hill at the head of the fjord, to produce the icefall. Ice-surface slopes increase sharply beyond the rear grounding line of floating ice, indicating substantial ice–bed coupling.
Surface elevations on Jakobshavn Isbræ contoured at 5 m intervals above the OSU91A1F geoid (Prescott, 19 line is the tentative grounding line. The long rectangle encloses crevasses in the Zipper.

Surface velocities of floating and grounded ice at the head of Jakobshavn Isfjord are shown in Figure 4.Velocity vectors show that flow from the main trunk of Jakobshavn Isbræ crosses the Zipper, and supplies some 80% of ice at the north–south calving front. Velocity vectors also show that much of the ice spilling over the south fjord wall from the main-trunk ice stream curves back into the fjord and calves along an east–west calving front, instead of melting on land. Therefore, longitudinal crevasses in the Zipperare opened by transverse extension as thick trunk ice pinches out thinner ice to the north and spills over the fjord wall to the south. The current of ice entering Jakobshavn Isbræ north of the icefall is not a true ice stream; rather, it is ice drawn into the fjord by faster ice in the main-trunk ice stream. This induced flow seems to generate an anticlockwise swirl of velocity vectors just below the accuracy of measurement in ice entering the fjord from the north. These ice velocities, ice velocities over the icefall, and ice velocities in the ice lobe are all small compared to the velocities in the main-trunk ice stream and of floating ice. Velocity vectors pass over, and partly around, a local ice dome just behind the south side of the calving front, indicating that the dome results from weakly grounded ice that creates ice rumples, not an ice rise. Contoured isopleths of ice velocity in Figure 5 show that ice velocity peaks at 7 kma−1 as it crosses the rear grounding line of the main-trunk ice stream, slows slightly, and peaks again at 7 kma−1 near the calving front. This suggests other partial grounding sites in the fjord in addition to the ice rumples. Strong lateral velocity gradients and shear crevasses rotated to longitudinal orientations a long both fjord side-walls do not extend into the main-trunk flow of floating ice. This indicates partial lateral uncoupling of ice from fjord side-walls, possibly due to tidal flexure concentrated along these crevasses, as analyzed by Reference Lingle, Hughes and KollmeyerLingle and others (1981).
Surface velocity vectors of floating and grounded ice at the head of jakobshavn isfjord (prescott, 19 95). velocities range over three orders of magnitude, so slow velocities are only points inside arrowheads.

Isopleths of surface velocities contoured at 0.5 km a–1 intervals at the head of jakobshavn isfjord (Reference PrescottPrescott, 1995).

Data Analysis
The major assumption controlling analysis of our data is that rotation rates and strain rates have comparable magnitudes in heavily crevassed floating ice having horizontal dimensions an order of magnitude greater than the vertical thickness (Reference TruesdaleTruesdale, 1952). These are the conditions for nonlinear strain (Reference LoveLove, 1927, p. 59; Reference Novozhilov, Bagemihl, Komm and SeidelNovozhilov, 1953; Reference SokolnikoffSokolnikoff, 1956, p. 28). Displacements ui of points initially at positions xi give new positions:

Differentiating for infinitesimal displacements:

where δ ij is the Kronecker delta, such that δ ij = 1 for longitudinal displacements i = j and δ ij = 0 for transverse displacements i ≠ j, ui,j ∂ui/∂xj when i,j = x1,x2,x3 and uij = ∂ui/∂j when i,j x,y,z, ei j =1/2(uij + uji) are linear strain components, and ω i j = 1/2(uij - uj,i) are angular rotation components.
Forming the squares of the distances between the points M and N before deformation and between M’ and N’ after deformation gives the following:

Taking the difference of the distance squares and using Equation (1) produces:

where εij are the non-linear (also known as the Cauchy– Green or finite) strain components defined by:

Using Equation (2), Equation (4) can also be defined in terms of the linear strains:

Thus the relation between the linear and non-linear strain components is:

From Equation (7) it can be seen that the non-linear strain includes the second-order products between the linear strains and rotations.
Principal strain rates give the largest values of the normal strain-rate components. Assuming that surface strain rates do not vary through the floating ice thickness, the linear and non-linear principal strain rates were computed using the standard relation (Reference Chou and PaganoChou and Pagano, 1967, p. 10). In terms of east–west and north–south axes x and y, respectively parallel and transverse to Jakobshavn Isfjord, the maximum non-linear normal strain rates are:


Instead of computing the rotational angle associated with the principal strain rates, which is coordinate-system dependent, the value of maximum non-linear shear strain rate was computed:

For linear strain rates, replace 1
 with
 in Equations (8) and (9). From the non-linear 4 adjustment, the standard deviations for the velocity gradients were computed and then using the law of variance–covariancepropagation(e.g. Reference Leick and HumphreyLeick and Humphrey, 1981, p. 102), the standard deviations for the principal strain rates and maximum shear strain rate were computed. The relation between the standard deviations for the velocity gradients and those for the principal strain rates is:

where
 is the variance–covariance matrix of ui,j
 i is the square of the standard deviations for the principal strains, and is the vector describing the linear relation Gi
is the vector describing the linear relationship between
 and
 and The subscripts i and j range over the number of parameters in ∑y and in the variance–covariance matrix, respectively. See Reference PrescottPrescott (1995) for further details.
Figure 6 shows a mesh of 399 quadrilateral elements that was created from the measured point locationson Jakobshavn Isbræ to compute the linear and non-linear strain rates. For the majority of the elements, the measured displacements served as the corners.
A mesh of quadrilateral elements created from point locations on Jakobshavn Isbr×. Top: the complete mesh. Bottom: the part of the mesh inside the bold border showing the percentage difference between computed linear and non-linear strain rates for each element.

As discussed in detail by Reference PrescottPrescott (1995), the data were made more robust using the following technique. The error estimates for each observation are changed after each iteration so that they are proportional to the computed residuals (Reference Leick and HumphreyLeick and Humphrey, 1981). In this case, the weights were set to the inverse of the square of the residuals. This procedure produced the percentage errors of the minimum strain rate, the minimum shear rate and the second invariant (7%,8% and 17%).
A comparison was made between the linear and nonlinear strain rates by calculating percentage differences for the strain rates in the local coordinate system, the principal strain rates and maximum shear rate, and the second invariant. Although the majority of the principal strain rates and maximum shear rates agree to within 10%, there still are about one-third of the data that differ by 420%.The difference between the second invariants is somewhat worse, with less than half of the data agreeing to within 10%, and 38% differing by 4 2 0 % . For the local coordinate-system strain-rate components, the comparison is worse. The most noticeable difference is in the transverse y component, where 30% of the data differ by 450%.This larger difference is probably due to the x-coordinate axis approximately corresponding to the flow direction, so that the magnitudes of the y-component strain rates are much smaller. However, based on the statistical methods outlined above, the y-component strain rates should be considered valid.
In general, it appears that the maximum shear rate and the local shear rate give the best agreement between the linear and non-linear forms. If this is indeed true, then certain inferences can be drawn about the data. Rewriting Equation (7) for the two-dimensional case gives:



Strain rates are obtained from the strains in Equations (11) by dividing the strains by the time during which strains were measured. Equations (11) then show that the invalidity of the linear form for the normal strain rates could be due to the square of the normal strain rate not being small compared to unity, and/or the square of the rotation rate
 not being small compared to the normal strain-rate component.
Results
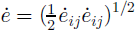
The data analysis showed that non-linear strain theory was preferable to linear strain theory in accounting for deformation of the floating part of Jakobshavn Isbræ. Figure 6 shows the percentage difference per element between the second invariants of strain rate,
 for linear strain rates and
 for non-linear strain rates. These differences are greatest where crevassing is greatest, namely, along the Zipper and in the lateral shear zones, indicating a concentration of rotated elements where ice is most fractured.
Figure 7 shows non-linear principal strain rates obtained from the mesh of quadrilateral elements in Figure 6. Since corners of elements typically coincide with corners of prominent crevasses, each element may be a discrete parcel of ice within which deformation may be largely homogeneous, with inhomogenities concentrated between elements. Principal strain rates confirm transverse extension across the Zipper as the explanation for opening longitudinal crevasses along the Zipper, and confirm sub-longitudinal compression in ice approaching the ice rumples as an explanation for little velocity change from the rear grounding line to the calving front. Simple shear, consisting of equal parts pure shear and rigid rotation, dominates in floating ice north of the Zipper and between the south grounded ice lobe and the main floating trunk of the ice stream. Pure linear extension, coinciding with release of the largest icebergs, occurs between the Zipper and the ice rumples.
Non-linear principal strain rates computed for each element of the mesh generated from point measurements of surface velocity on Jakobshavn Isbræ (Reference PrescottPrescott, 1995).

Figure 8 shows isopleth contours for non-linear strain rates
 parallel to flow and
 transverse to flow. These show strong extending and compressive flow beyond and behind the ice rumples, respectively, combined with transverse extension behind the ice rumples. This indicates a tendency for ice to flow around the ice rumples as well as across the ice rumples. Therefore ice grounding beneath the ice rumples is firm enough to give the ice rumples some characteristics of an ice rise. Closed strain-rate isopleths scattered over the floating ice give hints of partial grounding elsewhere. Longitudinal strain rates are compressive below the icefall, tensile near the calving front, and close to zero in between. Transverse strain rates become increasingly tensile toward the icefall. This is compatible with the general absence of large transverse crevasses and the prominent longitudinal crevasses (the Zipper) in this region. The near-zero longitudinal strain rate
 and the average extending transverse strain rate
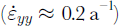 s over most of the region from the grounding line to the calving front allows a calculation of ice thinning over this 10 km distance due to ice melting on the top and bottom surfaces. Taking 50 m as the elevation change in Figure 3 and 6.8 km a−1 as the ice velocity in Figure 4, with ice thickness as 9.2 times ice elevation (Reference Echelmeyer, Clarke and HarrisonEchelmeyer and others, 1991), and taking
 as the vertical thinning creep rate, ice 1012 m thick (110 m high) at the rear grounding line thins by 202 ma−1 and is 300m thinner at the calving front due to creep thinning. The actual thinning is 460 m, which requires a net melting rate of 109ma–1. This compares with 44ma–1 beneath the floating part of Pine Island Glacier in Antarctica (Reference Rignot and JacobsRignot and Jacobs, 2002).

Discussion
Non-linear strain rates are concentrated in the most heavily crevassed ice, indicating that the assumptions of continuum mechanics break down in these regions. Longitudinal crevasses in the Zipper are opened by transverse extension. Floating ice moves with little longitudinal deformation between the icefall and the calving front. Ice north of the icefall is drawn into Jakobshavn Isfjord by fast flow in the main trunk ofJakobshavn Isbræ. Flow from the main trunk occurs along 80% of the north–south calving front. The position of the calving front is stabilized by ice rumples south of the Zipper, and perhaps by other partial grounding elsewhere. Tidal crevasses and rotated shear crevasses significantly decouple ice in the main trunk from the fjord sidewalls. Large tabular icebergs are released primarily along the narrow zone of pure longitudinal extension between the Zipper and the ice rumples. The size of tabular icebergs may be determined by the spacing of large transverse crevasses that open as the main-trunk ice stream crosses the rear grounding line, where ice accelerates and is bent by tidal flexure, as these crevasses are transported passively to the calving front. Melting of floating ice on the top and bottom surfaces is an important ablation process. In the main trunk of floating ice, 10 km long, 3 km wide, and averaging 550 m thick along the calving front, 3.3 km3 a–1 of ice are lost by melting, and 11.2 km3 a–1 are lost by calving.
Acknowledgements
This work was funded by the U.S. National Science Foundation, Office of Polar Programs. We thank J. Fastook for assisting us with the computer graphics used to produce our figures. We also thank three referees for valuable criticisms and suggestions.



