Introduction
To date, the surface mass balance used to drive most dynamic ice-sheet models has been obtained from present-day observations, empirically based parameterizations, or simple energy-balance climate models (e.g. Reference Huybrechts and OerlemansHuybrechts and Oerlemans, 1990; Reference Peltier and MarshallPeltier and Marshall, 1995). Three-dimensional (3-D) global climate models (GCMs) are another possible source of this forcing information, and the only one with the potential to predict past or future changes due to variations in storm tracks, surface wind speeds, cloudiness and other variables that depend on 3-D atmospheric dynamies.
However there are two serious problems in attempting to predict mass balances on ice-sheet surfaces from GCM simulations, and one issue of a more pragmatic nature:
-
Dynamic ice-sheet models require horizontal resolutions of < 50 100 km properly to resolve steep slopes near the ice-sheet edge, and small-scale topographic features such as highlands important for ice-sheet initiation. In contrast, the finest horizontal resolution of atmospheric GCMs that is currently feasible for multi-decadal simulations is ˜250 km. Moreover, the spectral truncation of topography in medium-resolution spectral GCMs causes a spurious lowering of relatively small-scale features such as the Greenland plateau by about 500 m. As a result the simulated mass balance over Greenland and paleo-ice sheets has often been much too negative (Reference RindRind, 1987; Reference Broccoli, Manabe and PeltierBroccoli and Manabe, 1993).
-
The snow and ice physics in most GCMs does not include important ice-sheet-specific processes such as the refreezing of meltwater, which does not contribute to the overall mass balance.
-
Most experiments involving ice-sheet evolution require that the dynamic ice-sheet model be integrated for several thousand years at least, whereas the longest feasible integration of a GCM for a particular experiment is generally a few decades.
In this paper we describe techniques that address these problems, and illustrate their use in a coupled GCM ice-sheet simulation of Laurentide ice sheet initiation at the end of the last interglaciation at ˜116 000 years ago (henceforth 116 ka BP). The GCM used is a new medium-resolution version of the GENESIS (Global ENvironmental and Ecological Simulation of Interactive Systems) global climate model, which incorporates the techniques described below and yields realistic mass balance over present-day Greenland and Antaretica (Reference Thompson and PollardThompson and Pollard. 1997a). The application to ice-sheet initiation is a good testbed for the scaling technique, since the Laurentide is thought to have originated on high, but relatively small, plateaus on Baffin Island, Labrador and Keewatin, which are not resolved at all by the GCM topography.
Verbitsky and Oglesby (Reference Verbitsky and Oglesby1992, Reference Verbitsky and Oglesby1995), Reference Schlesinger and VerbitskySchlesinger and Verbitsky (1996) and Reference Verbitsky and SaltzmanVerbitsky and Saltzman (1995) have broken new ground in coupling GCMs with a dynamic ice-sheet model. In the first three papers, the GCM and ice-sheet models both used coarse horizontal resolutions (4.5° × 7.5° or 4° × 5°). In Reference Verbitsky and SaltzmanVerbitsky and Saltzman (1995) a high-resolution (40 km) ice-sheet model was used; however, the surface mass-balance forcing signal due to increased CO2 was scaled drastically to compensate for the GCM's several-fold overprediction of present-day Antarctie precipitation, and computed on the coarse GCM grid and used without accounting for the scale or refreezing problems mentioned above. In a sense our work complements these papers by suggesting techniques to improve the coupling between GCMs and ice sheets.
In the following section we describe briefly the GCM, the techniques that address the problems listed above, and the dynamic ice-sheet model itself. Then the results of the initiation experiment at 116 ka BP are presented. As shown below, the model predicts rapid growth of a large ice sheet over the northern Rockies in Alaska and western Canada, and much slower growth over Baffin Island and the Canadian Archipelago, in contradiction with the geologic evidence of rapid growth over the latter and no initial growth over Alaska or western Canada. In the last section we discuss possible reasons for the discrepancy, including an extension of the coupling technique to account for sub-grid topographic relief.
Description of Models and Coupling Strategy
GCM
The GCM used here is version 2.0a of GENESIS (hereafter abbreviated to version 2). It has been developed at NCAR with emphasis on terrestrial, biophysical and cryospheric processes, for the purpose of the performing greenhouse and paleoclimatic experiments. An earlier version (1.02) of the model with coarser atmospheric resolution has been described in Thompson and Pollard (Reference Thompson and Pollard1995a, Reference Thompson and Pollardb) and Pollard and Thompson (Reference Pollard and Thompson1994, Reference Pollard and Thompson1995). Present-day results with version 2 are significantly improved over version 1.02, and the new physics in version 2 and its present-day climate including Greenland and Antarctic mass balance is described in Reference Thompson and PollardThompson and Pollard (1997a). For brevity, only a few basic features of the model are mentioned here; more complete descriptions are given in the above references, and a short outline is included in Reference Thompson and PollardThompson and Pollard (1997b).
The standard version-2 model consists of an atmospheric GCM (AGCM) coupled to multi-layer models of vegetation, soil or land ice, and snow. Sea-surface temperatures (SSTs) and sea ice are computed using a 50 m slab oceanic layer, and a dynamic sea-ice model. The AGCM grid is independent of the surface grid; the nominal AGCM resolution is spectral T31 (˜3.75° × 3.75°) with 18 vertical levels, and the surface model's grid is 2° × 2°, with an overall GCM time-step of 0.5 hours. These resolutions were used for the GCM experiments described below. For the land-surface model, present-day vegetation attributes such as leaf-area indices, fractional cover, leaf albedos, etc., are prescribed from off-line results of a predictive natural-vegetation model (the EVE model; personal communication from J. Bergengren, 1996). The EVE model can also be run interactively, with the global vegetation distributions recomputed once each year using the previous year's GCM climate (experiment minus control). This capability has been used for the 116 ka BP experiment below to allow climate-vegetation interactions thought to be important at that time (Reference Gallimore and KutzbachGallimore and Kutzbach, 1996).
Correction for ice-sheet elevation
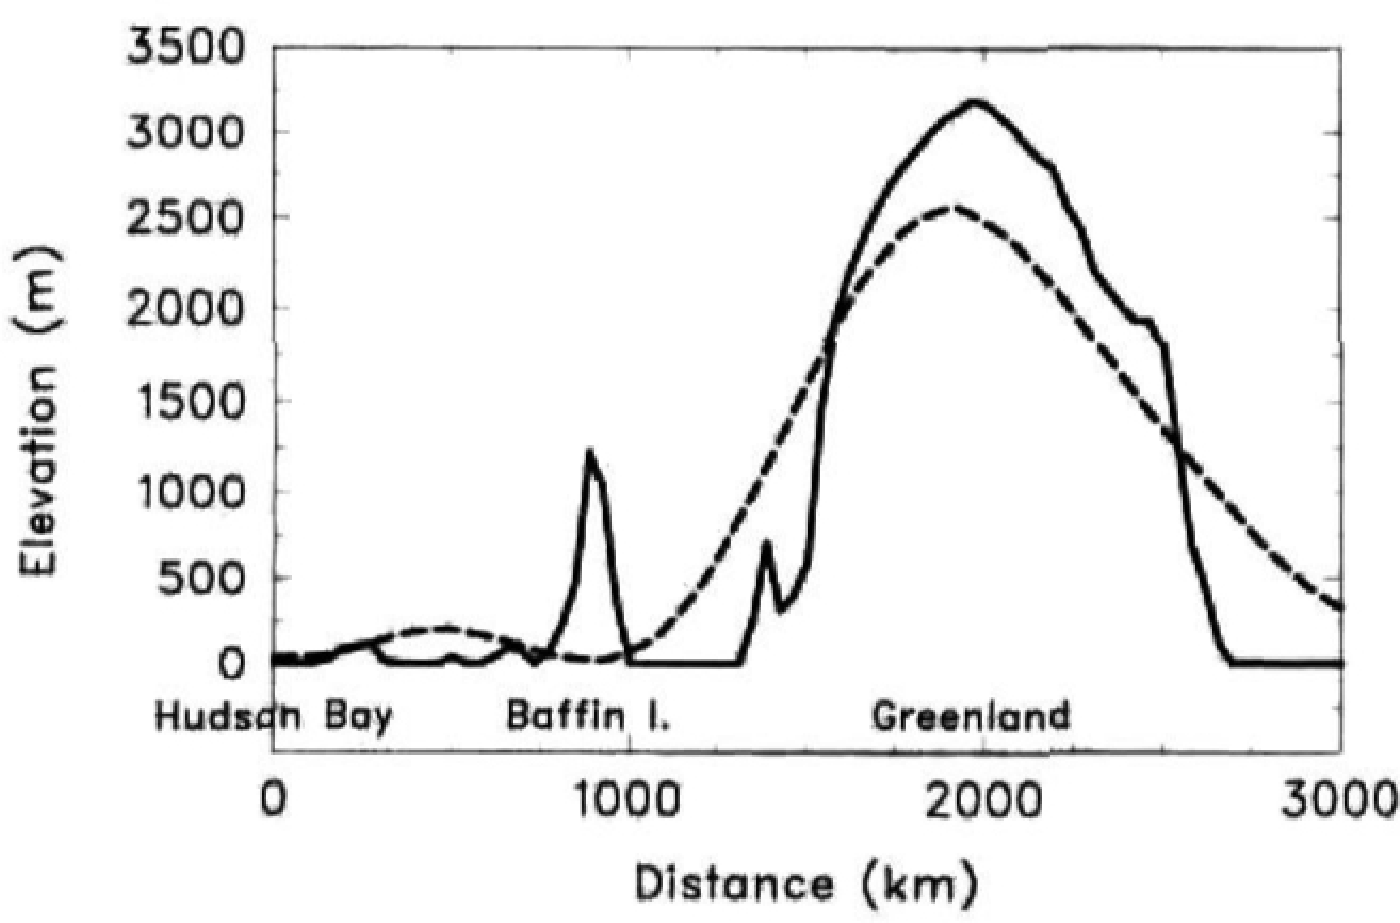
In order to drive an ice-sheet model, the annual mass balance simulated at each ice gridpoint by the GCM should be realistic. This is hampered by the coarse horizontal resolution of most AGCMs (typically a few hundred kilometers) and the consequent inability of the AGCM to resolve fine-scale vertical relief. For instance, in medium-resolution spectral GCMs, such as ours, the high plateaus on Baffin Island are completely absent, and the central Greenland plateau is truncated by more than 500m (Fig. 1), which translate into surface-air temperature errors that overwhelm predicted rates of summer ice melt. This problem is addressed in version 2 by adjusting the AGCM meteorological fields passed to the surface physics module at each time-step to account for the known topographic error. First, the AGCM lowest-level fields (air temperature, wind speed, specific humidity, incident radiation and precipitation) are horizontally interpolated to the finer surface-model grid. Secondly, the temperature, humidity and incoming infrared radiation are corrected for the error between the AGCM spectrally truncated topography and the true topography on the surface grid, using simple adjustments based on a constant lapse rate of −7.0°C km−1. The adjusted atmospheric values are used to force the snow and ice surface-column physics on existing or potential ice-sheet surfaces. This procedure is described in detail in Thompson and Pollard (1997).
Cross section of present-day elevations above mean sea level, running linearly (roughly east-northeast) from Hudson Bay (63° N, 90° W) to the north Greenland Sea (78° N, 10° W), passing close to the highest region on Baffin Island (Penny Highland) and the Greenland summit. This transect is shown as a straight line in Figure 2a. Solid line: realistic 10 min topography (Reference Cuming and HawkinsCuming and Hawkins, 1981; Reference KinemanKineman, 1985) averaged to our 0.5 × 0.5 resolution. Dashed line: spectrally truncated T31 topography used by our AGCM.

Correction for refreezing of meltwater
In most GCMs any snowmelt or icemelt on ice sheets is immediately removed from each gridbox and considered "runoff"; (some GCMs then return it to the oceans via a riverrouting scheme). However, it has long been recognized that local snowmelt and icemelt does not immediately leave an ice sheet. In order to do so, the local melt would first have to (1) percolate through underlying snow, (2) join a surface stream and flow 10s to 100s of km to the ice-sheet edge, or (3) flow down a moulin into the englacial drainage system and then to the edge. Instead, much of the surface melt refreezes, especially in step (1), and so does not constitute a loss to the current year's not mass budget. Relatively little is known about the extent of refreezing in steps (2) and (3), but considerable data and modeling work are available concerning (1). To first order (Reference Pfeffer, Meier and IllangasckarePfeffer and others, 1991), the snow melt in the ablation zone in early summer is not mobile, and refreezes locally in the previous winter's snowpack above the impermeable ice horizon left from the previous fall. This starts to warm and saturate the snowpack. Only after the snowpack has been warmed to melting point, and is nearly 100% saturated, is most of it mobile enough to join a surface stream and/or sub-surface drainage, system and travel long distances.
We have adopted the simple parameterization of Reference Pfeffer, Meier and IllangasckarePfeffer and others (1991), which expresses the amount of local refreezing in terms of local annual winter snowfall and total summer surface melt. The annual mass balance B at each gridpoint is given by:

where S is the annual snowfall, R is the annual rainfall, E is the annual evaporation, and M is the annual snowmelt plus icemelt plus rainfall on bare ice. (In our GCM, rain falling on snow immediately freezes into the snowpack, and rain falling on bare ice becomes local runoff). In Equation (1), v is the fraction of the snowmelt/icemelt/rain that escapes the ice sheet without refreezing, given by

where max [x; y] (or min[x; y]) means the greater (or lesser) of x and y. This basically follows equation (A2) of Reference Pfeffer, Meier and IllangasckarePfeffer and others (1991), with the non-dimensional ratio 0.7 representing their typical values for snow density and winter temperature (the latter is not important since the saturation requirement dominates that of warming the snow). If the denominator 0.3 in Equation (2) is reduced towards zero, the equation becomes exactly the condition for runoff described by Reference Pfeffer, Meier and IllangasckarePfeffer and others (1991); however by using the value 0.3 we have smoothed the transition to allow for horizontal heterogeneity within a gridbox, grading from 0% high in the accumulation zone where no melt becomes mobile (above the "runoff limit" of Reference Pfeffer, Meier and IllangasckarePfeffer and others (1991)), to 100% lower in the ablation zone, where all snowmelt and icemelt eventually becomes mobile. The quantities S, R, M and E are stored for each surface model gridpoint on the GCM history files produced for each year's simulation, and the correction for refreezing is applied a posteriori after the GCM run is completed. It would, of course, be preferable to apply a model of the refreezing process at each GCM time-step as part of the on-line model physics; logically, this would require the inclusion of moisture percolation and snow compactness in our GCM snow model, a process that is planned for future research.
Dynamic ice-sheet model
To simulate ice-sheet evolution over thousands of years, we employ a standard two-dimensional (2-D) model of ice dynamics and bedrock response with a horizontal resolution of 0.5° × 0.5°. The coupling to the GCM is described in the next subsection. The dynamic ice equation is derived from the vertically integrated continuity equation for ice mass, assuming the ice sheet deforms mainly by shear at or near the base under its own weight, and neglecting temperature effects and basal surging (e.g. Reference PatersonPaterson, 1981; Reference Peltier and MarshallPeltier and Marshall, 1995).

where h(x, y, t) is the ice thickness, h b(x, y, t) is the bedrock elevation above sea level, m = 3, A = 2.0 m−2 a−1, and B(x, y, t) is the surface mass balance in m a−1 calculated by the GCM. Ice shelves are neglected in the current model, and h is set to zero over all ocean points.
The depression or uplift of the underlying bedrock is simply a local relaxation to isostatic equilibrium, lagged by 3000 years (e.g. Reference Peltier and MarshallPeltier and Marshall, 1995):

where h b eq is the ice-free equilibrium bedrock elevation a.s.l., τ = 3000 a, ρ i = 920 kg m−3 is the ice density, and ρ e = 3300 kg m−3 is the bedrock density.
Due to the highly non-linear terms in Equation (3), time-implicit numerical methods are required for stability as the equation is marched forward. We use an alternating direction implicit (ADI) scheme (Reference MahaffyMahaffy, 1976), and for each horizontal dimension in turn we use a tridiagonal Newton-Raphson scheme with implicit contributions from every term involving h. Equations (3) and (4) are solved on a regular 0.5 × 0.5° latitude–longitude grid, with a time-step of 5 years.
Asynchronous coupling
To estimate the total mass balance on prescribed major ice sheets, the GCM's surface-model 2° × 2° grid is adequate (Reference Thompson and PollardThompson and Pollard, 1997a, Reference Thompson and Pollardb). However, as mentioned above, a finer surface resolution (here 0.5° × 0.5°) is needed adequately to represent ice dynamics and fine-scale topography such as the Baffin Island highlands. It is not yet computationally feasible to reduce our GCM surface-model grid that much, so we must first run the GCM while storing the required AGCM meteorological fields at T31 resolution, and then separately run a snow- and ice-surface model and the dynamic ice-sheet model, interpolating the AGCM T31 fields to the 0.5° × 0.5° grid and applying the elevation and refreezing corrections.
In principle, it would be possible to save the required AGCM fields every few hours through an entire GCM integration of ˜10 equilibrated years, which would preserve diurnal cycles and intra- and inter-annual variability. However, that would use very large amounts of disk space, and, for the application described below, we stored only the ensemble monthly means over a 10 year GCM integration, and added a synthetic diurnal cycle to drive the snow/ice-surface model. The steps of the whole procedure are as follows:
-
Run the GCM for at least ˜10 equilibrated years at T31 (3.75° × 3.75°) AGCM and 2° × 2° surface resolutions, with ice sheets and bedrock prescribed at their current elevations. Store monthly means of the lowest-level (˜50 m) AGCM fields needed for snow/ice-surface physics (air temperature, specific humidity, wind speed, cloudiness, rainfall, snowfall, downward incident solar and infrared radiation, surface pressure and T31-truncated surface elevation), averaged over the last 10 years of the integration.
-
Using the stored monthly mean AGCM fields, run a multi-layer snow/ice-sheet surface-column model at each point on the 0.5 × 0.5 dynamic ice-sheet grid, through several here 1 years until a repeated annual cycle of surface melt is reached. Exactly the same snow/ice-surface model code is used as in the GCM with the same 0.5 hour time-step, and the same constant-flux boundary-layer formulation is used to predict sensible and latent heat fluxes at the surface. At each 0.5 hour time-step, (i) interpolate the monthly mean T31 AGCM fields linearly in time between the two surrounding mid-month points, (ii) interpolate these T31 fields bi-linearly in space to 0.5 × 0.5, (iii) perform the elevation correction described above to account for the difference between the realistic 0.5 × 0.5 elevation, and the T31 elevation interpolated to 0.5 × 0.5, and (iv) add simple synthetic diurnal cycles to air temperature and incoming solar radiation. For the last of the 4 years, accumulate the annual mean snowfall, rainfall, local melt and evaporation, and apply the refreezing correction (Equations (1) and (2), to obtain the annual mass balance at each 0.5 × 0.5 grid-point. This is done both for existing ice points and for "potential" ice points that may become ice covered in step (3), due either to positive local accumulation or to ice flow from nearby ice-sheet points (see below).
-
Using the predicted annual surface mass-balance field, run the dynamic ice sheets and bedrock (Equations (3) and (4)) through several hundred (here 500) years. After that time, changes in air temperature due to changing ice-sheet surface elevations can be significant, so repeat step (2) including the 4 year spin-up of the snow/ice-surface model with updated surface elevations (h + h b ) to compute a new mass-balance field.
-
Repeat the cycle of steps (2) and (3) many here 20) times to integrate the dynamic ice sheets and bedrock through several thousand (here 10 000) years with invariant GCM climate.
-
In a long-term asynchronous simulation of climate and ice-sheet evolution over 101 103 a, the changing ice-sheet size and the Earth's orbital parameters themselves would significantly alter the climate. Thus step (1) would be repeated at intervals of several thousand years with the GCM's prescribed ice-sheet mask and surface topography updated to reflect the current state of the dynamic ice sheets and bedrock. (Reference Pollard, Muszynski, Schneider and ThompsonPollard and others, 1990). However in the application below we have essentially performed only the first step in such an integration, and have stopped the simulation after 10 000 years without re-running the GCM.
Apart from the GCM integration, step (2) uses by far the most computer time. Consequently, for the application described below, we did not run the snow/ice-surface model on a global 0.5 × 0.5 grid, but only over the domain of interest (North America above 50 N). And, within that domain, we perform step (2) only for those 0.5 × 0.5 points where an updated mass balance is absolutely necessary (i.e, all points for the first iteration, and subsequently only those points where elevations have changed by more than 10m since the previous iteration, or which are within 200 km of an existing ice-sheet point and so might become ice covered during step (3) due to ice-sheet flow.
Application at 116 ka BP
Background
At the end of the last interglaciation about 120–115 ka BP the global ice volume deduced from δ18O deep-sea core and sea-level records suddenly began to increase. The rate of ice growth over the next 10 000 years was very rapid, corresponding to a global sea-level drop of about 50m (e.g. Shackleton, 1987). During that time the Earth's orbit was particularly conducive to cold Northern Hemispherie summers and ice growth, with a minimum in summer half-year insolation at northern mid-latitudes at 116 ka BP. Terrestrial geologie evidence points to initial growth in the first ˜5000 years of small ice caps on the highlands of Baffin Island. Labrador. Keewatin and Victoria Island see figure 4 in Vincent and Prest, 1987; Reference ClarkClark and others, 1993), which merged to form an early Laurentide ice sheet covering northeastern Canada after about 10 000 years. For convenience the locations of these sites and others mentioned below, and the present-day topography, are shown in Figure 2.
(a) Approximate locations of place names mentioned in the text. A, Axel Heiberg Island; Ba, Barnes Ice Cap (Baffin Island); Bp, Penny Highland and Ice Cap (Baffin Island): By. Bylot Island; BI, Banks Island; BR, Brooks Range; D, Devan Island; E, Ellesmere Island; K, Keewatin; L. Labrador: S. Saint Elias Range; V. Victoria Island. The straight line shows the transect plotted in Figure 1. (b) Present-day elevations above mean sea level, in meters, averaged to 0.5 × 0.5 resolution. Greenland is masked out in these and subsequent figures for reasons given in the text.

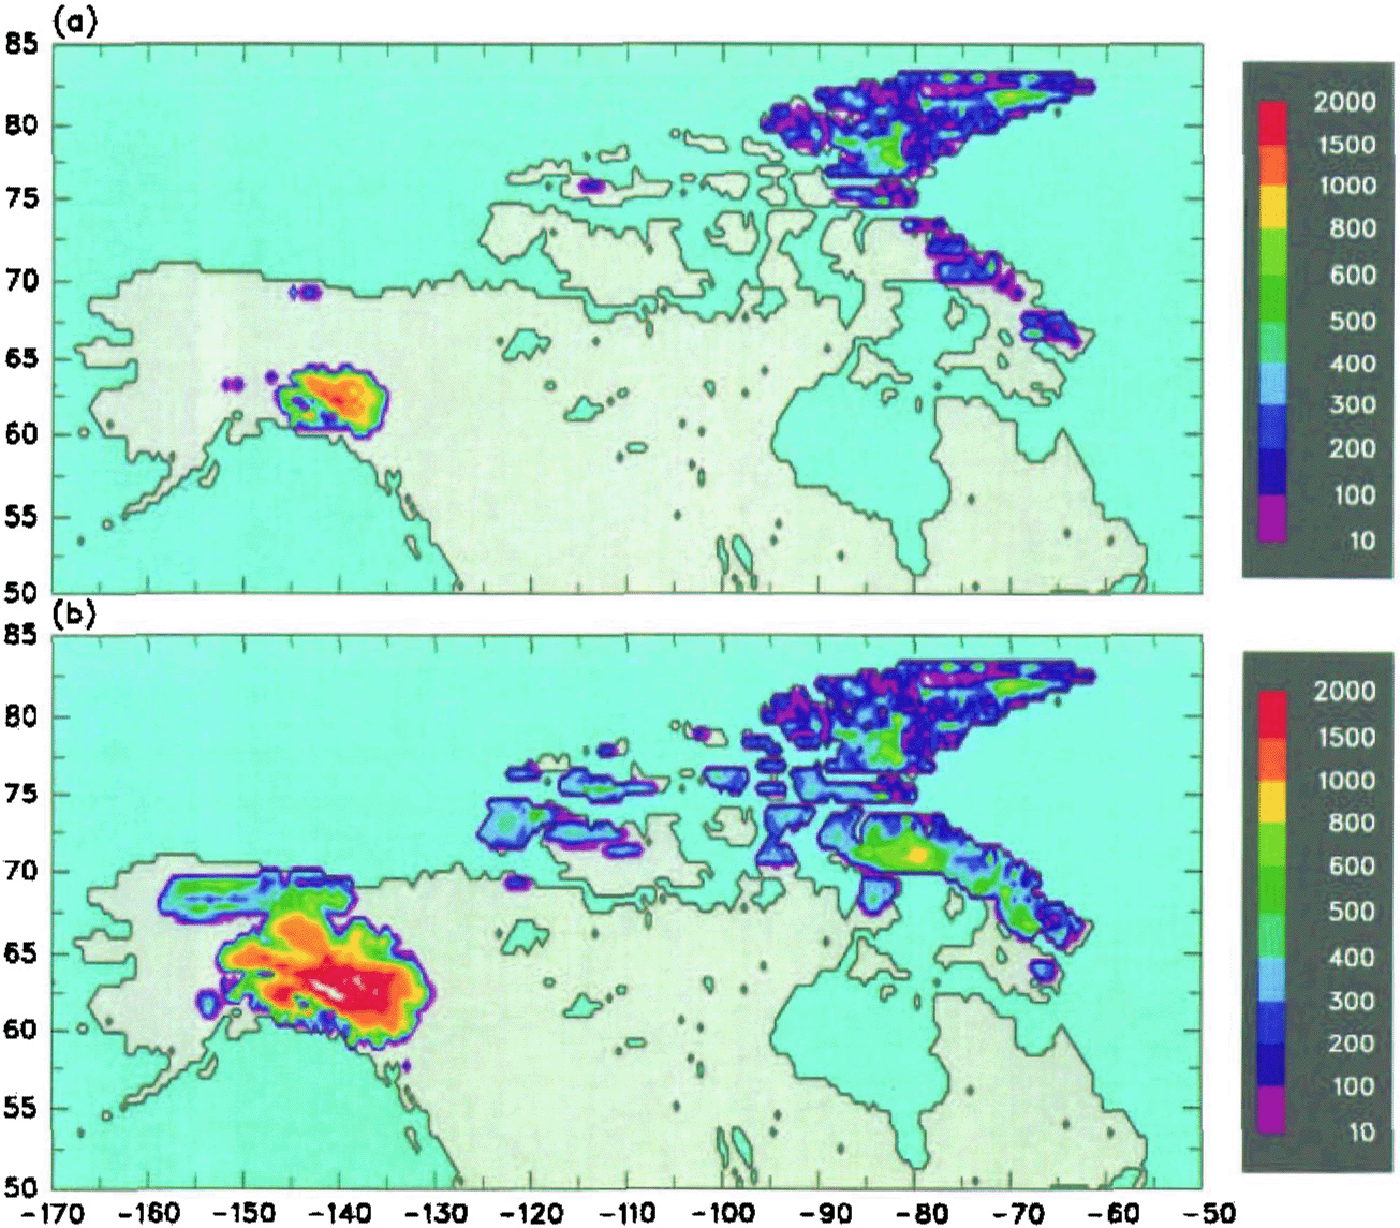
Ice-sheet thickness in meters, predicted over North America after a 10 000 year integration of the dynamic ice model forced by AGCM climate. (a) Present day. (b) 116 ka BP.

Early GCM modeling attempts to simulate this initiation were unsuccessful (e.g. Reference Rind, Peteet and KuklaRind and others, 1989). The first GCM experiment to produce positive net annual snow accumulation in high northern latitudes at around 115 ka BP was performed by Reference Syktus, Gordon and ChappellSyktus and others (1994). followed by Reference Dong and ValdesDong and Valdes (1995), Reference Schlesinger and VerbitskySchlesinger and Verbitsky (1996) and Reference Gallimore and KutzbachGallimore and Kutzbach (1996). However these were all coarse- or medium-resolution GCMs with no elevation or refreezing corrections, and with little ability to resolve relatively small highlands in Baffin Island in Dong and Valdes's T42 GCM with envelope orography is 550m, still considerably less than the higher ˜50 100 km scale plateaus (see Fig. 1 and Fig. 2b).) Consequently, those studies produced snow accumulation over widespread areas poleward of 65 N in northern Canada. Alaska, Scandinavia. Russia and/or Siberia, depending on the particular run. Other types of modeling studies have long emphasized the importance of small-scale highlands for ice-sheet initiation, including energy-balance models of snow-line altitudes (Reference WilliamsWilliams, 1979), one-dimensional ice-sheet models of glacial cycles (Reference Birchfield, Weertman and LundeBirehfield and others, 1982), and 2-D ice-sheet models of ice-sheet initiation. (Reference Andrews and MahaffyAndrews and Mahaffy, 1976). The latter studies suggest that small-scale highlands are necessary for ice-sheet initiation, since the snow line never descends to the widespread low-lying elevations in northern Canada (Fig. 2b). Instead, small ice caps are nucleated on the highlands, and then quickly grow vertically and spread horizontally to maintain net positive balance (Reference Abe-Ouchi and BlotterAbe-Ouchi and Blatter, 1993).
Experimental setup
We have run the version 2 GCM for present-day and for 116 ka BP, with computed slab SSTs and dynamic sea ice, and stored monthly mean AGCM data averaged over the last 10 years of fully equilibrated runs with total lengths of 40 and 20 years, respectively, and with the last 10 years having no detectable trends in global mean temperatures, sea-ice amounts, etc.). The only prescribed differences between the present-day and 116 ka BP GCM simulations were the Earth's orbit and the amounts of greenhouse gases. Then the dynamic ice model has been driven as described above for 10 000 years using the two sets of AGCM fields. For 116ka BP, the orbital elements used (Reference BergerBerger, 1978) were eccentricity = 0.041410, obliquity = 22.488 , and precession = 94.28° prograde from the Northern Hemisphere autumnal equinox to perihelion.
The atmospheric CO2 concentration was reduced from our present-day value of 345 ppmv to 314 ppmv for 116 ka BP. The actual pre-industrial and last interglacial value was more like 280 ppmv, but the value of 314 attempts to account simply for model biases due to the several-decade lag between the climate to which the GCM is tuned and the current CO2 level. Following that same logic, the atmospheric CH1 concentration was reduced from our present-day value of 1,653 ppmv to 1.088 ppmv for 116 ka (not to its pre-industrial value of ˜0.65 ppmv), and the other model trace gas amounts (N2O, CFC11, CFC12) were unchanged from the present-day values, even though they were smaller or non-existent at 116 ka BP. Present and past amounts of greenhouse gases are reviewed in Reference Houghton, Jenkins and EphraumsHoughton and others (1990). All other prescribed GCM parameters and fields in the model were unchanged from the present day, including the land-ocean–ice-sheet map, topography, atmosphericozone distribution, gravity-wave surface roughness, and soil textures.
As mentioned in a previous section, the vegetation distribution responds interactively to the GCM climate in our 116ka BP runs, so the colder summer temperatures at high northern latitudes have produced considerable southward expansion (to the order of ˜400 km) of tundra and polar desert into the boreal forests of North America and Russia. This in turn causes further cooling due to reduced snow masking and higher albedos. In similar, non-interactive GCM vegetation experiments, Reference Harrison, Kutzbach, Prentice, Behling and SykesHarrison and others (1995) have predicted comparable changes in vegetation, and Gallimore and Kutzbach (1996) have found that the vegetation-snow-masking feedback contributes significantly to the occurrence of positive net annual snow accumulation.
For the ice dynamics and bedrock model (Equations (3) and (4)), the only prescribed fields are the ice-free equilibrium bedrock elevations and a land ocean mask on the 0.5° × 0.5° grid. These were obtained from the present-day 10 min U.S. Navy FNOC global elevation dataset (Cuming and Hawkins. 1981; Reference KinemanKineman, 1985), aggregated simply to 0.5° × 0.5° resolution. This neglects small amounts of post-glacial rebound (≤ 150 m) still to occur around Hudson Bay and Scandinavia. Of course the use of present-day topography for equilibrium bedrock elevation is not valid over existing ice sheets such as Greenland and Antarctica, which is why Greenland is masked out of the figures presented below. We neglect the same type of error caused by small ice caps existing today on Baffin Island, the Canadian Archipelago and the northern Rockies, which causes local errors on the order of a few hundred meters (for instance, Barnes ice Cap on Baffin Island, one of the largest, is ≤ 600 m thick at the center (Mahafly, 1976). Although these can act as spurious sites for ice-sheet nucleation assuming they vanished completely during the last interglaciation, we feel the error does not affect the results below where our ice-sheet buildup occurs on considerably wider scales. However this error should be corrected in more detailed studies in the future.
Results
Figure 3a shows ice thicknesses h simulated over North America by integrating Equations (3) and (4) for 10 000 years, forced by the AGCM climate for the present day as outlined in the section dealing with asynchronous coupling. After 10 000 years these small ice caps have nearly equilibrated with the present GCM climate and their areally integrated mass balances are close to zero. In general the predicted locations of permanent ice correspond well with present-day ice caps and glaciers. On Baffin Island, the Penny Ice Cap in the south and the Bylot Island ice cap in the north are simulated, although the central Barnes Ice Cap and others along the east coast are missing. Ice caps on eastern Devon Island and Ellesmere Island are as observed, but the model produces too much ice on western Ellesmere and Axel Heiberg Islands. The model produces a large ice cap that nucleates on the Saint Elias Range (61° N, 140° W, and expands to the north. Extensive mountain glaciers and ice caps exist in that range today, but they are closer to the coast and not as thick or extensive as that of the model. One reason for this discrepancy could be the model's neglect of sub-grid (finer than 0.5°) topographic relief in mountainous areas, as discussed in the next section.
Figure 3b shows the same ice thickness map after 10 000 years, but forced by the AGCM climate for 116 ka BP. Although some additional ice caps have nucleated or expanded on Baffin, Devon and Ellesmere Islands, the amount of growth in northeastern Canada and the Archipelago is nothing like what is observed. The model's western ice sheet has enlarged considerably, compared to the present, and is still growing, but this is contrary to uncertain) geologic evidence of no significant ice-sheet growth in Alaska or western Canada until later in the glaciation (˜80 ka bp; Clark and others, 1993).
One possible cause for the model's failure to produce significant ice expansion in Figure 3b is that the GCM climate may be slightly too "ablative", perhaps due to warm biases in surface-air temperature (in fact the GCM's present-day climate is several degrees too warm over northeastern Canada). We can attempt to compensate for such an error by using observed monthly elimatological surface-air temperature data instead of the GCM's values in driving the snow/ice-surface model in step (2) for the present day. For 116 ka BP we use the change in surface-air temperature from the present predicted by the GCM, added to the present-day observed values. Figure 4 shows the resulting ice-sheet thicknesses after 10 000 years of dynamic integration for the present day and 116 ka BP. The present distribution (Fig. 4a) has equilibrated after 10 000 years but is now somewhat overestimated, with too much ice cover on central and western Ellesmere Island, and a large ˜1000m thick western ice sheet on the Alaska Canada border. For 116 ka BP (Fig. 4b) there is much greater expansion than before (cf. Fig,. 3b), with continuous thick ice over most of Baffin Island and ice caps on Banks and Victoria Islands to the west. If our ice model permitted ice shelving and expansion armos ocean straits, it is possible that the ice caps on Baffin, Devon and Ellesmere Islands would have coalesced and grown much bigger during this integration. However, the model still produces no nucleation on Keewatin or Labrador. By far the biggest expansion in terms of ice volume in Figure 4b occurred in Alaska and northwestern Canada, with a huge ˜2000 m western ice sheet (that is still growing rapidly after 10 000 years) and a thinner ice sheet covering the Brooks Range to the north; but as mentioned above, the available geologic data indicate no major ice growth in these regions until much later.
Discussion
There are two obvious problems with our predicted ice distributions for 116 ka BP in Figures 3b and 4b.
-
The rate of increase of ice volume over North America is an order of magnitude less than that implied by δ 18O deep-sea core and sea-level records following the end of the last interglaciation. Our values averaged over the 10 000 year integration are 0.39 × 10⁶ km3 for Figures 3b and 0.39 × 10⁶ km3 for Figure 4b, which correspond to sea-level drops of 1.1 m and 3.1 m compared to the observed drop of about 50 m in 10 000 years (e.g. Reference ShackletonShackleton, 1987).
-
The terrestrial geologic evidence shows that most of the global ice growth during 115–105 ka BP occurred over northeastern Canada, and not in western North America (and probably not dominantly in Europe. Russia or Antarctica; Reference DawsonDawson, 1992). However, our mode) predicts the growth of a large ice sheet in northwestern Canada and southern Alaska, and relatively anemic growth over northeastern Canada.
During the 116–106 ka BP interval, the real climate probably changed significantly due to the varying Earth orbit, the growing Northern Hemispheric ice sheets, and possibly other factors. These changes are neglected in our 10 000 year ice-sheet integration, since for economy we used the GCM foreing for 116 ka BP throughout. However, during that interval, the Earth's orbit tended towards warmer Northern Hemispheric summers and presumably greater ice ablation, which we suspect dominated the albedo feedback effect on the growing ice sheets. So, had we re-run the GCM at more frequent intervals (say every 3000 years), this would probably have produced even less ice growth and made the simulation in northeastern Canada even more unrealistic.
One possible cause of the first problem may be that our GCM is not sensitive enough to orbital changes. For instance, our summer surface-air temperatures over land poleward of ˜60° N for 116 ka BP are generally 2.4° C cooler than the present (not shown). In Dong and Valdes' (1995) GCM experiment for 115 ka BP, their cooling over northern Siberia and Keewatin is ˜8°C, where there are large snow accumulations (their figures 17a and 19). In Gallimore and Kutzbach's (1996) GCM with changed vegetation, their summer cooling over northern North America is even larger (˜23°C!; their table 1), with widespread large snow accumulations. Schlesinger and Verbitsky (1996) do not report regional temperature changes, but their coarse-grid GCM-ice-sheet model produces North American ice-growth rates that are considerably greater than ours. Changes in precipitation in northeastern Canada may also be important; Reference Andrews and JohnAndrews (1979), among others, has pointed out that drastically increased snowfall rates compared to the present precipitation must have occurred in that region around 116 ka BP to account for the global rate of ice growth. However, neither ours nor any other GCM study mentioned above has reported any drastic increase in total precipitation rates in northeastern Canada.
As mentioned above, our GCM does include the interactive vegetation–climate feedback that may be important at 116 ka BP (Gallimore and Kutzbach, 1996). Our parameterization of oceanic heat flux in the Norwegian Sea (Reference Thompson and PollardThompson and Pollard, 1997a, Reference Thompson and Pollardb) that keeps the region ice-free in winter, may be unrealistic for 116 ka BP and may inhibit changes in precipitation in the Aretic region. We have performed an additional short experiment for 116 ka BP with heat flux turned off, and, although sea ice covers the Norwegian Sea in winter as expected, no great increases in snowfall or reductions in summer temperatures occurred over Canada, and there were no significant differences in the ice-sheet results. However, that does not preclude large changes in oceanic circulation in the North Atlantic or elsewhere, the investigation of which will require the use of coupled ocean–atmosphere GCMs. As the quality, scope and resolution of GCMs improve in the future, hopefully a better consensus on the sensitivity of the climate in ice-sheet initiation regions to orbital changes will emerge.
The inaccurate response of the GCM to orbital changes on a regional scale might also be responsible for our second problem (excessive ice growth in western Canada and Alaska). There are no dramatic changes in the GCM's annual precipitation or winter snowfall over northern North America at 116 ka BP, and the summer temperatures drop uniformly by 2–4°C. (Larger drops of 4–8°C occur over lowlands in north-central Canada, but do not initiate ice-sheet growth.) Given that foreing, it is not surprising that the ice-sheet model produces huge growth over the north-western Rockies, which are by far the dominant topographic feature in the domain (Fig. 2b) and the western slopes of which receive large amounts of snowfall in the present climate.
There is another possible reason for this model error, due to the effect of sub-grid topography (personal communication from R. Anderson; Walland and Simmonds, 1996). The highland plateaus of Baffin Island and northeastern Canada are quite smooth at the ˜50 km scale, and so are adequately resolved by our 0.5° × 0.5° ice-sheet grid. In contrast, there is considerable sub-grid relief in more rugged mountain ranges like the Rockies (and in particular, the Saint Elias Range), with standard deviations of peaks and valleys of the order of ˜500° 1000m within one gridcell (cf. fig. 3 in Reference McFarlaneMacfarlane, 1987). However our model simulates only one value of the net annual snow/ice mass balance, using the mean elevation of the gridcell. That computed balance may be positive. But in reality, even though there is probably greater accumulation on the high peaks, the ice flows rapidly down the steep sub-grid slopes into the much lower and warmer valleys where it may all melt in summer and drain into rivers, producing a stable alpine environment of high-mountain glaciers and ice-free valleys with zero large-scale ice growth. Inclusion of this effect in our snow/ice model (step (2)) would inhibit the initiation of gridscale ice over rugged terrain, and we are currently working along those lines.
Conclusion
In summary, we have described a method for coupling coarse- and medium-resolution GCMs with high-resolution dynamic ice-sheet models. In this endeavor, care is needed to compensate for two potentially serious sources of error. First, the coarse GCM horizontal resolution cannot resolve relatively small-scale topographic features such as the east–west profile of Greenland, steep ice-sheet flanks, and important ice-sheet initiation sites such as the Baffin Island highlands. These topographical errors translate to errors in the GCM's summer surface-air temperatures that can overwhelm predictions of ice ablation and net annual mass balance, unless corrected for on the finer ice-sheet grid. Secondly, the GCM snow/ice-surface physics usually does not include ice-sheet-specific processes such as the refreezing of meltwater, that can significantly modify the effective ice-sheet mass balance.
We believe that the techniques outlined above substantially solve these problems, and the sequence outlined in the section pertaining to asynchronous coupling provides a practical means of implementing them in an asynchronous time-marching scheme. Together these methods open the door to viable simulations of coupled GCM ice-sheet evolution over tens of thousands of years, that can be used for applications such as ice-sheet initiation at the end of the last interglaciation, the sequence of events through the last deglaciation, and the responses of Greenland and Antarctira to anthropogenic climate change in the next several hundred years.
Acknowledgements
R. Anderson (Earth Sciences Department, University of California, Santa Cruz) originally suggested the idea of the inhibiting effect of sub-grid relief on ice-sheet nucleation to us, and we thank him for that and for subsequent discussions on its numerical implementation. Thanks are also due to an anonymous reviewer for careful suggestions that improved the clarity of the paper. The development of the GENESIS Earth system model at NCAR is supported in part by the U.S. Environmental Protection Agency Interagency Agreement DW49935658-01-0. The National Center for Atmospheric Research is sponsored by the National Science Foundation.