I. INTRODUCTION
The optical portion of the electromagnetic spectrum has a number of advantageous properties over the radiofrequency (RF) portion of the spectrum. These include higher bandwidth, typically 30 GHz, significant reduction in size weight and power, impermeability to electromagnetic interference, and high-speed sampling capabilities [Reference Capmany1, Reference Minasian2]. Typical RF filtering devices require down-conversion, which leads to spectral band reduction to process input RF signals electrically. This reduction process is referred to in optical signal processing as the “electronic bottleneck” because processing power limits filter sampling capacity [Reference Iezekiel3]. This is the motivation for the use of optical components for filtering RF signals; the RF signal can be directly processed once up-converted onto the optical carrier.
Once the RF signal has been up-converted onto an optical carrier there are a variety of filters that can be implemented to process the signal. Fiber delay lines have been shown to generate optical filters [Reference Wilner and Van Den Heuvel4]. Unfortunately, simple fiber delay lines lack tunability once assembled; the fiber length is set, therefore the filter characteristic is then controlled by the optical delay generated by the linear propagation difference between the delay lines. Many different filter schemes have been designed to overcome this lack of tunability. A method of using arrayed waveguide gratings (AWG) has been shown to provide discrete fiber delay lines [Reference Coppinger5]. Unfortunately the tunability of the device is limited by the number of possible delay lines selected by the AWG. Other methods have implemented the use of fiber Bragg gratings (FBGs) and circulators to generate tunable filters that vary the fiber propagation distance by generating different reflection path lengths within the fiber. Although FBGs are not continuously tunable they offer much smaller incremental change in the propagation distances, allowing for greater tunability. There are susceptible to changes in the polarization state of the optical carrier [Reference Middleton6]. The use of chirped FBGs gives continuous tunability to the system [Reference Minasian2], but is still vulnerable to polarization state changes during propagation [Reference Middleton6]. The use of contrasting dispersion slope fibers implemented in a tunable intensity-modulated direct detection (IMDD) microwave photonic link offers a continuously tunable filter, which is free from the polarization state vulnerabilities and complexities generated by the previously mentioned filter designs [Reference Haefner7]. Balanced differential detection of the IMDD link provides suppression of relative intensity noise (RIN) generated by the optical carrier, and allows for the introduction of negative filter taps [Reference Middleton and Desalvo8, Reference Sales9].
The use of a tunable Continuous Wave (CW) laser as an optical source in an IMDD link containing contrasting dispersion slopes affords the tunability of the fiber dispersion in each arm of the link. This difference in dispersion generates an optical delay between the signals at the detector, which is used to generate the filter characteristics. The filter's transfer function is dependent upon the wavelength of the optical carrier, therefore the range and speed of the filter tuning is dependent on the rate at which the optical carrier can be tuned. Distributed Feedback Laser (DFB) lasers can achieve upwards of 50 nm tuning range centered at 1550 nm, but with a wavelength switching time of several seconds [Reference Ishii10]. Laser sources are available that offer a wide range of tunability of up to 125 nm with tuning rates of sub micro-seconds [11]. However greater speed of tunability comes at the sacrifice of the laser line width.
II. FILTER DESIGN
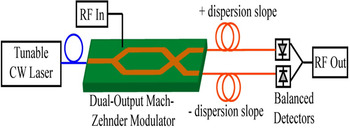
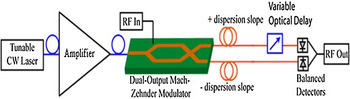
The simplest filter design, as shown in Fig. 1, is a positive and negative single tap delay line filter consisting of an input RF signal modulated onto an optical carrier, a tunable InGaAsP laser, using a dual-output Mach–Zehnder modulator (MZM). The lower arm of the dual-output MZM is opposite the upper arm, or 180° out of phase which is essential for the RIN suppression at the differential detectors. The output of each arm of the MZM is then propagated down individual lengths of fiber, with contrasting dispersion slopes. The contrasting dispersion slopes generate a temporal delay as the signal is propagated down the fiber. After propagating down the fiber it is detected by two photodiodes that return the modulated signal back to the RF domain. The lower arm is subtracted, which effectively adds the signals due to the inverted MZM outputs.
Block diagram of microwave photonic link implementing contrasting fiber dispersion slopes

For our model, a dispersion slope (S0) of ±0.08 ps/nm2/km was chosen as a slightly more dispersive fiber element than the typical non-zero dispersion shifted fiber dispersion slope (S0) of ±0.06 ps/nm2/km [Reference Ramachandran12]. In addition, the zero-dispersion point of both the fibers was set to 1550 nm, the typical operating wavelength of an InGaAsP laser. Setting the optical carrier to the zero-dispersion point allows for the link to act as an all pass filter. This occurs because there is no optical delay generated between the fiber path lengths.
Sacrificing the all pass filtering characteristics of the zero-dispersion point in the fiber can generate greater dispersion by shifting the operating point away from the minimal dispersion. The implementation of dispersion compensating fibers, such as the Corning® Vascade® series fibers, can permit up to ±0.12 ps/nm2/km dispersion slopes; however they are not located at zero-dispersion point. The use of this larger dispersion slope and dispersion difference can allow for shorter propagation distances in the link. The required propagation distances for the filter operation, using ±0.08 ps/nm2/km, are > 2 km, for this work the propagation distance was limited to 10 km. At 10 km the peak spacing of the filter is greatly reduced, increasing the resolution abilities of the filter, therefore enhancing its ability to process more densely packed signals in the frequency domain.
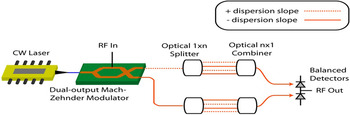
A greater number of taps increases the complexity of the filter design, but enhances the system's signal processing capabilities. Greater numbers of taps can be added as seen in Fig. 2. These higher-order taps can be generated by modifying the lengths of the fibers to be integer multiples of original tap length. This will ensure the time delays remain integer multiples of the original delay. Alternately, making the dispersion slopes integer multiples of one another will generate greater number of taps. The use of integer multiples for the dispersion slopes requires further engineering and exploration, however it has the added benefit of maintaining the same physical propagation distance through the system. Eliminating differences in propagation distance mitigates the need for additional attenuators to balance the signal strength before the detectors.
Block diagram of microwave photonic link implementation.

Although the higher-order taps provide greater flexibility they have the potential to interfere at the optical combiner due to coherence. This optical interference eliminates the filtering advantages of the electrical subtraction properties of the filter.
III. FILTER DESCRIPTION
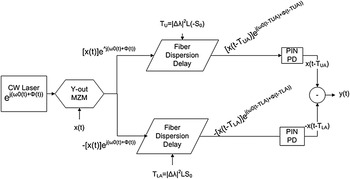
The simple transversal filter is easily described by the transfer function of the sum of each of the weights of the taps, which are electrically subtracted after detection. Figure 3 demonstrates the temporal changes that occur to the signal as it travels through the system.
Temporal representation of the input signal during propagation.

Beginning with an ideal input RF signal, x(t), the RF is modulated onto the optical carrier which is defined by
 $${e^{\,j({\omega _0}(t) + \varphi (t))}}. $$
This produces modulated signals of
 $$\pm [x(t)]\,{e^{\,j({\omega _0}(t) + \varphi (t))}}, $$
in the upper and lower arms of the MZM. The signals then propagate down the fiber where the delay is added. This delay is determined by the optical operation wavelength on the dispersion slope of the fiber. The time delay in the signal ΔT is proportional to the wavelength shift of Δλ away from the zero-dispersion point in the fiber [Reference Soref13], giving ΔT=(1/2)D(λ)LΔλ. In this equation, the dispersion D(λ) is defined by D(λ)=S 0Δλ, where S 0 is the dispersion slope of the fiber, and L is the length of fiber. Using this fiber delay the signal then becomes
 $$[x(t = \Delta T)]\,{e^{\,j({\omega _0}(t - \Delta T) + \varphi (t - \Delta T))}}, $$
in each of the arms of the fiber, where the time delay in the upper arm is equal to the time delay in the lower arm under the assumption that the dispersion slopes of the fibers are contrasting. Therefore, T UA=−TLA=Δτ. After the detection of the signals following the photodiodes are
 $$x(t = {T_{UA}}), $$
 $$ - x(t = {T_{LA}}). $$
By electrical subtraction this produces an output signal of
 $$y(t) = x(t=T_{UA}) + x(t=T_{LA}).$$
Taking the Fourier transform of the output
 $$Y(\omega ) = X(\omega )\,{e^{ - j\omega {T_{UA}}}} + X(\omega )\,{e^{ - j\omega {T_{LA}}}}, $$
allows for the calculation of the transfer function H(ω) along with the substitution of time delay τ=T UA=−TLA to produce
 $$H(\omega ) = \displaystyle{{Y(\omega )} \over {X(\omega )}} = {e^{ - j\omega \tau}} + {e^{\,j\omega \tau}}. $$
Using Euler's Identity the transfer function can be written as
 $$\eqalign{H(\omega ) & = [{\rm cos}(\omega \tau - j\,{\rm sin}(\omega \tau )] + \left[ {\cos \,(\omega \tau ) + j\,{\rm sin}\,{\rm (}\omega \tau {\rm )}} \right] \cr & = H(\omega ) \;= \; 2{\rm cos}\,{\rm (}\omega \tau {\rm )}.} $$
Therefore the magnitude of the normalized transfer function would be
 $$\left\vert {H(\omega )} \right\vert = \sqrt {{\rm co}{{\rm s}^2}(\omega \tau )} = \sqrt {{\rm co}{{\rm s}^2}\left( {2\pi f\left( {\displaystyle{{\Delta {{\rm \lambda} ^2} \cdot L \cdot {S_0}} \over 2}} \right)} \right)}, $$
which coincides with the expected transfer function of a tapped delay line transversal filter.
With the addition of a greater number of taps the system becomes more complex to implement, but also allows for greater flexibility in filter design. Separating the positive and negative dispersion slopes allows for the sum of sums following the differential detection. Using the same method as in the simple positive and negative two tap delay line filter the output signal can be written as
 $$y(t) = \mathop \sum \limits_{r = 1}^N x(t = r{T_{UA}}) + \mathop \sum \limits_{r = 1}^N x(t = r{T_{LA}}). $$
Again taking the Fourier transfer of the output, while using the convention defined in equation (7) the transfer function becomes
 $$H(\omega ) = \displaystyle{{Y(\omega )} \over {X(\omega )}} = \mathop \sum \limits_{r = 1}^N {e^{ - j\omega r\tau}} + \mathop \sum \limits_{r = 1}^N {e^{\,j\omega r\tau}}. $$
Using the knowledge from Euler's Identity, the two summations will generate pairs of cosines and opposite sines, which cancel as seen in the simple example of equation (8), we can write the normalized magnitude of the transfer function as
 $$\left\vert {H(\omega )} \right\vert = \sqrt {{{\left( {\mathop \sum \limits_{r = 1}^N \displaystyle{{{\rm cos}\left( {\omega r\tau} \right)} \over N}} \right)}^2}}. $$
From the transfer function, the delay rτ must be integer multiples of τ. This can be done either by making each of the fibers integer multiples of the shortest fiber length, which means rτ = Δλ 2(rL)S 0, or by creating pairs of contrasting dispersion slopes which are integer multiples of one another in fulfill this criteria. In this case, rτ = Δλ 2L(rS 0). It is important to again note that the Nx1 optical combiners may cause unwanted interference due to the coherence of the optical carrier when the optical signals are merged.
IV. MODEL VERIFICATION
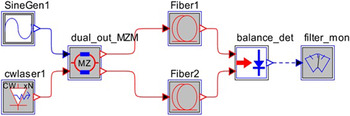
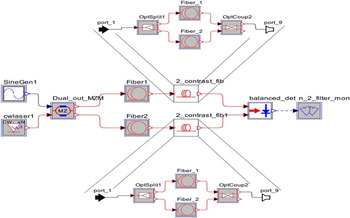
To validate the mathematical model described in the previous section, RSoft's system level modeling software, Optsim, was used. This filter was designed and tested in the software package using the Block Mode simulation type. Figure 4 illustrates the simulation of the block diagram that was used to test this model.
Simulation block diagram of the contrasting fiber dispersion slope filter.

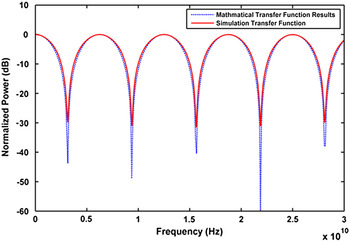
The simulation consisted of an RF tone swept from 0.01 to 30 GHz then modulated onto a tunable CW laser as an optical carrier using a dual-output MZM. The dual-output MZM was constructed from two single-output MZMs with inversely biased V π to generate the required 180° phase shift. The signal was then propagated down the two fibers until it reached the balanced differential detection scheme as previously described. The normalized output for the simple two tap filter operating at 1570 nm or a 20 nm shift from zero-dispersion point is shown in Fig. 5. This simulation output was compared with the solution found for mathematical model described in the previous section.
Mathematical model versus simulation results.

The simulation results match the mathematical results with slight differences in null depth. The difference in null depth can be accounted for by a lack of resolution in the simulation, and due to small variations in output power between the two fibers. A slight difference in the output power at the detectors can greatly diminish the null depth.
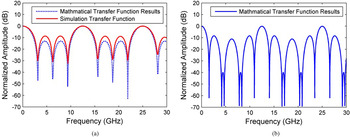
Expanding on the simple delay line filter, a simple two-tap filter was tested against the mathematical model for an N = 3 positive and negative tapped delay line filter with the N = 2 taps removed. Figure 6 demonstrates the block diagram of such a filter. The N = 1 and 3 taps are shown removed following the initial contrasting dispersion slope filter. This clever solution decreases the free spectral range (FSR) in increase the full-width at half-maximum (FWHM) of the pass bands by adding a simple one negative one positive tap delay line before the N = 3 delay line. This cancels the second-order taps. The removed tap delay line filter, shown in Fig. 7(a) was also simulated to test the accuracy of the mathematical model for more complex systems. The spectral shape of the transfer function matches that of the simulation, although the lobes in the pass band have lower transmission in the mathematical model.
Block diagram of N = 3 tap delay line filter with the N = 2 tap removed.

(a) N = 3 pos neg tap delay line filter with N = 2 tap removed; (b) N = 3 pos neg tap delay line filter.

The results for an N = 3 positive and negative tapped filter is shown in Fig. 7(b). This eliminates the two fibers placed in front of the N = 3 taps to generate a higher-order filter. It demonstrates narrower pass bands with wider stop bands.
The simulation has demonstrated the accuracy of the model for both higher-order tapped delay line filters using contrasting dispersion slopes, and perfectly represented the transfer function for simple positive–negative tapped delay line filters. This shows great potential of this novel filter design.
V. FILTER PERFORMANCE
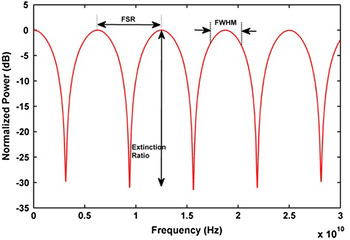
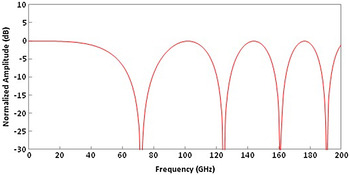
To test the performance of the filter four criteria were chosen including: FSR, FWHM, extinction ratio, and Q factor. These figures of merit are shown in Fig. 8 on the simple positive–negative tapped delay line filter
Performance metrics of the filter.

As shown in Fig. 8, FSR is the distance between each of the peaks of the pass bands of the filter, the FWHM is width of the 3 dB loss surrounding the main lobe of the filter pass band, and the extinction ratio is the ratio between the spectral peaks and nulls. The Q factor or quality factor of filter is determined by the ratio of the FSR to the FWHM of the filter [Reference Iezekiel3]. For the simple positive–negative tapped delay line filter, the extinction ratio was 30 dB, and the FSR was 6.25 GHz with a FWHM of 3.1 GHz. This gives the filter a Q factor of 2.025, which is approximately correct as the number of filter taps can approximate the Q factor [Reference Iezekiel3].
In addition, the rapid tenability and immunity to polarization state changes the N-tap filters and give the system designers many opportunities to modify the filter structure for designing systems with a wide variety of specific signal processing needs. This is demonstrated by the removed tap filter; the FWHM of the system was increased to widen the pass band while leaving the FSR the same as the N = 3 positive–negative tap filter.
VI. PHYSICAL LIMITATIONS
To test the performance of the filter four criteria were chosen including: FSR, FWHM, extinction ratio, and Q factor. These figures of merit are shown in Fig. 8 on the simple positive–negative tapped delay line filter.
Although the theory for the contrasting dispersion is highly promising there are many physical limitations on the system design. Using simulations and theoretical values provides fruitful results; however, to characterize this optical processor physical aspects must be designed. The greatest challenge is the generation of a contrasting large value dispersion slopes. Recent advances in research show that a dispersion slope of ±0.08 ps/nm2/km and greater is achievable and realistic [Reference Birks14]. The additional costs associated with specialty fibers will be diminished as they become more prevalent in various optical applications. Thus far, for the purpose of this paper it has been assumed that the dispersion slope is linear. This assumption may be accurate over small tunable regions of the optical carrier wavelengths, but over a widely tuned of optical wavelength it becomes increasingly non-linear. Also, the dispersion may not be perfectly contrasted, leaving extra phase terms to be included in the calculation of the transfer function.
The propagation delay will change and the filter transfer function must be recalculated if the dispersion in each arm is different. The simple transfer function from equation (9) must be re-written to account for the additional phase delay incurred by one of the arms of the filter. Starting from equation (4) with the new assumption that T LA=−(T UA+ΔT), the new equation will become
 $$\; x(t = {T_{UA}})\quad x(t = {T_{LA}}) = - ({T_{UA}} + \Delta T). $$
Following the procedure through equation (7) produces
 $$H(\omega ) = {e^{ - j\omega \tau}} + {e^{\,j\omega \tau + \Delta T}}, $$
 $$\eqalign{H(\omega ) & = [\cos \,(\omega \tau ) - j\,{\rm sin}(\omega \tau )] + [\cos (\omega \tau + \omega \Delta T) \cr & \quad + j\,{\rm sin}(\omega \tau + \omega \Delta T)]}, $$
The magnitude of the transfer function is the square root of the sum of the real and imaginary parts squared. This produces,
 $$\left\vert {H(\omega )} \right\vert = \sqrt {\matrix{ {\matrix{ {{{\cos} ^2}(\omega \tau ) + {{\cos} ^2}(\omega \left( {\tau + \Delta T} \right)) + {{\sin} ^2}(\omega \tau )} \cr { + {{\sin} ^2}(\omega \left( {\tau + \Delta T} \right))} \cr}} \cr { + \; 2\cos \,(\omega \tau )\cos (\omega (\tau + \Delta T))} \cr { - 2\sin \,(\omega \tau )\sin (\omega (\tau + \Delta T))} \cr}}, $$
which can be simplified using Pythagorean Identities, the Sum-difference, and Half-angle formulas to
 $$\left\vert {H(\omega )} \right\vert = \sqrt {{\rm co}{{\rm s}^2}\left( {\omega \left( {\tau + \displaystyle{{\Delta \tau} \over 2}} \right)} \right)}. $$
Furthermore, it is assumed that the zero-dispersion point for both fibers is set to the typical operating wavelength of the laser. This condition can be difficult to achieve, especially with higher dispersion slope fibers, so the dispersion equation must be linearized about the typical operating wavelength: D(λ)=S λΔλ+D λ where S λ and D λ are the dispersion slope and relative dispersion at the typical operating wavelength, respectively. The Δλ's also now represent different values, with Δλ zdp being the wavelength difference between the operating wavelength and the zero-dispersion point of the fiber, and Δλ tuning being the wavelength tuning from the typical operating wavelength of the laser for a general normalized transfer function of
 $$\; \sqrt {{{\cos} ^2}(\omega \tau )} = \sqrt {{{\cos} ^2}\left[ {2\pi f\left( {\displaystyle{{\Delta {\lambda _{z\,dp}} \cdot L \cdot \left( {{S_\lambda} \cdot \Delta {\lambda _{tuning}} + {D_\lambda}} \right)} \over 2}} \right)} \right]}. $$
Even with zero-dispersion points far from the typical operating wavelength of the laser, by adding a calculated path-length mismatch, a reasonably flat frequency response can still be generated prior to laser tuning [Reference Wilner and Van Den Heuvel4]. By adding fiber of length
 $$\Delta L = \displaystyle{c \over {2n}}({T_{UA}} - {T_{LA}}), $$
to the lower arm of the system, where c is the speed of light and n is the index of refraction of the additional fiber the link is balanced and will only see the effects of chromatic dispersion modeled by Nichols et al. [Reference Nichols and Esman15]
 $$\cos \,(\varphi ) = \cos \left( {\displaystyle{{\pi D{\lambda ^2}L{f^2}} \over c}} \right), $$
prior to tuning. Figure 9 demonstrates the chromatic dispersion from a balanced link with zero-dispersion points at 1520 nm and all the other system parameters were kept constant.
Chromatic dispersion in a balanced non-zero dispersion link.

As the figure illustrates, the frequency response is nearly flat out to 40 GHz, beyond which it is typically component limitations that are the greatest cause of system perforce degradation. This configuration is beneficial if the signal of interest is an unknown frequency, meaning a system with nulls already present may cause difficulty in locating the signal. A link balanced in this fashion is modeled by
 $$\left\vert H(\omega) \right\vert = \sqrt {\matrix{ {{\cos ^2}(\omega ({T_{UA\; tuned}} + {T_{LA\; untuned}}} \cr { - {T_{UA\; untuned}} - {T_{LA\; tuned}})} \cr}}. $$
These terms include the time delay from the calculated path mismatch, so only the T from dispersion of each arm before and after tuning from the typical operating wavelength are necessary.
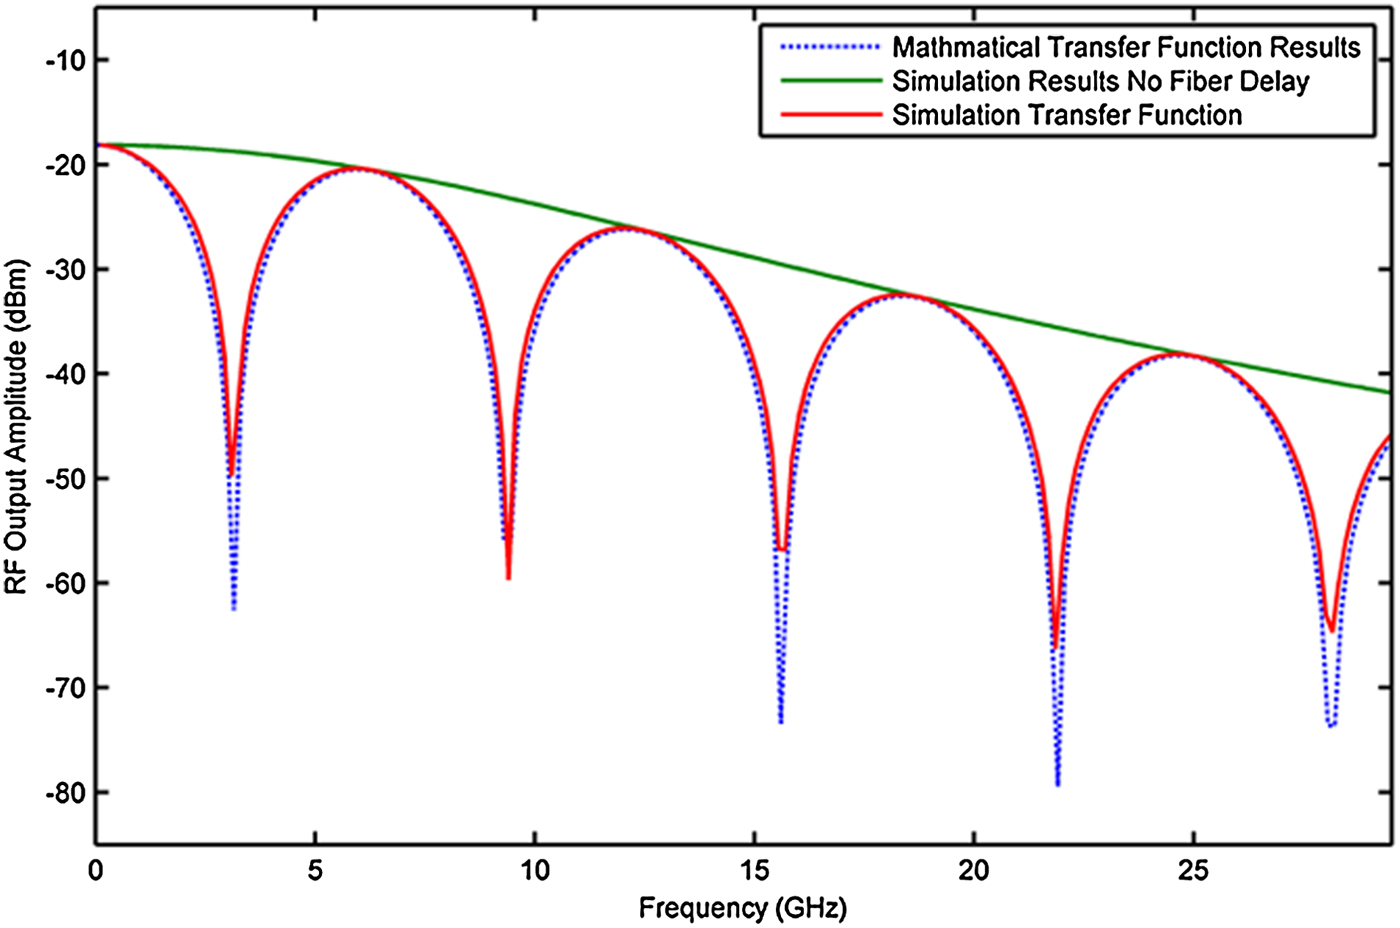
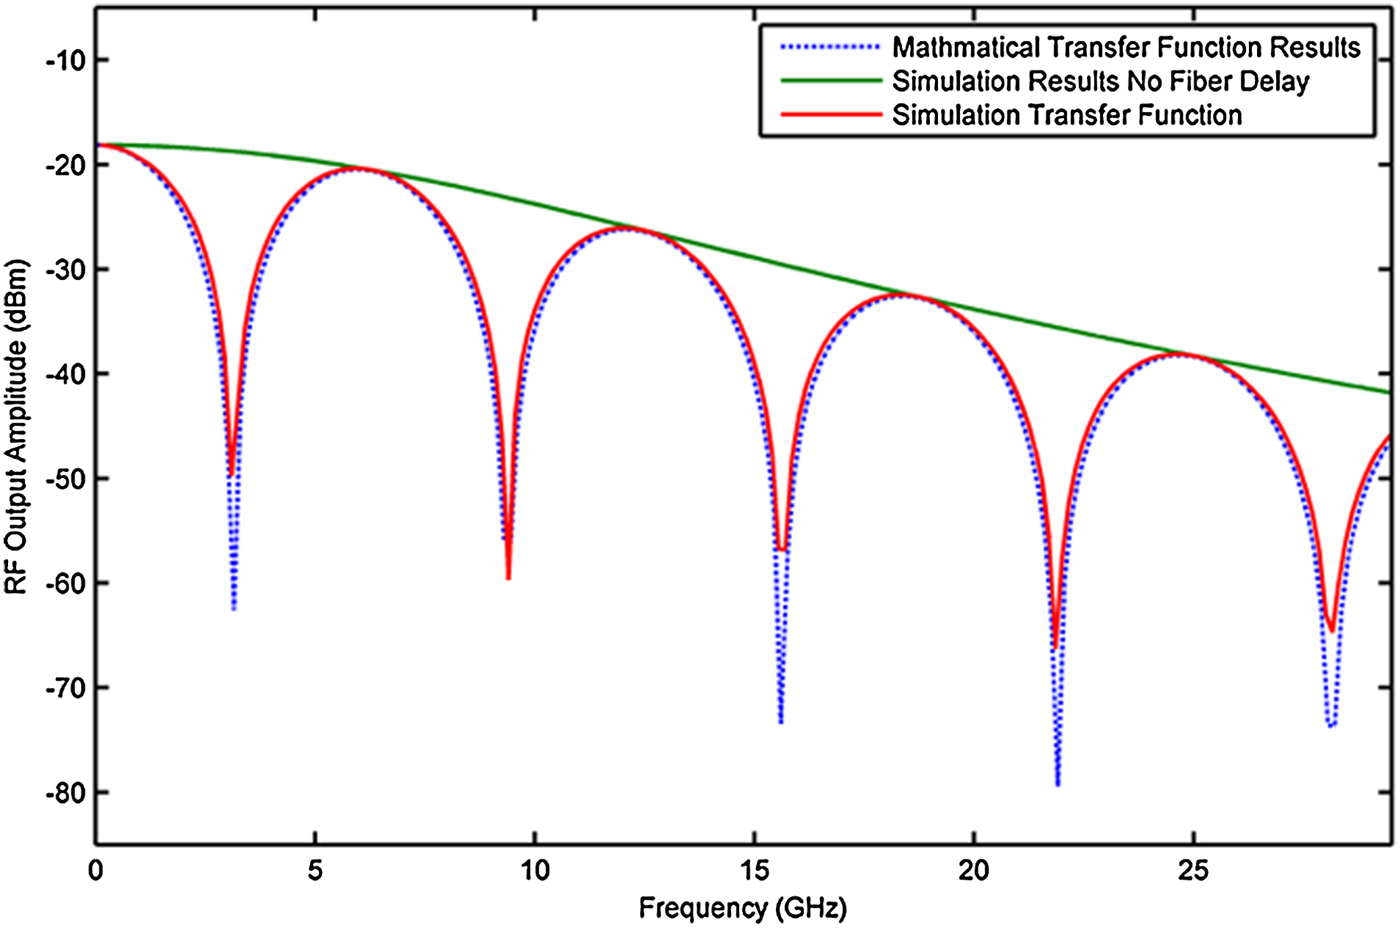
Finally, all components have been assumed to be lossless. A transfer function including frequency-dependent loss is shown in Fig. 10. There is a 20 dB decrease in the output value of the system between 0 and 30 GHz, due to the frequency dependence of the components in the link. Further research is being conducted to mitigate this effect. The solid green line demonstrates the frequency dependence losses of the components of the link by graphing the all pass filter set to the zero-dispersion point.
Simple transfer function including frequency-dependent losses of MZM and detectors.
VII. EXPERIMENTAL VALIDATION
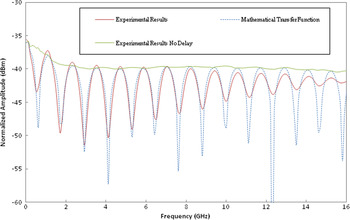
To demonstrate these physical limitations and further validate the proposed models the experiment illustrated in Fig. 11 were performed. An input RF signal is modulated onto an optical carrier using a dual-output MZM biased at quadrature. The output of each arm of the MZM is then propagated down individual lengths of fiber with imperfectly contrasting dispersion slopes, Vascade S1000 fiber (dispersion slope=−0.12 ps/nm2/km) and SMF-28e fiber (dispersion slope = 0.092 ps/nm2/km). The two arms are attached to a balanced photodetector and a variable optical delay is included for path matching purposes. The test swept an RF tone from 0.01 to 16 GHz (the compression point of the modulator) over a length of 5 km of fiber at 1553 nm or a shift of 3 nm from the typical operating wavelength. This comparatively low Δλ value was selected due to the high relative dispersion at 1550 nm of the selected fibers and demonstrates that with properly engineered fibers, extensive filter capabilities are possible with minimal wavelength tuning. The results are shown in Fig. 12.
Block diagram of experimental setup.

Mathematical model versus experimental results.

The data show excellent periodic alignment, with differences in null depth due to lack of resolution, small differences between the output power of each fiber arm, as well as contributions from the modulator. The experimental results begin to differ slightly at higher frequencies from the mathematical results due to the assumption of losses components over the specific frequency noted in Section 5.
There is <1% difference between the calculated τ and the τ value fitted to the data, which can easily be accounted for by slight inaccuracies in measurement of the dispersion parameters or fiber length.
An experiment was also performed to demonstrate the potential of this filter in compact systems using tunable dispersion compensators capable of dispersion values up to ±1200 ps/nm. The system substitutes the spools of contrasting dispersion slope fibers in Fig. 11 for these tunable dispersion compensator modules, achieving a system with only a few meters of fiber that is responsive to laser tuning of <1 nm. Fig. 13 shows the system output with maximum dispersion values and Δλ of 0.7 nm.
Experimental results of high dispersion testing.

This result corresponds to over 7 km of fiber with similar tuning using the fiber from the first experiment, or hundreds of nanometers of wavelength tuning for a system that is 20 m long on each arm. This experimental system does display some undesirable periodic dependence on frequency due to the lack of rigorously controlled path length and amplitude matching. The link still demonstrates the potential for compact systems to utilize the filter method presented.
VIII. CONCLUSION
We have developed a rapidly tunable microwave photonic filter using contrasting dispersion slope fibers and a tunable laser. In addition to acting as transversal filter implementing fiber delay, it can be tuned to a zero-dispersion point to act as an all pass filter for interferer detection. A link containing the filter was simulated and experimentally verified demonstrating its performance over the typical operating frequencies of analog photonic links. Simple positive–negative two tap filters have been verified using balanced differential detection. In addition, more complex multi-tap filters can be used in new optical signal processing designs. The filter's tunability can reach up to 200 nm/s for the optical carrier, and produce null depths of 30 dB or more. In addition, a Q factor of 2 was demonstrated, but much higher Q factors are proposed with greater numbers of delay lines. We have also demonstrated that the system operates predictably despite departures from the ideal setup, indicating that the generalized equations can be used to describe a broad range of systems that utilize this phenomenon. Further development of steeper dispersion slopes will increase the physical potential of these systems by decreasing their size. If sharp dispersion slopes can be generated within waveguides, the system size could be greatly reduced as the required propagation distances could be shortened by orders of magnitude, giving the system a wider variety of potential uses in current microwave optical links.
 Joseph W. Haefner received the B.S. degree in electrical engineering with high honors from Michigan Technological University, Houghton, MI, in 2013. He is currently pursuing an M.S. degree in electrical engineering at the Air Force Institute of Technology (AFIT), Wright-Patterson Air Force Base, OH. He has worked as a research intern at Michigan Technological University collaborating with Harris Corporation on microwave photonic system simulation, and now is currently a researcher at the Air Force Research Laboratory (AFRL) working with integrated photonic devices. His research interests include microwave photonics and integrated photonic devices.
 Christopher Middlebrook is an Associate Professor of Electrical and Computer Engineering at Michigan Technological University. He received a Ph.D. in Optics from University of Central Florida in 2007. Prior to that he worked for NSWC Crane in the Electro-optics Department from 1999–2003. He has received the HKN Outstanding Electrical Engineering Professor of the Year Award and the Michigan Tech Graduate Faculty Mentor Award in 2010/2011. His research interests include: integrated photonic devices, microwave photonics, optical material characterization, visible and infrared imaging systems, optical remote sensing system design, and laser projection systems. Dr. Middlebrook is a Member of the SPIE and OSA.
 Alexander Adams is pursuing a BS in chemical engineering at the University of Florida with an expected graduation date of 2016. He conducted research on RF photonic systems in industry and is currently performing novel materials research for battery anodes and scintillators at Oak Ridge National Labs.
 Dr. Charles Middleton is a principal investigator in photonics at Harris Corporation, where he leads the research and development of microwave photonic systems for a wide range of applications, including ground, shipboard, avionics, and space platforms. Dr. Middleton is the author of many patents and publications. He holds a BS degree in Electrical Engineering from Brigham Young University and a Ph.D. in Optics from the University of Central Florida.
 Dr. Richard DeSalvo is a Senior Scientist in Harris Corporation's Photonics Core Technology Center. Richard's technical areas include coherent analog fiber optic system development, RF photonic sub-system insertion, optical arbitrary waveform generation, optics and photonics for high-speed lightwave communication systems, next generation wireless networks for future military systems, Dynamic Spectrum Access in Tactical Radio Networks, and development of soft X-ray sources for decontamination against biological pathogens. Prior to rejoining Harris in 2004, Richard was the Senior Scientist for JDSU's Transmission System Group where he worked in developing 10 Gb/s and 40 Gb/s transponder technologies. Richard graduated with a B.S. degree in Physics in 1988 from Jacksonville University and a Ph.D. degree in Physics in 1993 from the University of Central Florida's Center for Research in Electro-Optics and Lasers (CREOL).