INTRODUCTION
The isotopic composition of dissolved inorganic carbon (DIC) in natural waters is used in oceanography and hydrology to obtain clues about carbon behavior. Radiocarbon (14C) concentrations provide information on water residence time, atmosphere-ocean carbon exchange, ocean water circulation, and anthropogenic or magmatic carbon supplies (Ostlund Reference Ostlund1987; Rose and Davisson Reference Rose and Davisson1996; Elliot et al. Reference Elliot, Andrews and Edmunds1999; Sikes et al. Reference Sikes, Samson, Guilderson and Howard2000; Matsumoto Reference Matsumoto2007; Takahashi et al. Reference Takahashi, Nakamura, Tsukamoto, Kazahaya, Handa and Hirota2013). International programs on ocean water analysis, like WOCE, GLODAP, and GEOTRACES (McNichol et al. Reference McNichol, Jones, Hutton, Gagnon and Key1994; Key Reference Key1996; Ge et al. Reference Ge, Wang, Zhang, Luo and Xue2016; Olsen et al. Reference Olsen, Key, van Heuven, Lauvset, Velo, Lin, Schirnick, Kozyr, Tanhua, Hoppema, Jutterström, Steinfeldt, Jeansson, Ishii, Pérez and Suzuki2016), provided an experimental protocol for the analysis of carbon isotopes and the analytical intercomparison using same seawater samples, in order to prevent biases between laboratories and obtain high accuracy dataset (McNichol et al. Reference McNichol, Jones, Hutton, Gagnon and Key1994; Dickson et al. Reference Dickson, Sabine and Christian2007). The seawater samples collected during these programs were poisoned with a sterilizing agent (e.g. HgCl2), to avoid any biogenic activity. However, the treatment of poisoned water is controlled by law and difficult to perform in comparison program due to the hazardous level of mercury present in the wastewater. Takahashi et al. (Reference Takahashi, Minami, Aramaki, Handa and Matsushita2019) reported that 14C concentrations in unpoisoned natural waters (seawater, hot-spring water, and groundwater) changed over several days, while in NaHCO3 solutions 14C contents were stable over periods of years. The purpose of this study, therefore, is to prepare 14C-stable and inter-batch homogeneous waters with a wide range of natural conditions (i.e. widely varying amounts and types of salts), DIC and 14C concentrations in order to use 14C intercomparison. Here, a procedure for preparing of comparison waters artificially without a sterilizing agent is described and we discussed the 14C stability and inter-batch homogeneity of comparison waters.
PROCEDURE FOR PREPARING COMPARISON WATERS
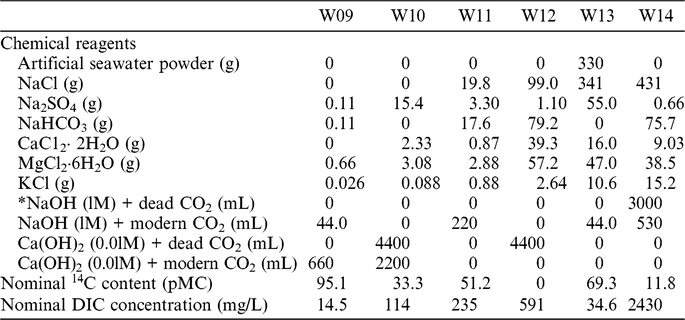
Six water samples (W09–W14) were prepared using purified water (Milli-Q Gradient A10, Elix water purification system, Merck-Millipore) and guaranteed chemical reagents; more details are provided in Table 1. The Milli-Q water was purified from organic matter using ultraviolet oxidation and ultrafiltration (total organic carbon <3 ppb). The prepared water samples were then stored in gamma-sterilized polyacrylonitrile (PAN) bottles (250 mL; Nikko Hansen & Co., Ltd.). PAN bottles provide an effective barrier against gas exchange (Takahashi et al. Reference Takahashi, Minami, Aramaki, Handa and Matsushita2019).
Chemical reagents used in 22 L for water samples W09–W14. The artificial seawater powder was Marine Art SF-1 (Osakayakken Co., Ltd); * indicates an alternative to the NaHCO3 reagent, because of a supply shortage. The nominal 14C and DIC values were computed from the mixture ratio of the chemical reagents. The DIC concentrations of the hydroxide solutions were measured by acid titration, using bubbling solutions of NaOH and Ca(OH)3 during the pre-test experiment.
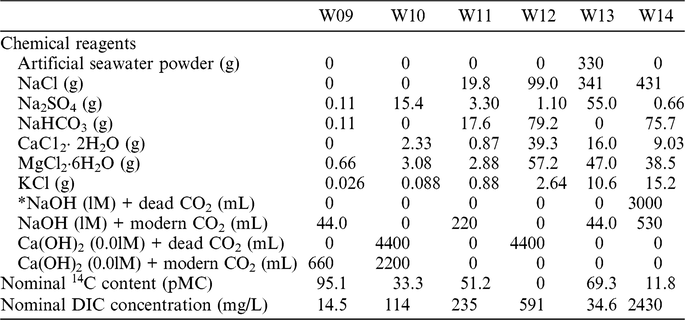
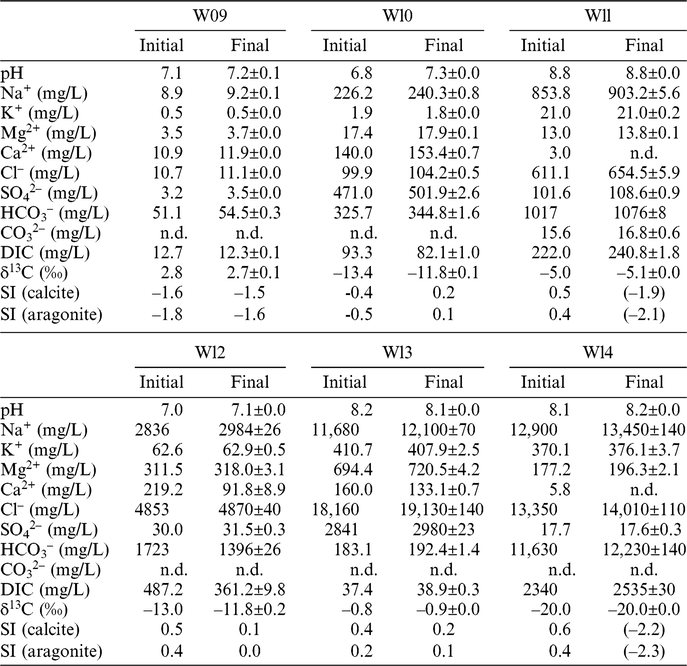
The nominal 14C content of the samples was targeted to be 0–95 pMC (Table 1), while chemical contents (Na+, K+, Mg2+, Ca2+, Cl−, SO4 2−, HCO3 −, and CO3 2−) were similar to those of natural waters (Table 2). The carbon sources included NaHCO3, gas-bottle CO2 (Taiyo Nippon Sanso Co.), and natural shell powder (Naitoh Shouten Co., Ltd.; employed as pigment in the Japanese painting industry). The former two sources were considered dead-carbon sources, while the latter was considered modern. Shell powder was reacted with H3PO4 or HCl in 1 L plastic bottles to produce CO2. The CO2 released from the shell powder and the gas-bottle CO2 were collected in 20 L Tedlar® gas-sampling bags; then, the CO2 gas was dissolved through bubbling in 1 M NaOH or 0.01 M Ca(OH)2 solutions (360–500 mL). The NaOH and Ca(OH)2 solutions acted as a control of the cation content and adjust it to natural water chemical compositions (Na and Ca types). The obtained CO2 gas was pumped through both the hydroxide solutions at ~20 L hr–1 for 3–5 hr (gas bags were exchanged several times). The bubbling was stopped when the pH of hydroxide solution reached ~7.6. The Ca(OH)2 solution was filtered under suction (with a 5 µm glass-fiber filter), in order to remove any precipitate generated during bubbling. The carbon contamination to the hydroxide solutions produced during bubbling cannot be eliminated, but it does not really matter because a slight contamination does not influence to perform intercomparison using these waters. Additionally, we made sure that all batches of comparison water had identical 14C concentrations and chemical compositions.
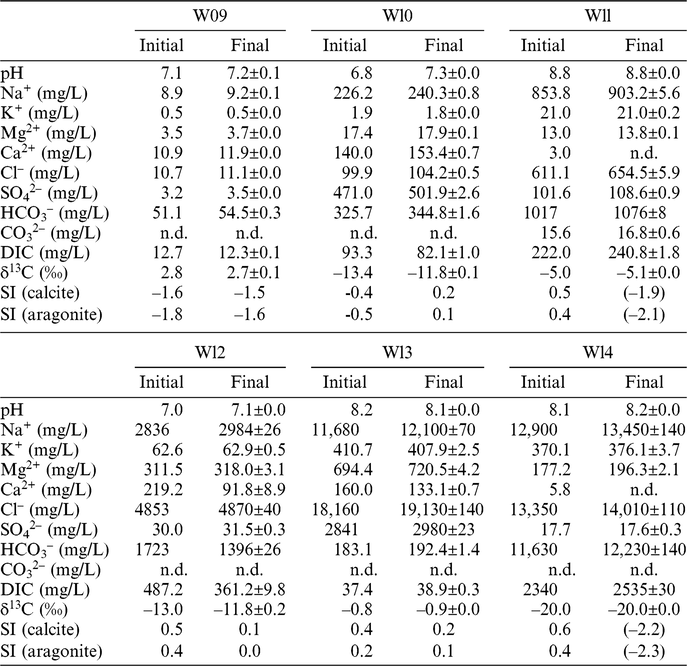
Initial (n = 1) and final (n = 12) chemical features of samples W09–W14 at the elapsed days of ~15 and ~1000, respectively. The errors are given as standard deviations across 12 batches of storage bottles. The saturation index (SI) values, in parentheses, were calculated assuming a Ca2+ concentration of 0.1 mg L–1.
n.d. = not detected.
The reagents (Table 1) were dissolved and mixed in ~10 L of Milli-Q water, inside a 22 L plastic container, and then diluted with Milli-Q water reaching a total volume of 22 L. The solutions were homogenized using a magnetic stirrer for >3 hr, and then left to stand overnight. The precipitates which accumulated in sample W12 during this time were redissolved in the solution by further stirring. Each solution was dispensed by siphoning into a 250 mL PAN bottle (full filling amount = ~310 mL), leaving no headspace. We prepared 66 bottles for each comparison water. All of the bottles were stored in a dark room (~20ºC) until use.
INTER-BATCH HOMOGENEITY
Inter-batch homogeneity was assessed by determining the chemical compositions and δ13C values for 12 samples chosen randomly from the PAN bottle batches. The samples were analyzed by ion chromatography (Dionex ICS-2100, Thermo Fisher Scientific) and an isotope-ratio mass spectrometer (IRMS) coupled with a gas chromatography system (GC–IRMS; Delta-V Advantage with GasBench II, Thermo Fisher Scientific), at the Geological Survey of Japan. Measurement errors were lower than ±10% for the chemical composition, ±2% for the DIC concentration, and ±0.1‰ for the δ13C.
Standard deviations for chemical compositions and δ13C values after storage (~1000 days) were <1% and <0.1‰, respectively (Table 2). We concluded that the inter-batch homogeneity was high enough to allow an intercomparison.
MONITORING OF SAMPLE STABILITY
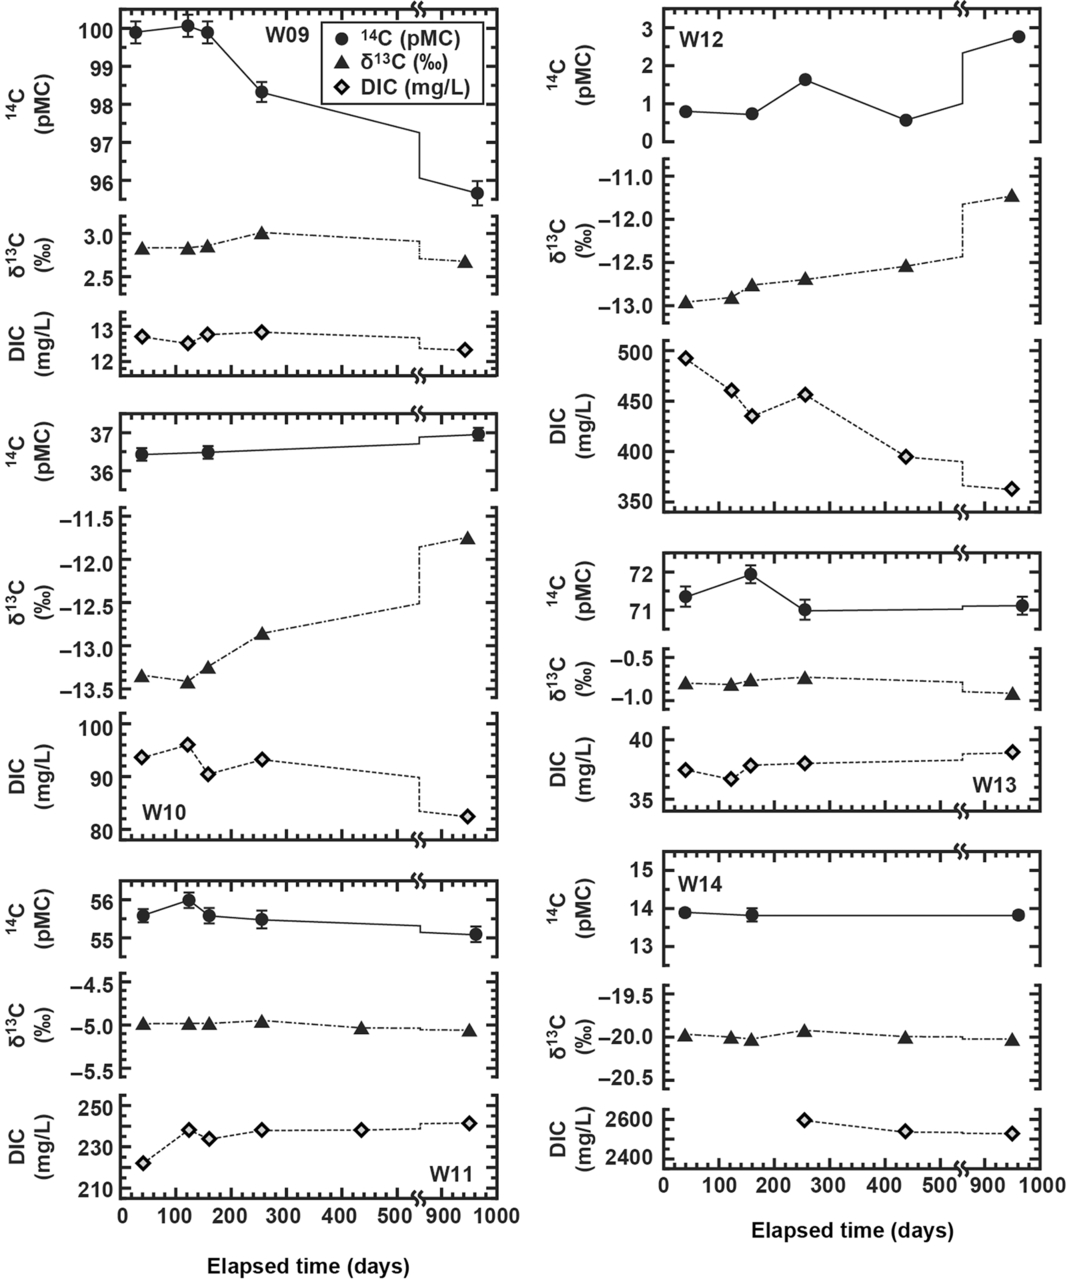
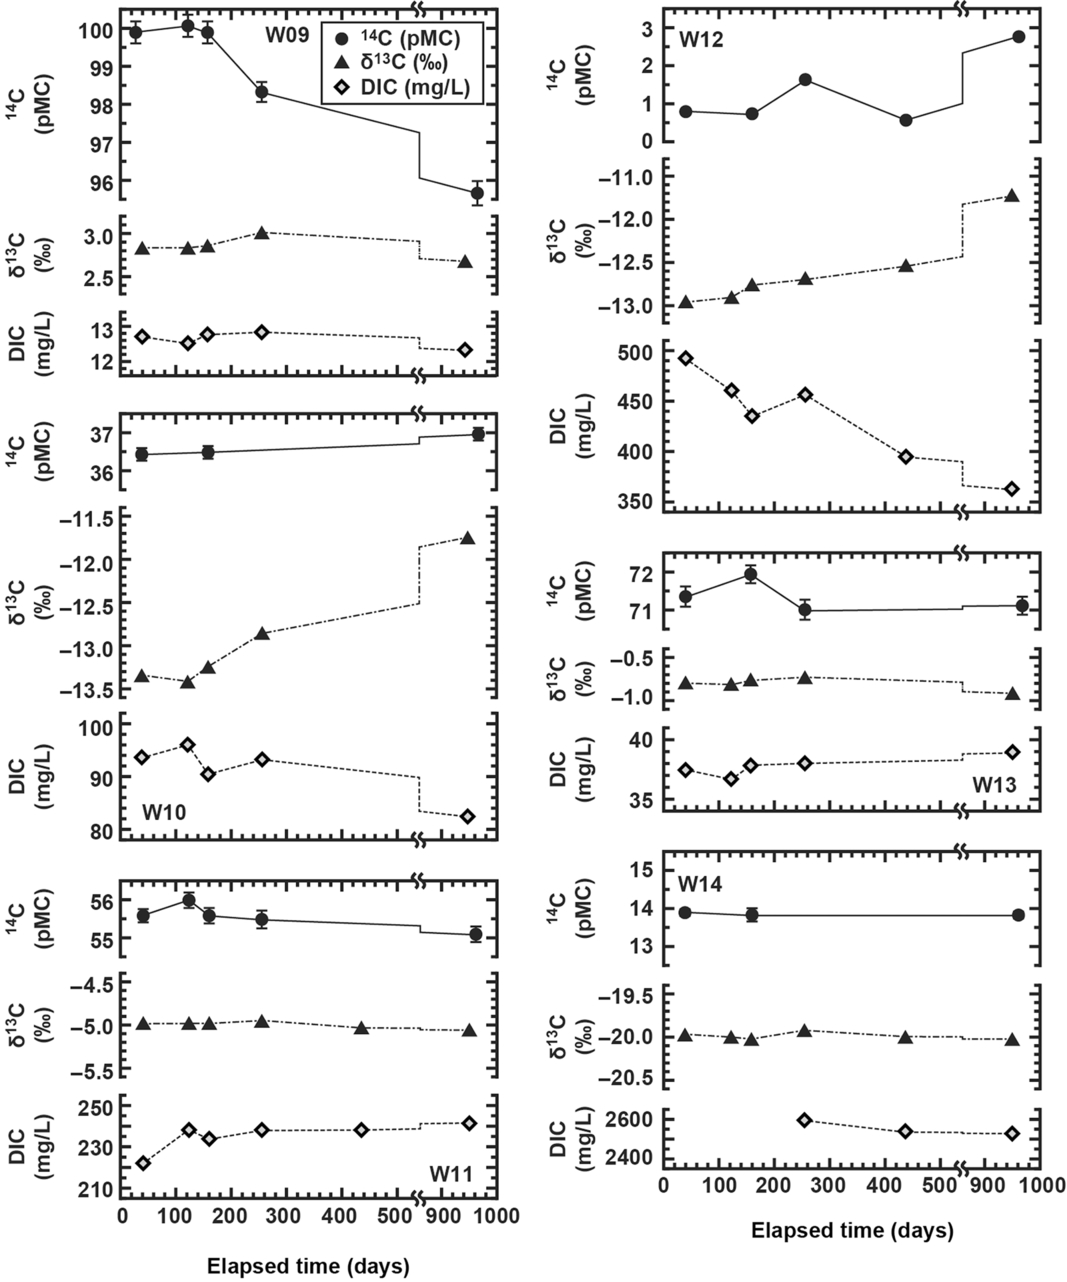
The stability of the intercomparison water samples was assessed by monitoring DIC, 14C, and δ13C values during storage. The δ13C and DIC values were determined by GC–IRMS as described above. CO2 was extracted from water samples by a headspace gas-purge procedure (Torres et al. Reference Torres, Mix and Rugh2005; Molnár et al. Reference Molnár, Hajdas, Janovics, Rinyu, Synal, Veres and Wacker2013) in order to measure 14C. The sample water was injected into a pre-evacuated glass bottle containing H3PO4 sealed by a butyl rubber septum using syringe. The CO2 released in the head-space of the glass bottle was purged and the carrier gas transferred the CO2 to the vacuum line through a needle. Afterwards, the CO2 gas was purified cryogenically and reduced to graphite with hydrogen gas (Kitagawa et al. Reference Kitagawa, Masuzawa, Makamura and Matsumoto1993) to make 14C measurement targets. We measured the 14C contents at two accelerator mass spectrometry (AMS) facilities, Nagoya University and National Institute for Environmental Studies (NIES), relative to NIST oxalic acid (HOx-II) and corrected it for isotopic fractionation using the 13C/12C measurements in each of the AMS systems. Corresponding results are shown in Figure 1, while the chemical features are given in Table 2.
Results of the stability monitoring for 14C (circles), δ13C (triangles), and DIC concentration (diamonds).
Takahashi et al. (Reference Takahashi, Minami, Aramaki, Handa and Matsushita2019) reported that, when DIC concentration was relatively high (~200 mM), the 14C content of a NaHCO3 solution stored in a PAN bottle was stable over periods of up to 900 days, even if the 14C content was very low (approximating the 14C-free level). However, when DIC concentration was low (~2 mM), the 14C concentration increased from 0.6 to 1.8 pMC. Because of the low storage PAN bottle performance, it is difficult to prepare comparison water having very low DIC and 14C concentrations.
During storage, samples W09 and W12 showed significant changes in their 14C and DIC concentrations. The reasons for the decrease in 14C concentration of W09 is uncertain; possibly, it was triggered by air-exchange between the storage room (low 14C; atmospheric 14CO2 was lower than global levels; Takahashi et al. Reference Takahashi, Konohira, Hiyama, Minami, Nakamura and Yoshida2002) and the sample. The change in 14C concentration observed for W12 was almost identical to the increase seen during the performance test in a PAN bottle (Takahashi et al. Reference Takahashi, Minami, Aramaki, Handa and Matsushita2019). The results suggested that W12 should not be used in the intercomparison.
The concentrations of most chemical species remained constant within the margin of error (error = ±10%) during storage (Table 2). Nevertheless, Ca2+ and DIC concentrations decreased in samples W10, W12, and W13, while Ca2+ was not detectable in samples W11 and W14 after storage. Moreover, a precipitate was found in sample W12 after storage. We measured 14C and δ13C values of the precipitate by AMS and IRMS with dual inlet system (Delta-V advantage) to be 0.8 pMC and −8.5‰, respectively. The 14C content of the precipitate was identical with that of DIC in W12 (Figures 1 and 2), indicating that the carbonate mineral was directly precipitated from DIC of W12. The x-ray diffraction analysis (CuKα; Rigaku MiniFlex) of the precipitate indicated the presence of CaCO3 (aragonite) and MgO; perhaps, the relatively high concentration of Mg2+ in the sample induced the precipitation of aragonite (Burton and Walter Reference Burton and Walter1987). No precipitates were found in the other samples, although W10 and W12 displayed significant chemical and δ13C changes during storage (Table 2; Figure 1). Likely, some calcite precipitated at the invisible scale in low-Mg2+ solutions (e.g., W10, which showed an increase in the saturation index of carbonate minerals).
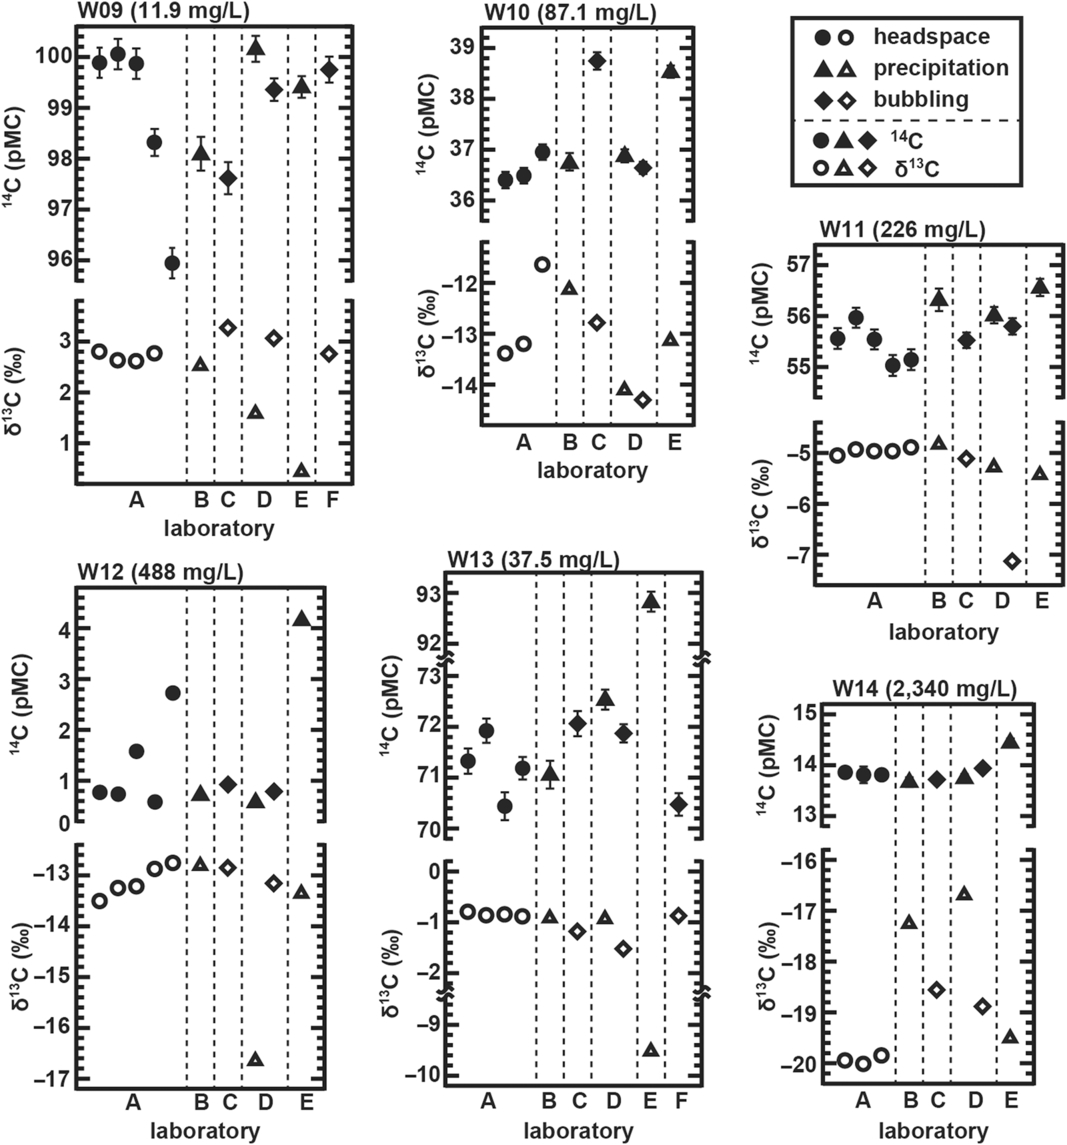
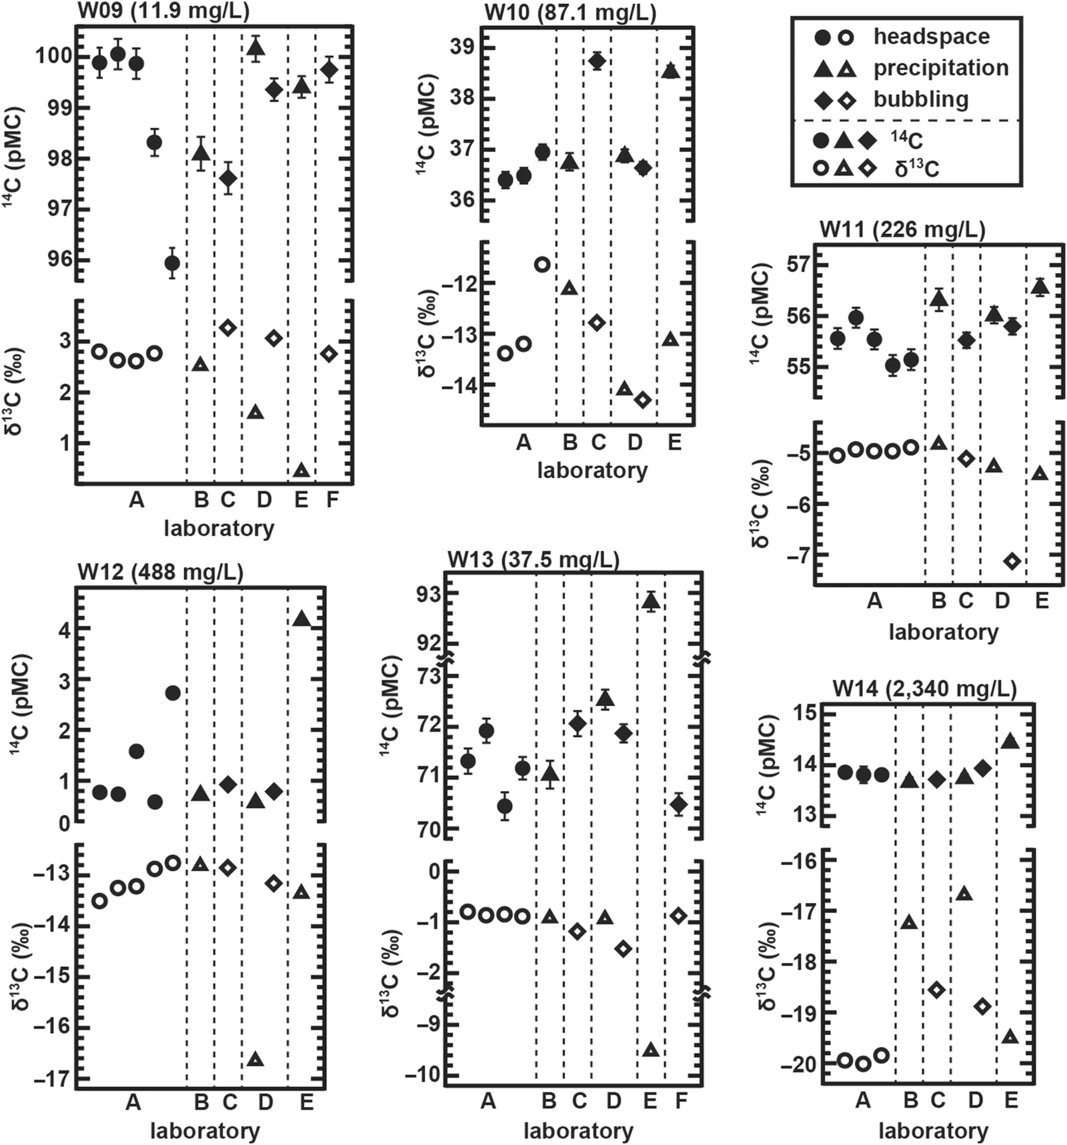
Results of the intercomparison exercise involving laboratories A–F: 14C (solid symbols), δ13C (open symbols). CO2 extraction procedures: headspace-gas purging (circles), carbonate precipitation (triangles), gas bubbling (diamonds). The treatment periods were different between laboratory A (27–976 elapsed days; Figure 1) and the other laboratories (378–431 elapsed days). The 14C concentrations of some samples from laboratory A indicated secular changes (Figure 1), and therefore, a notice is necessary for the comparison of results from laboratory A with those from the other laboratories.
Samples W10 and W12 showed decreases in DIC concentration and increases in δ13C values. The isotopic mass-balance estimations suggested that the δ13C values, corresponding to the carbon removed from the W10 and W12 solutions, were −23‰ and −16‰, respectively. These values were much lower than that of precipitate (aragonite) found in sample W12. Therefore, the change in δ13C for W12 is caused by not only precipitation but also by other processes. The pH values of samples W10 and W12 were lower than those of other samples with higher carbonate saturation index (SI) values (Table 2). The relatively high SI values and low pH condition likely caused DIC changes during storage; waters with higher pH were apparently more stable. In conclusion, in order to maintain maximum stability, the intercomparison samples should not have very low DIC and 14C values, while pH should be >8.
TRIAL INTERCOMPARISON
The water samples prepared in this study had to be tested to determine whether they can be used in the intercomparison program. A trial intercomparison campaign was undertaken by six laboratories (laboratories A–F), in order to reveal possible problems. A set of six water samples was delivered to each laboratory. The CO2 extraction, purification and graphitization processes were performed using usual procedures of respective laboratories. CO2 extraction was done in three different procedures: by carbonate precipitation (laboratories B, D, and E), gas bubbling (laboratories C, D, and F), and headspace-gas purging (laboratory A). The precipitation method involved the addition of BaCl2 or SrCl2 to the water sample to trigger the precipitation of carbonates, and the addition of H3PO4 to release CO2 (Haynes and Haas Reference Haynes and Haas1980; Drimmie et al. Reference Drimmie, Aravena, Wassenaar, Fritz, Hendry and Hut1991; Aucour et al. Reference Aucour, Sheppard, Guyomar and Wattelet1999). The bubbling procedure followed the procedure in the WOCE program (Dickson et al. Reference Dickson, Sabine and Christian2007): the CO2 gas was extracted from acidified water by bubbling it with a carrier gas. The extracted CO2 gas was then cryogenically purified in a vacuum line. The graphitization procedure of all participating laboratories followed that described in Kitagawa et al. (Reference Kitagawa, Masuzawa, Makamura and Matsumoto1993). The 14C content was measured by five AMS facilities in Japan: Nagoya University, JAEA-Tono, NIES, Paleo Labo Co. Ltd., and Institute of Accelerator Analysis Ltd.; isotopic fractionation was corrected using the 13C/12C measurements in each of the AMS systems. The δ13C values were determined by IRMS with a dual inlet system using purified CO2.
Across all laboratories, most of the 14C results were consistent, although there were large variations in 14C and δ13C at low DIC (sample W09) and 14C (sample W12) concentrations. The results suggested that waters with low DIC content were probably susceptible to the carbon contamination during the CO2 extraction process. Sample W14 presented a wide range of δ13C values, whereas its 14C contents were relatively similar across the laboratories. High DIC concentrations of W14 could cause carbon isotopic fractionation during the CO2 extraction and purification processes, because of very small amount (less than 1 mL) of water used. The target range of DIC concentrations varied among laboratories: some of them could not treat such a small amount of water.
Samples W10 and W13 had the highest SO4 2– concentrations. The effect of SO4 2– on the δ13C measurements became appreciable when the mole fraction of CO3 2− in the precipitate BaCO3/(BaCO3+BaSO4) was <0.3, due to low carbon recovery (Kusakabe Reference Kusakabe2001). Conversely, at high SO4 2– concentrations, there was a positive shift in δ13C values; this was caused by the occurrence of isotopic fractionation during precipitation. The 14C content was not expected to be affected in this case. However, the 14C data results for W10 and W13 from laboratories C and E, obtained through precipitation, differed significantly from other samples (Figure 2). Possibly, the low carbon recovery accentuated the contamination of modern carbon. Across all laboratories, the 14C results for W13 varied quite a lot, regardless of the technique used. Perhaps, high SO4 2– concentrations impeded the CO2 extraction and graphitization processes. The δ13C values obtained through precipitation procedure tended to deviate from other results, regardless of SO4 2– concentrations (Figure 2).
CONCLUSION
The proposed procedure for preparing of intercomparison water samples was suitable for radiocarbon intercomparison, although care must be taken in the selection of chemical reagents type and amount. The pH and the carbonate saturation index of the solution can affect sample stability: for pH >8, 14C and DIC contents remained stable, even with oversaturation of carbonate minerals. The variability of 14C and δ13C results was larger for waters with low DIC and/or high SO4 2– concentrations.
ACKNOWLEDGMENTS
The authors thank Prof. Emeritus Toshio Nakamura of Nagoya University and Mr. Masaaki Takahashi of the Geological Survey of Japan for their help with the AMS and ion-chromatography measurements, respectively. This study was financially supported by a JSPS KAKENHI (Grant-in-Aid for Scientific Research C 26340017) and partly carried out by the joint research program of the Institute for Space-Earth Environmental Research, Nagoya University.