1. Introduction
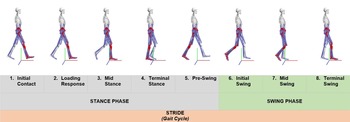
The human gait cycle is evolved and depicted as a cyclic movement of lower limbs during the human walk. The human gait process is a consequence of a continuous improvement in human motor abilities by a constant interaction with the environment, and it gradually improves with experience. However, with ageing, humans tend to lose dexterity in many acquired abilities, including the gait. One gait cycle (also called stride) can be divided into two phases: the stance phase and the swing phase. The stance and the swing phase roughly constitute 60% and 40% of one gait cycle time, respectively. These phases can further be divided into five and three subphases, respectively (see Fig. 1). Each subphase is a unique atomic activity. These activities, when performed again and again, in conjunction, constitute the human locomotion [Reference Semwal and Nandi1]. The study of human locomotion is termed as human gait analysis.
Phases in a gait cycle.

Human gait analysis has numerous applications in areas such as robotics [Reference Semwal, Kumar, Mishra and Nandi2], Healthcare [Reference Jarchi, Pope, Lee, Tamjidi, Mirzaei and Sanei3], biometrics [Reference Semwal, Raj and Nandi4], human activity recognition (HAR) [Reference Lara and Labrador5], rehabilitation, sports [Reference Semwal and Nandi1], and Biomedical engineering [Reference Semwal and Nandi6]. The study and development of a bipedal robot require comprehensive domain knowledge of human gait, as our ultimate goal here is to mimic a human-like walk. With the current state of the art, biped robots are still confined to closed laboratory spaces and work environments where their movement is restricted and well-defined. The development of a stable biped robot walk outside of a laboratory is still an open research area [Reference Semwal, Katiyar, Chakraborty and Nandi7]. It poses a challenging research problem of postural stability, push recovery [Reference Semwal and Nandi8], terrain recognition, obstacle detection, to name a few. With so many challenges, biped robotics is truly an interdisciplinary area of research and requires expertise from every walk of life. In Healthcare, neurological conditions, such as attention deficit hyperactivity, depression, Alzheimer’s disease, and Parkinson’s disease (PD), affect the motor control of a person resulting in a measurable difference in a person’s gait [Reference Jarchi, Pope, Lee, Tamjidi, Mirzaei and Sanei3]. Freezing of gait is one such disorder that results from PD [Reference Torvi, Bhattacharya and Chakraborty9]. Hence, long-term monitoring of the subject’s gait becomes essential in these scenarios. Gait biometrics is yet another emerging area of research that requires human gait analysis. Human gait is considered a unique biometric identity and hence can be used for non-invasive authentication [Reference Deb, Ou Yang, Chua and Tian10] and surveillance purposes. Human gait analysis also has applications in gait event detection [Reference Torrealba, Cappelletto, Fermıın-Leoın, Grieco and Fernandez11], gait parameter estimation [Reference Hannink, Kautz, Pasluosta, Gasmann, Klucken and Eskofier12], and HAR for the identification of lower extremity activities [Reference Jain, Semwal and Kaushik13] such as level walking, walking upstairs, walking downstairs, jogging, and running. Further, in Biomedical engineering, gait analysis helps in prosthetic leg design for rehabilitation [Reference Semwal and Nandi6]. The applications of human gait analysis can further be extended to the domain of edge computing [Reference Shi, Cao, Zhang, Li and Xu14]. The edge computing paradigm can prove to be of immense benefits to wearable Healthcare technology and gait rehabilitation. As more and more data are generated using wearable sensors, it becomes far more meaningful to process the data on device instead of sending it to the cloud server. This on-device inference capability will provide excellent responsiveness and privacy and reduce the energy cost associated with wireless communication. One such emerging area in edge computing is tinyML [Reference Banbury, Reddi, Lam, Fu, Fazel, Holleman, Huang, Hurtado, Kanter, Lokhmotov, Patterson, Pau, Sun Seo, Sieracki, Thakker, Verhelst and Yadav15]. The goal of tinyML is to bring the capabilities of machine learning (ML) to ultra-low-power devices. This on-device ML capability can prove to be a boon in HAR and long-term monitoring of human gait, which is essential in Healthcare and rehabilitation.
There are two ways in which gait data can be collected and interpreted. These are sensor-based methods and video-based methods [Reference Deb, Ou Yang, Chua and Tian10]. In sensor-based methods, devices such as inertial measurement units (IMUs), force plates, optical sensors (e.g., LiDAR, Microsoft Kinect), magnetic sensors, and instrumented treadmills are used for gait data collection. In comparison, video-based methods utilize video cameras and other imaging devices. Both methods have their advantages and limitations based on the application; however, sensor-based methods are preferred when the study involves the kinematics and the dynamics of human locomotion, which is somewhat hard to measure using video sequences. Inertial sensors, more commonly known as IMUs [Reference Jarchi, Pope, Lee, Tamjidi, Mirzaei and Sanei3], are commonly used for capturing human gait data. IMUs are electronic devices that consist of an accelerometer and gyroscope, and sometimes a magnetometer. They come in various form factors and can easily be placed at different body parts of the subject without hindering their normal daily activities. IMUs basically quantify human locomotion in terms of acceleration forces (
 $\mathrm{m/s}^{2}$
) and angular velocity (rad/s). Most modern smartphones and wearables are now equipped with inertial units that are on par with dedicated equipment when it comes to performance and reliability.
Stride segmentation is the most fundamental task when we analyse inertial gait data. Stride segmentation can be defined as segmenting the continuous inertial data into stride-specific information [Reference Hannink, Kautz, Pasluosta, Gasmann, Klucken and Eskofier12], that is, individual gait cycles. Further, one gait cycle time (stride duration) is defined as the time elapsed between two consecutive heel strikes (HSs) of the same foot [Reference Jarchi, Pope, Lee, Tamjidi, Mirzaei and Sanei3]. These extracted stride-specific data can later be interpreted in multiple ways, for example, in training a deep learning model for gait parameter estimation [Reference Hannink, Kautz, Pasluosta, Gasmann, Klucken and Eskofier12], HAR task, for biometric authentication, or in gait event detection. Stride segmentation of inertial sensor data is a challenging task as data are continuously recorded in both space and time domain, and there is no demarcation as such is present in the data. This task becomes further complicated if a subject performs a variety of lower extremity activities during this sensing phase. The challenge lies in identifying stride boundaries, which further magnify if there is noise present in the data. Many techniques are suggested in the literature for stride segmentation of inertial sensor data, which are discussed in the next section.
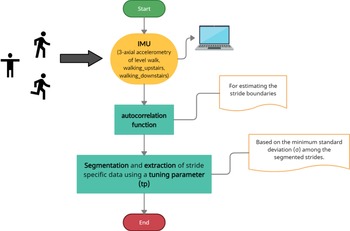
In this study, we have proposed a statistical method for automatically identifying and extracting stride-specific data from the accelerometry of three different walking activities by exploiting the cyclic nature of the human walk. The autocorrelation function (ACF) was utilized for estimating the stride boundaries. Further, a tuning parameter (
 $t_{p}$
) was utilized for improving upon this estimation by adjusting the stride boundaries and ultimately extracting the stride-specific data. The proposed stride segmentation framework is shown graphically in Fig. 2.
A graphical flowchart depicting the proposed stride segmentation framework.

Author’s contribution: Our key contributions are stated as follows:
-
1. Model design: We have proposed an automatic technique for carrying out stride segmentation on inertial sensor data. This technique employs an ACF, is invariant of device placement, and can be realized right inside a wearable sensor. This statistical technique utilizes a tuning parameter (
 $t_{p}$
) that performs the adaptive thresholding using standard deviation (
$\sigma$
) measure. With this, it automatically adjusts to each individual’s walking speed and pattern without the need for manual intervention. We tested this technique on three different lower extremity activities, viz. level walking, walking upstairs, and downstairs, on two different benchmark datasets.
-
2. Pre-processing of data: The received human activities and postural transition (HAPT) [Reference Reyes-Ortiz, Oneto, Samà, Parra and Anguita16] and (Osaka University — Institute of Scientific and Industrial Research (OU-ISIR)) [Reference Ngo, Makihara, Nagahara, Mukaigawa and Yagi17] gait inertial sensor datasets already contained pre-processed accelerometer and gyroscope signal sequences. However, we did further pre-processing on the HAPT dataset by applying cubic spline interpolation.
-
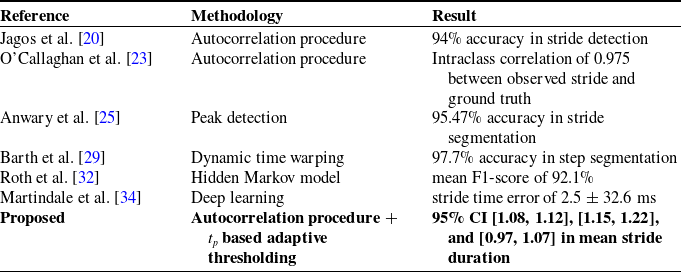
3. Performance measure: The technique has been validated through rigorous experimentation performed on the HAPT and OU-ISIR datasets. Our technique has reported a mean stride duration of 1.1, 1.19, and 1.02 s with 95% confidence interval (CI) [1.08, 1.12], [1.15, 1.22], and [0.97, 1.07] for level walking, walking upstairs, and walking downstairs, respectively. The standard benchmark findings reported in the literature are 0.98–1.2 s for level walking, 1–1.1 s for walking downstairs, and 0.9–1.1 s for walking upstairs, which are consistent with our obtained results.


The rest of the study is organized as follows. In Section 2, we have discussed the previous work done in the stride segmentation of inertial sensor data. In Section 3, we have discussed the steps associated with the data collection, data pre-processing, model design, and performance evaluation. In Section 4, we have discussed the experimental results and the validation methods. In Section 5, the authors conclude.
2. Related work
A considerable amount of research has been done in the field of stride segmentation of human gait data. The methods generally differed in the sensing modality being adopted for gait data collection. For the scope of this manuscript, we are discussing only those methods which have utilized inertial sensor data. Factors such as availability, affordability, and portability of IMUs have driven the focus of researchers towards IMU-based gait analysis as it cuts the requirement of complex laboratory set-up and expensive equipment.
Stride segmentation of inertial sensor data is a popular research domain, and many different approaches have been proposed to solve this problem. These methods can be broadly classified as (a) statistical methods, (b) dynamic time warping-based methods, (c) hidden Markov model (HMM)-based methods, and (d) deep learning-based methods. We have tried our best to provide an initial review of all the different approaches. Also, we do not intend to provide a comparative analysis here; however, an interested reader can go through the article by Brajdic et al. [Reference Brajdic and Harle18] for a critical analysis of different approaches.
Statistical methods exploit the inherent statistical features present in the gait data to estimate the start and end of a gait cycle. Many approaches search for stance and swing phase individually instead of a complete stride; however, the underlying principle remained the same. The fundamentals of the autocorrelation procedure for estimating gait parameters were demonstrated by Moe-Nilsssen et al. [Reference Moe-Nilssen and Helbostad19]. Authors have suggested using an unbiased autocorrelation procedure that solved the amplitude attenuation problem (present in biased autocorrelation) as lag parameter k increases. However, the main limitation of the unbiased autocorrelation estimate was that the variance increases for large values of lag parameter k. Jagos et al. [Reference Jagos, Reich, Rattay, Mehnen, Pils, Wassermann, Chhatwal and Reichel20] have used the autocorrelation procedure on eSHOE data. eSHOE is a wearable mobile motion analysis system. Underneath, it comprises a three-axes accelerometer and a three-axes gyroscope. They have claimed to obtain a 94% accuracy in detecting all observed gait cycles in acceleration force signal along the anterior–posterior body axis. Lueken et al. [Reference Lueken, Ten Kate, Batista, Ngo, Bollheimer and Leonhardt21] have proposed a stride segmentation approach on inertial sensor data using a peak detection algorithm. Their approach is a five-stage method in which they performed signal and statistical analysis to isolate peaks. They validated their approach on Physionet gait inertial sensor dataset. They claimed to have achieved an F1-measure of 95.5% in peak detection. Yang et al. [Reference Yang, Hsu, Shih and Lu22] have proposed a real-time gait parameter estimation method using the autocorrelation procedure. They implemented an autocorrelation procedure right inside of an embedded wearable system for estimating cadence, step regularity, stride regularity, and step symmetry from trunk accelerometry in real time. They validated their approach on gait data of five PD patients and five healthy subjects. Torrealba et al. [Reference Torrealba, Cappelletto, Fermıın-Leoın, Grieco and Fernandez11] have proposed an automated statistics-based gait event detector algorithm. They have used a prosthesis instrument comprised of a biaxial accelerometer fixed at the knee and ankle of the subject. This technique detects the periodic spike pattern during walking and applies a threshold on accelerometer signals to isolate the spikes automatically. This method is independent of the walking speed. O’Callaghan et al. [Reference O’Callaghan, Doheny, Goulding, Fortune and Lowery23] have proposed an autocorrelation-based adaptive gait segmentation algorithm for walking bout detection on inertial sensor data. They tested their algorithm on data collected for the walking activity of 15 healthy subjects, at their self-selected speeds, and on pathological data of 1 PD subject. They claimed to have obtained an intraclass correlation of 0.975 on the bouts onset/offset times calculated using the algorithm and the ground truth. The same was obtained as 0.663 for the PD subject. Gill et al. [Reference Gill, Seth and Scheme24] have proposed a multi-sensor-matched filter approach that was used in conjunction with angular rate reversal and peak detection technique for segmenting gait events, including assisted gaits. They collected assisted gait data of 30 healthy participants who were instructed to walk using an instrumented cane at a self-selected speed on different terrains. They evaluated the algorithm by comparing the results with the results obtained by the human expert. Anwary et al. [Reference Anwary, Yu and Vassallo25] have provided a method for gait analysis by finding an optimal foot location for placing the IMU. They did so by analysing the IMU’s output by placing it on different foot locations and calculating the various gait parameters. They then applied a peak detection approach for stride identification using a MATLAB built-in function (findpeaks). With this, they isolated all the mid-stance phases in the accelerometer and gyroscope data. Using this approach, they claimed to extract all the strides with 95.47% and 93.60% accuracy from accelerometer and gyroscope data, respectively. Sun et al. [Reference Sun, Zang, Gravina, Fortino and Li26] have proposed a gait-based identity recognition method for elderly people. The gait of elders is less pronounced due to various walking inconsistencies due to different age-related factors resulting in a left-right gait asymmetry. They proposed a multiple-matching algorithm to tackle this problem. For this, they constructed a gait template using both the cycle-based method and the fixed-length method. In cycle-based methods, the signal cycles are extracted by detecting the minimum points in the principal components’ analysis (PCA) signal. The length normalization of extracted cycles is performed using cubic spline interpolation. For fixed length-based methods, fixed-length data are extracted from the signal for template construction. The authors have found that the recognition rate of cycle-based methods was higher than that of fixed length-based methods. Qiu et al. [Reference Qiu, Wang, Zhao and Hu27] have presented a method for measuring and evaluating human lower limb motions using distributed wearable sensors. They performed the gait cycle segmentation by employing peak detection and zero velocity updates (ZUPT). They detected the four phases of the gait cycle individually viz. HS, flat foot (FF), heel off (HO), and swing (SW) by observing the periodic spikes in angular velocity and acceleration values. The stance phase is characterized by a near-zero angular velocity and a constant acceleration where the ZUPT criterion is applied.
Dynamic time warping is another popular approach for performing stride segmentation. Although these methods are robust, they are not truly automated in the sense that they require a predefined reference template that has to be manually constructed, which also introduces a significant computational overhead. Rampp et al. [Reference Rampp, Barth and Schülein28] have presented an approach for gait parameter estimation. Using a shoe-mounted inertial sensor, they collected gait data and performed stride segmentation using a subsequent dynamic time warping method. The segmented strides are then analysed for gait parameter estimation. They validated their approach using GAITRite-based gait parameters and found a correlation in stride length and stride time of 0.93 and 0.95, respectively, between both systems. Barth et al. [Reference Barth, Oberndorfer, Kugler, Schuldhaus, Winkler, Klucken and Eskofier29] have proposed a subsequence dynamic time warping-based automated step segmentation method for segmenting gyroscope signals. They first generated a step reference template using a peak detection algorithm, and then they applied subsequence dynamic time warping for extracting steps using this generated reference pattern. They validated their approach on gait data of 35 healthy subjects and 10 patients with PD. They claimed an accuracy of 97.7% in this step segmentation approach. Further, four subjects were asked to perform different daily life activities for which the step detection accuracy achieved was 86.7%. In their other work, Barth et al. [Reference Barth, Oberndorfer, Pasluosta, Schülein, Gassner, Reinfelder, Kugler, Schuldhaus, Winkler, Klucken and Eskofier30] have proposed a multi-dimensional subsequence dynamic time warping approach for searching stride patterns from a predefined stride template. The stride template was constructed by manually labelling each stride from a straight 40-m walk test and a video-monitored free walk sequence. They claimed to achieve an F-measure of 98% for 40-m walk tests and 97% for free walk tests.
HMMs provide a foundation for making probabilistic models for linear sequence labelling tasks [Reference Eddy31]. They have applications in time series analysis, such as speech recognition and gait analysis. Roth et al. [Reference Roth, Küderle, Ullrich, Gladow, Marxreiter, Klucken, Eskofier and Kluge32] proposed HMM-based stride segmentation approach. They evaluated the performance of their method on a free-living evaluation dataset consisted of 146 labelled strides of 28 PD patients. The proposed approach achieved a mean F1 score of 92.1%. Liu et al. [Reference Liu, Wang, Li, Liu, Qiu, Zhao and Guo33] have proposed a method for gait phase detection on inertial sensor data using the HMM. They validated their approach on gait data of 16 individuals collected using a wearable sensor attached to the subject’s toe.
Deep learning algorithms utilize an existing knowledge base for making predictions on unknown scenarios. Preparing a deep learning model to perform stride segmentation requires training on an existing dataset with labels defining stride boundaries. Although this is a one-time task, preparing a labelled dataset is a tedious task. Further, for the model to be generalized, it should be trained on a vast and diverse dataset of labelled strides to incorporate the inconsistencies that occur during typical day-to-day walking activity. Martindale et al. [Reference Martindale, Christlein, Klumpp and Eskofier34] have proposed a multi-task recurrent neural network for segmenting inertial sensor data in addition to recognizing activities and cycles. Three benchmark datasets were utilized for performance analysis, namely FAU-Gait, Kluge, and MAREA inertial gait datasets. Authors have claimed to achieve a stride time error of 2.5 ± 32.6 ms for walking activity and an F1-score of 92.6% for activity detection and 98.2% for phase detection.
3. Methodology
3.1. Data collection and set-up
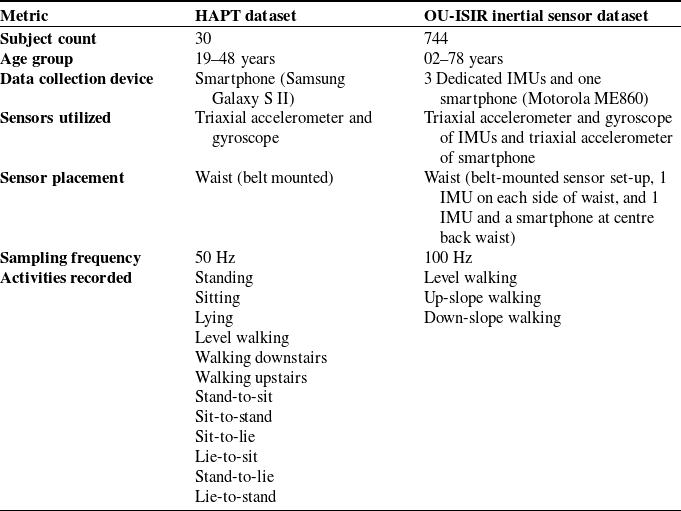
All experiments are performed in MATLAB on two standard gait inertial sensor datasets, viz. HAPT [Reference Reyes-Ortiz, Oneto, Samà, Parra and Anguita16] and OU-ISIR [Reference Ngo, Makihara, Nagahara, Mukaigawa and Yagi17]. Both the datasets consist of three-axial accelerometer and three-axial gyroscope signals captured for different activities as mentioned in Table I. For the scope of this manuscript, we have only utilized the triaxial accelerometry data of activities: level walk, walking upstairs, and walking downstairs from HAPT dataset and of the level walk from OU-ISIR dataset. The HAPT dataset is collected using a smartphone’s built-in IMU at a sampling frequency of 50Hz, whereas the OU-ISIR dataset is collected using three dedicated IMUs and a single smartphone at a sampling frequency of 100 Hz, out of which we have only utilized the data of sensor mounted on the centre back waist of the subject. A detailed description of the datasets is given in Table I.
Detailed description of HAPT and OU-ISIR gait datasets.

3.2. Data pre-processing
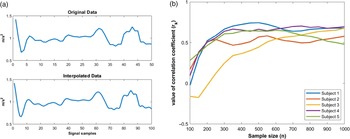
The data provided to us were already pre-processed. The only pre-processing step we did was to perform the cubic spline interpolation on the HAPT dataset. The purpose of this interpolation step was to fulfil two objectives: (1) smoothing of data and (2) to make sampling frequency of HAPT dataset to be comparable to that of OU-ISIR dataset (see Fig. 3(a)). The reason for using cubic spline interpolation is that the resulting polynomial is smoother and has a smaller error compared to other interpolating polynomials like Lagrange or Newton polynomial. After the interpolation step, we extracted the subject and activity-specific accelerometry data from the datasets. We extracted all the 30 subjects data from the HAPT dataset for the activities denoted by the vector Activity
 $ (level\_walking, walking\_upstairs, walking\_downstairs)$
. Similarly, for the OU-ISIR dataset, we randomly chose 30 subjects and extracted the data for the activities denoted by the vector Activity
 $(level\_walking)$
.
(a) Cubic spline interpolation on HAPT dataset, (b) variability of ACF coefficients with sample size (n) (HAPT dataset).

3.3. Model design
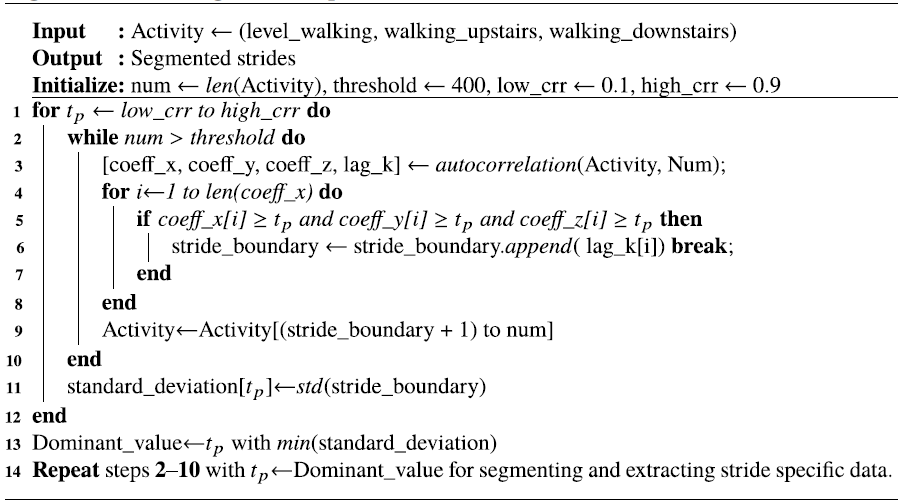
Algorithm 1 describes our proposed stride segmentation methodology. We used the autocorrelation procedure in conjunction with a tuning parameter
 $t_{p}$
. The purpose of
 $t_{p}$
is threefold: (1) to consider all the three axes of the accelerometer, (2) to adjust the stride boundaries using adaptive thresholding, and (3) to reduce the intraclass variance so that all the extracted strides are consistent with each other. The algorithm begins by initializing the variables viz. num, threshold, low_crr, and high_crr. The reason for keeping the value of threshold as 400 is explained later in Section 4. The adaptive thresholding is achieved by varying the value of
 $t_{p}$
in the range low_crr = 0.1 and high_crr = 0.9. These values represent the positive correlation spectrum and thus enable the
 $t_{p}$
in adjusting the stride boundaries.
Stride segmentation procedure for inertial sensor data

In a typical day-to-day walking scenario, each stride could be of varying length due to factors such as speed variation and terrain. To incorporate this, we identified all the strides individually, for each subject, by iteratively running the algorithm. After the identification of stride boundary, the corresponding lag k value is appended in the vector stride_boundary and the algorithm is applied again on the remaining data, as shown in steps
2
–
10
in algorithm 1, up to the threshold set using the threshold variable. This is done for different values of
 $t_{p}$
, as mentioned earlier, and the standard deviation is then calculated for each run for the identified stride boundaries. The value of
 $t_{p}$
for which the standard deviation is minimum is classified as the dominant_value, and all the strides boundaries identified using dominant_value are called stride segmentation points (
 $S_{p}$
). After the identification of
 $S_{p}$
, the stride-specific data can be extracted based on the values of
 $S_{p}$
available in the vector stride_boundary.
ACF, also known as serial correlation, is defined as the correlation of a signal with a delayed copy of itself as a function of delay. It is a mathematical tool for finding the repeating patterns in time series data. The autocovariance function at lag k for
 $0\leq{k}\leq{n}$
, where n is the sample size, is defined as:
 \begin{equation} S_k=\frac{1}{n}\sum_{i=1}^{n-k}(x_i-\bar{x})(x_{i+k}-\bar{x})\end{equation}
The sample ACF at lag k for
 $k\geq0$
, of the time series, is defined as:
 \begin{equation} r_k=\frac{S_k}{S_0},-1\lt r_k \lt +1\end{equation}
3.4. Performance evaluation
The stride duration (sd) or gait cycle time (in seconds) is calculated by dividing the stride segmentation point (
 $S_{p}$
) with the sampling frequency (f) of the sensing device as shown in Eq. (3). The algorithm is then evaluated by comparing the mean stride duration with the standard benchmark findings (refer to Table II) and establishing the CIs. The CIs were calculated by utilizing MATLAB’s in-built function fitdist, through which we fit a normal distribution over the mean stride duration data of all 30 subjects of the HAPT dataset.
 \begin{equation} sd = \frac{S_{p}}{f}\end{equation}
4. Results and discussion
In this section, we will discuss the experimental results and the validation approach we adopted to validate our proposed methodology.
Mean stride duration (in seconds).

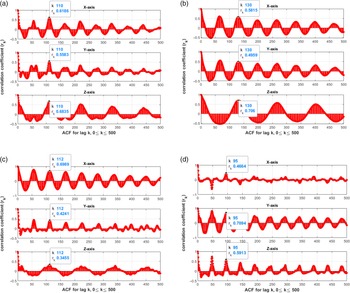
Plots depicting ACF versus lag k curves for different walking activities, (a) “level walking”, (b) “Walking upstairs”, (c) “Walking downstairs” for HAPT dataset, and (d) “level walk” for OU-ISIR dataset.

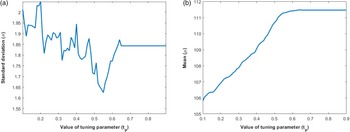
(a) Standard deviation versus
 $t_{p}$
curve, and (b) mean versus
 $t_{p}$
curve, obtained from a single subject’s gait data (HAPT dataset).

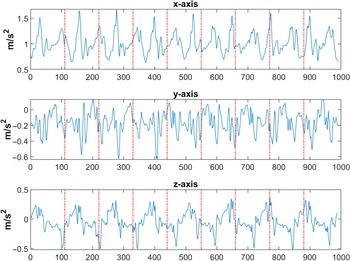
Segmentation of raw accelerometer signals into multiple strides for a sample of size
 $n=1000$
. Red line is depicting the position of stride segmentation point (
 $S_{p}$
) denoted by the vector
 $stride\_boundary=(110, 220, 330, 440, 550, 660, 770, 880)$
.

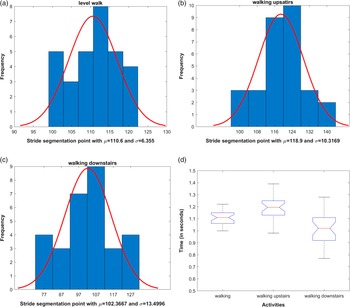
Histogram showing the distribution of mean stride length for different walking activities, (a) “level walking”, (b) “walking upstairs”, and (c) “walking downstairs”. (d) Box and whiskers plot depicting the mean stride duration for different walking activities (HAPT dataset).

Figure 4(a) shows the ACF versus lag k curve obtained from the level walking activity data of a single subject from the HAPT dataset. A high correlation of 0.61 is observed at lag k = 110 for all three axes of the accelerometry. Since the purpose of ACF is to find the repeating patterns in data and since the human gait is a cyclic event, we can conclude that the signal is repeating itself after lag k = 110. Again, a high correlation is obtained at other subsequent lag k intervals, as shown in Fig. 4(a). These lag k intervals for which there is a high ACF coefficient value are called dominant peaks [Reference Moe-Nilssen and Helbostad19]. The same is depicted for the activities walking upstairs and walking downstairs in Fig. 4(b) and (c), respectively.
Now, we are interested in that lag k value for which there is a dominant peak in all the three axes of the accelerometer. This dominant peak corresponding to the lag k value can now be interpreted as the stride boundary for that data. For this, we have used a tuning parameter (
 $t_{p}$
) as described in the previous section. The value of
 $t_{p}$
varies in the range 0.1–0.9, and the stride boundaries are identified based on different values of
 $t_{p}$
, as shown in Algorithm 1, and the stride-specific data are extracted based on the lag k value corresponding to this stride boundary. The value of
 $t_{p}$
for which the standard deviation (
 $\sigma$
) is minimum among all the extracted stride data, Fig. 5(a), will be used as the dominant value for that data, and all the strides are extracted based on this value. This process adjusts the stride boundaries. Figure 5(b) shows the variation in mean (
 $\mu$
) stride length with the value of
 $t_{p}$
. Here, stride length means the lag k value corresponding to the stride boundary. The extracted stride-specific data can now be interpreted as one complete gait cycle (stride). The segmentation step of raw accelerometer signals into multiple strides is shown graphically in Fig. 6. We took a sample of size
 $n=1000$
from the HAPT dataset for the activity level walking. The parameters calculated for this sample are as follows:
 $Dominant\_value=0.55$
(Fig. 5(a)), stride length = 110, and the vector
 $stride\_boundary=(110, 220, 330, 440, 550, 660, 770, 880)$
denoting the values of
 $S_{p}$
.
Using this approach, we identified stride lengths for all the 30 subjects of the HAPT dataset for the activities level walking, walking upstairs, and walking downstairs. A histogram is then plotted from the obtained mean stride length to visualize the data distribution as shown in Fig. 7(a), (b), and (c) for the activities level walking, walking upstairs, and walking downstairs, respectively. A global mean (
 $\mu_{g}$
) and standard deviation (
 $\sigma_{g}$
) are then calculated from the obtained data to estimate the mean stride length variability among the different subjects of the HAPT dataset. As evident from the histograms, using this approach, all the identified stride lengths for different subjects of the HAPT dataset are consistent with each other with minimum global standard deviation (
 $\sigma_{g}$
).
Comparative analysis of our proposed methodology with the existing approaches.

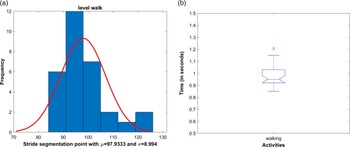
With the obtained mean stride length data, we have calculated stride duration for all the 30 subjects of the HAPT dataset using Eq. (3), which is depicted in the box and whiskers plot in Fig. 7(d). As evident from the results, the obtained data lie in the standard gait cycle time range [Reference Murray, Drought and Kory35, Reference Livingston, Stevenson and Olney36], hence validating our approach. Also, it is evident from the results that gait cycle time is not consistent for every person and is instead a variable quantity that varies in a particular range. This variation is because different persons have different walking styles, walking speeds, and anthropometric characteristics such as leg length, mass, and height. We have validated our results on the OU-ISIR gait inertial sensor dataset. The obtained results are consistent with our observations on the HAPT dataset, as shown in Fig. 4(d), and 8(a) and (b). A summary of results is presented in Table II, in which we have compared our results with the standard benchmark findings as reported in the literature [Reference Murray, Drought and Kory35, Reference Livingston, Stevenson and Olney36] and found our results to be consistent with them. Further, a 95% CI [1.08, 1.12], [1.15, 1.22], and [0.97, 1.07] for activity level walking, walking upstairs, and walking downstairs, respectively, in mean stride duration is established. Also, we have compared our results with the available methods in the literature (refer to Table III) and found our method to be at par with the state of the art.
(a) Histogram showing the distribution of mean stride length, and (b) box and whiskers plot depicting the mean stride duration for the activity “level walk” (OU-ISIR dataset).

4.1. Limitations of autocorrelation procedure
The major limitation of the ACF is that to obtain meaningful information from ACF coefficients, the input sample size should be at least of length 400. Applying ACF on smaller sample size results in inconsistent values of ACF coefficients which could be misleading, as shown in Fig. 3(b) and as reported in [Reference Warlop, Bollens, Detrembleur, Stoquart, Lejeune and Crevecoeur37] and hence this is the reason for choosing the threshold value as 400 in Algorithm 1.
5. Conclusion
We have proposed an automatic technique for carrying out stride segmentation on gait inertial sensor data. The results obtained from the proposed technique are consistent with the standard benchmark findings, as tested on two different gait datasets. Also, we have discussed a significant limitation of the ACF. The proposed technique can be realized right inside a wearable sensor for IoT and edge computing applications. Further, our technique can be used in applications such as gait parameter estimation, health monitoring system, automatic feature extraction, and gait event detection. The factors that can influence the accuracy of our proposed methodology are those that affect a person’s motor ability directly or indirectly, such as the mental state of a person, physiological parameters, fatigue, drunken state of a person, and diseases such as PD and Alzheimer’s disease. As future work, we would like to evaluate the adaptability challenges of our proposed methodology on pathological gaits to address the challenges mentioned above. Also, we would like to carry out a deep learning-based stride segmentation approach for tinyML implementation to provide a personalized gait-based activity recognition and health monitoring system. Further, we would like to validate this approach on a more diverse set of gait datasets, including our self-collected gait dataset.
Acknowledgement
The authors would like to thank the Ministry of Education, Govt. of India for funding the project under HEFA CSR grant SAN/CSR/08/2021-22. The authors also like to thank SERB, DST Govt. of India, for funding the project under the Early career award (ECR) scheme, DST No: ECR/2018/000203. The authors would like to express thanks to the ISIR, OU, for providing the OU-ISIR gait inertial sensor dataset (www.am.sanken.osaka-u.ac.jp/BiometricDB/InertialGait.html). The authors would also like to thank the curators of the HAPT dataset for making the dataset publicly available at the UCI ML repository (http://archive.ics.uci.edu/ml/datasets/smartphone-based+recognition+of+human+activities+and+postural+transitions).
Conflicts of interest
The authors proclaim no conflict of interest regarding this research paper with any person or organization. This manuscript is based on original research findings done by the authors themselves.
Compliance with ethical standards
All the ethical issues have been taken care of while writing the manuscript, and we have complied with all the standards to the best of our knowledge.
Author’s contributions
Conceptualization: R.J, V.B, and P.K; methodology: R.J, V.B, and P.K; software: R.J; validation: R.J, V.B; supervision: V.B, P.K; writing – original draft preparation: R.J, V.B; review and editing: R.J, V.B, and P.K; funding acquisition: V.B. All authors have read and approved the final manuscript.