Introduction
Sub-Saharan Africa was the last major part of the developing world to initiate fertility transition. Fertility in the region remains high as compared with fertility in Asia and Latin America (United Nations, 2013), and stalling of fertility decline has been seen in a number of countries in sub-Saharan Africa, much more so than observed elsewhere in the developing world (Bongaarts, Reference Bongaarts2008; Shapiro et al., Reference Shapiro, Kreider, Varner, Sinha, Tabutin and Masquelier2013). Research on fertility decline and stalling suggests that socioeconomic progress – and most notably, improvements in women's educational attainment and infant and child mortality, as well as economic growth – are important factors that come into play as influences on the pace of fertility decline (Bongaarts, Reference Bongaarts2005, Reference Bongaarts2008; Bryant, Reference Bryant2007; Shapiro, Reference Shapiro2012; Shapiro et al., Reference Shapiro, Kreider, Varner, Sinha, Tabutin and Masquelier2013).
Not all countries in sub-Saharan Africa have embarked upon fertility decline, however, and Romaniuk (Reference Romaniuk2011) has recently explored the reasons why, at the national level, the Democratic Republic of the Congo (DRC) has not yet initiated this transition. While fertility decline has not yet begun at the national level, Shapiro (Reference Shapiro1996), analysing data from a 1990 survey, documented that Kinshasa, capital of the DRC and the second-largest city in sub-Saharan Africa, had experienced fertility decline beginning after 1975. His analysis of the onset of fertility decline in Kinshasa emphasized growth in women's educational attainment, particularly to beyond the primary level, as the key factor contributing to the initiation of fertility transition.
As Garenne & Joseph (Reference Garenne and Joseph2002) and Garenne (Reference Garenne2008) have shown, in much of sub-Saharan Africa fertility transition began in urban places before spreading to rural places (see also Shapiro & Tambashe, Reference Shapiro and Tambashe2002). Similarly, Chackiel & Schkolnik (Reference Chackiel, Schkolnik, Jose Guzman, Singh, Rodriguez and Pantelides1996) provided evidence of lower urban fertility as part of the fertility transition in Latin America. This urban–rural difference is presumably a consequence, at least in part, of a higher net cost of children to parents in urban places as compared with rural areas (cf. Becker Reference Becker1960). A related aspect is what Romaniuk (Reference Romaniuk2011) describes as the effect of urbanization (and associated socioeconomic factors, such as increased women's education) in strengthening ‘modern’ reproductive attitudes and behaviours. Shapiro & Tambashe (Reference Shapiro and Tambashe2002) noted that in sub-Saharan Africa, not only are there distinct urban–rural differences in fertility, but also, large capital cities most often tend to have especially low fertility as compared with smaller urban places. Hence, the DRC has witnessed the onset of fertility transition in its capital, but fertility decline for the country as a whole has not yet begun.
The DRC's economy has experienced protracted decline since about the mid-1970s, with sharp acceleration of that decline during the 1990s (Heston et al., Reference Heston, Summers and Aten2011). Following about 15 years of poor economic performance, Kinshasa and the DRC in the early 1990s experienced very rapid inflation, civil disorder and an acute economic crisis, with pillaging and looting in 1991 and 1993 contributing to substantial shrinkage of the modern sector of the economy, considerable growth of the informal sector and severe declines in real GDP per capita. Civil war characterized the latter part of the 1990s and the first part of the new millennium. Extremely poor economic performance was thus apparent throughout the 1990s and beyond, particularly in Kinshasa.
Economic crisis and enduring economic hardship may influence fertility transition in a variety of ways. Broadly speaking, historical experience in the West saw economic growth associated with fertility decline. From this perspective, then, economic crisis might be expected to contribute to stalling of fertility transition. More directly, prolonged adverse economic conditions are likely to slow or even reverse increases in women's educational attainment and decreases in infant and child mortality, two factors that have been shown to be strongly related to the pace of fertility decline in sub-Saharan Africa (Shapiro & Gebreselassie, Reference Shapiro and Gebreselassie2008; Shapiro, Reference Shapiro2012) and elsewhere in the developing world (Shapiro et al., Reference Shapiro, Kreider, Varner, Sinha, Tabutin and Masquelier2013). These, then, are key arguments for how economic crisis and ongoing poor economic performance might result in a slowing of fertility decline.
At the same time, there is also some literature suggesting that in sub-Saharan Africa, economic crisis may serve as a factor precipitating or contributing to fertility decline (e.g. see Lesthaeghe, Reference Lesthaeghe and Lesthaeghe1989; National Research Council, 1993; Eloundou-Enyegue et al., Reference Eloundou-Enyegue, Stokes and Cornwell2000; Antoine, Reference Antoine2006; and Gurmu & Mace, Reference Gurmu and Mace2008). Both delays in entry to marriage and delays in the onset of childbearing within marriage have been cited in this regard. Complementing this literature, Romaniuk (Reference Romaniuk2011) makes a strong case that the social dislocations of enduring economic hardship in Kinshasa created by prolonged poor economic performance have had a significant antinatalist effect.
In view of the severe economic and political difficulties that have characterized Kinshasa and the DRC since 1990, this paper examines what has happened to the fertility transition that was well under way in 1990, using data from the 2007 Demographic and Health Survey (DHS) of the DRC. The paper seeks to assess fertility transition in the city, with a view to identifying the importance of women's education and also the importance of enduring economic hardship in contributing to fertility decline. There are three research questions that are the focus of the paper. First, since 1990, what has happened to fertility in Kinshasa? Second, particularly given the acute economic crisis that prevailed for much of the 1990s and the adverse economic conditions that still exist, what has been the contribution of women's education to fertility decline in the city? And third, by what mechanisms or pathways, apart from women's education, have economic crisis and ongoing poor economic performance influenced fertility transition in Kinshasa?
The following section of the paper provides a descriptive overview of the changes that have taken place in Kinshasa since 1990 in fertility, in the context of earlier changes in these variables. Economic performance in the DRC is also briefly reviewed. Then the evolution of women's educational attainment since 1990, in the face of persistent adverse economic circumstances, is reviewed, and the contribution of changes in women's educational attainment to the ongoing decline in fertility is assessed. The third substantive section considers other factors that have been influenced by economic crisis and adverse economic conditions since 1990 that in turn are likely to have contributed to the ongoing fertility decline, with particular emphasis on entry into a union and initiation of childbearing. The final section of the paper summarizes the results, draws some conclusions and considers prospects for further declines in fertility.
Fertility and the economy in Kinshasa and the DRC
With an estimated population as of 2011 approaching 9 million (United Nations, 2012), Kinshasa is the second-largest city in sub-Saharan Africa, after Lagos in Nigeria. The city is quite heterogeneous in multiple respects, including its ethnic composition (Shapiro & Tambashe, Reference Shapiro and Tambashe2003), its urbanization (older areas of the city closer to downtown have infrastructure, while peripheral areas of the city, largely populated by migrants, do not), and its distribution of wealth. Poor economic policies and a kleptocratic state, especially during the Mobutu years of 1965–1997, and the economic and political chaos of the 1990s and beyond have resulted in a high level of poverty in Kinshasa, but there are some well-to-do areas of the city as well for a small minority of the population.
As Léopoldville in the Belgian Congo, in the mid-1950s (with a population of about 300,000) the city had an estimated total fertility rate (TFR) of 7.5 (Romaniuk, Reference Romaniuk1967, Reference Romaniuk and Brass1968). Twenty years later, a large-scale demographic survey of the city carried out in 1975 indicated that the overall level of fertility had not fallen (Sala-Diakanda, Reference Sala-Diakanda1980; Houyoux & Kinavwuidi, Reference Houyoux and Kinavwuidi1986). However, using data from a 1990 survey, Shapiro (Reference Shapiro1996) documented the onset of fertility transition in Kinshasa, finding a TFR of just under 5.7 (see also Shapiro & Tambashe, Reference Shapiro and Tambashe2003, especially Chapter 3). Women's education was strongly inversely related to fertility behaviour, beginning with secondary-level schooling, and the increases in women's educational attainment that had taken place following independence in 1960 and continuing up to 1990, along with the associated delays in entry to marriage, were clearly very important in initiating fertility transition in the city. Between 1975 and 1990 the DRC held a census in 1984, and the census reported a TFR for Kinshasa of 7.7. However, in contrast to the 1990 survey, birth histories were not collected in the census; the fertility estimate was produced using an indirect methodology based on mean parity by age group that assumes that fertility has been stable. Shapiro & Tambashe (Reference Shapiro and Tambashe2003, Chapter 3), using the example of Kenya, demonstrated that use of this methodology when fertility has been falling leads to upward-biased estimates of fertility. Consequently, the census data were not used in this paper.
Fertility transition in Kinshasa has been ongoing since 1990, with the TFR falling by roughly a third to 3.7 for the three years preceding the 2007 DHS (Ministère du Plan and Macro International, 2008). The city's fertility level is substantially below the DHS-estimated national TFR of 6.3. By comparison, rural fertility was estimated at 7.0, while overall urban fertility was reported as 5.4 (Ministère du Plan and Macro International, 2008). Since this latter figure includes Kinshasa, which represents nearly 38% of the country's urban population according to the United Nations Population Division (2012) and almost 35% of the DHS urban sample for the DRC, the implied TFR in other urban places besides Kinshasa is about 6.3. It is apparent, then, that as in a number of other countries in the region, fertility is distinctly lower in the capital than in smaller urban centres (Shapiro & Tambashe, Reference Shapiro and Tambashe2002).
Kinshasa's TFR of 3.7 as of 2007 represents a substantial reduction from the estimated TFR of 5.67 as of 1990, amounting to an average annual decline since 1990 of almost 0.12. This is the same pace of decline as that which took place between 1975 and 1990 in Kinshasa, and it appears to be continuing: a Multiple Indicator Cluster Survey (MICS) carried out in 2010 estimated the TFR at 3.5 for Kinshasa (Institut National de la Statistique, 2011). By comparison, a recent study of fertility transition at the national level in nearly 50 developing countries around the world found that in sub-Saharan Africa the average annual decline in the national TFR between the two most recent DHS surveys was only 0.05, compared with 0.08 and 0.12 for countries in Asia/North Africa and in Latin America and the Caribbean, respectively (Shapiro et al., Reference Shapiro, Kreider, Varner, Sinha, Tabutin and Masquelier2013).
Going back over a longer time period, Bongaarts (Reference Bongaarts2008) reported an average annual decline in the TFR of 0.09 for all developing countries other than China for the period from 1965 to 1990. For the period from about 1992 to 1998, Bongaarts found an average annual decline in the TFR of 0.07 for sub-Saharan Africa and 0.08 for both Asia/North Africa and Latin America. For the period from about 1998 to 2004, however, he found average declines of only 0.02 per year in sub-Saharan Africa, compared with 0.10 in Asia/North Africa and 0.07 in Latin America. Clearly, then, the pace of fertility decline in Kinshasa has been comparatively quite strong, and one result is that present fertility is less than half of the TFR estimated for 1975.
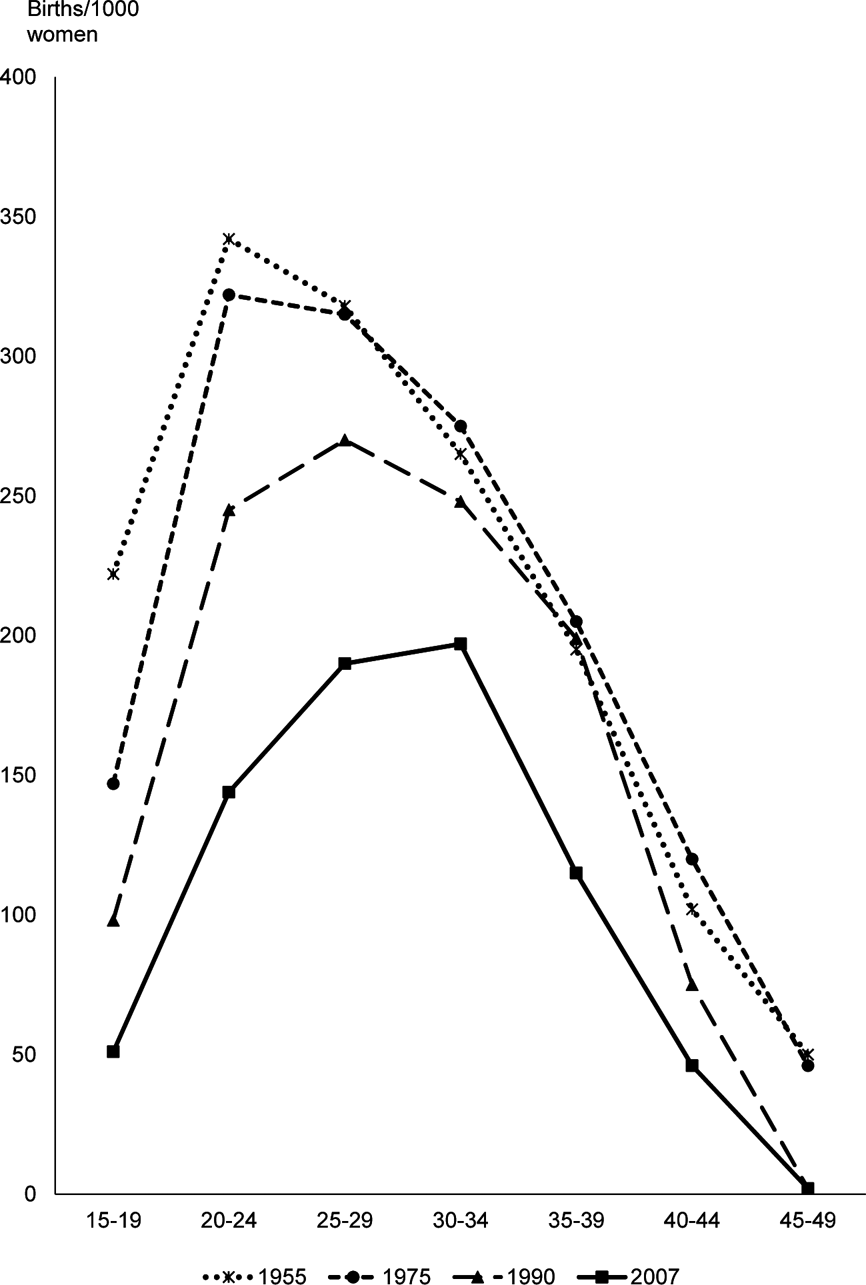
Figure 1 shows age-specific fertility rates from the 2007 DHS survey, as well as comparable rates from three earlier surveys of fertility in Kinshasa, in 1955, 1975 and 1990. Since 1990 there have been declines in fertility rates in all but the oldest age group (that 45- to 49-year-old group already had fertility close to zero in 1990). The younger and older age groups are where the fertility declines have been greatest. For example, among those under aged 25 and those aged 35–44, age-specific fertility rates in 2007 are more than 40% lower than they were in 1990, while among those aged 25–29 and 30–34 the declines are by 30% and 20%, respectively.
Age-specific fertility rates, 1955, 1975, 1990 and 2007, Kinshasa.

It is also evident from Fig. 1 that there has been continuation of an earlier tendency for peak fertility to occur at older ages. In the 1950s and 1970s peak fertility in Kinshasa was observed among women aged 20–24, while by 1990 the highest age-specific fertility rate was that for women aged 25–29. As of 2007, the peak fertility age group had become those aged 30–34. This change in the timing of fertility reflects increasing educational attainment of women as well as trends towards delay in marriage and in childbearing, as will be seen below.
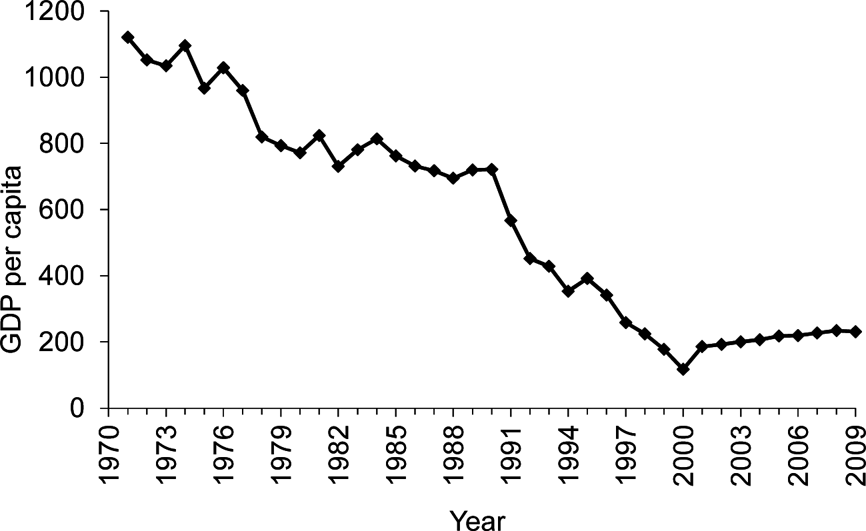
Consider now the economic context in which these changes in fertility have been taking place. Estimated real GDP per capita for the Congo for the period since 1970 (data are from the Penn World Table; Heston et al., Reference Heston, Summers and Aten2011) is shown in Fig. 2. The data show that from a peak of just over US$1120 in 1971, real GDP per capita fell by almost 80%, to only about US$231 in 2009. But the bulk of the decline was for the period from 1990 to 1999, when the decline in real GDP per capita was almost 75%. That is, from the early/mid-1970s until 1990 there was a clear overall decline in real GDP per capita, but during the decade of the 1990s the decline became distinctly more severe, and improvement in the new millennium has been modest.
Real GDP per capita, 1970–2009, DRC.
If one looks at year-to-year changes, it is apparent that between 1974 and 1990 the economic situation was bad: negative growth was realized during ten of the sixteen years. This corresponds to chronic poor economic performance. But after 1990 the situation was terrible: during the 1990s, there was negative growth in all but one year, reflecting acute economic hardship. This was especially evident in Kinshasa and in other urban places; rural areas, dominated largely by subsistence agriculture and remote from the modern economy in Kinshasa and other cities, have been more insulated from the sharp economic adversity, and as already mentioned, rural fertility remains quite high.
As noted in the introduction, the period since 1990 saw a reduction in the size of the modern sector of the economy and rapid growth in the informal sector, and the sharp declines in real GDP per capita meant that even for those with employment in the modern sector, incomes were often quite low. Trefon (Reference Trefon and Trefon2004, p. 14), in the introduction to Ordre et désordre à Kinshasa: Réponses populaires à la faillite de l'État (Order and Disorder in Kinshasa: Popular Responses to the Failure of the State), a volume he edited as well as contributed to, emphasizes that the new forms of social organization in numerous dimensions that are meant to alleviate the economic hardship and that are the focus of the book emerged in a striking manner at the beginning of the 1990s – right at the time when the economic situation deteriorated sharply.
The severity of the DRC's economic decline is apparent from the following information gleaned from the Penn World Table data (Heston et al., Reference Heston, Summers and Aten2011). Among more than three dozen countries from sub-Saharan Africa for which estimates are available, the annual average change in real GDP per capita from 1990 up to 2009 for the DRC was nearly −6% – more than twice the magnitude in absolute value of the next-worst-performing economy during the period, that of Zimbabwe. By comparison, for all of the countries, on average, annual growth in real per capita GDP was +0.7%.
Women's educational attainment since 1990 and its contribution to fertility decline
Women's educational attainment in Kinshasa showed sharp increases between the mid-1950s and 1990; the median woman of reproductive age went from having no schooling to having lower-level secondary schooling (Shapiro & Tambashe, Reference Shapiro and Tambashe2003, Chapter 2). The emergence of acute economic crisis during the early 1990s imperiled this trend, particularly given the presence of a weak state that failed to provide adequate resources for investments in the educational system. In early 2002, one observer in Kinshasa, commenting on the role of the State in education, said ‘l'état a démissioné’ (the State has resigned) (personal communication). Yet despite the economic difficulties, the earlier trend continued, albeit at a slower pace, and women's educational attainment in Kinshasa increased. Presumably this reflects a perception by parents of the value of education for their daughters.
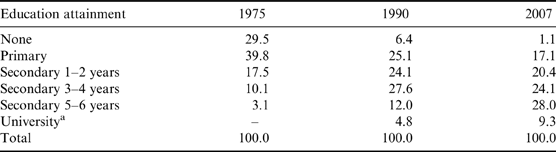
The magnitudes of the increase may be seen in Table 1, which shows data on educational attainment for women of reproductive age for 1975, 1990 and 2007. For example, the percentage of women aged 15–49 who had reached at least upper-level secondary school more than doubled between 1990 and 2007, increasing from not quite 17% in 1990 to more than 37% in 2007, with corresponding reductions in the fraction of women with lower levels of schooling. There were especially large declines in the share of women with less than secondary schooling, from nearly a third of all women of reproductive age down to 18% in 2007. The median level of schooling of women of reproductive age increased from 8.4 to 9.9 years during the period. The median had been approximately 5 years in 1975, so by this measure there was clearly a deceleration of the pace of increase after 1990. These increases in schooling are apparent for the different age groups as well (as shown in Shapiro, Reference Shapiro2010).
Educational attainment, women aged 15–49, 1975, 1990 and 2007, Kinshasa (percentages)
a Figure for university is included in the ‘Secondary 5–6 years’ data.
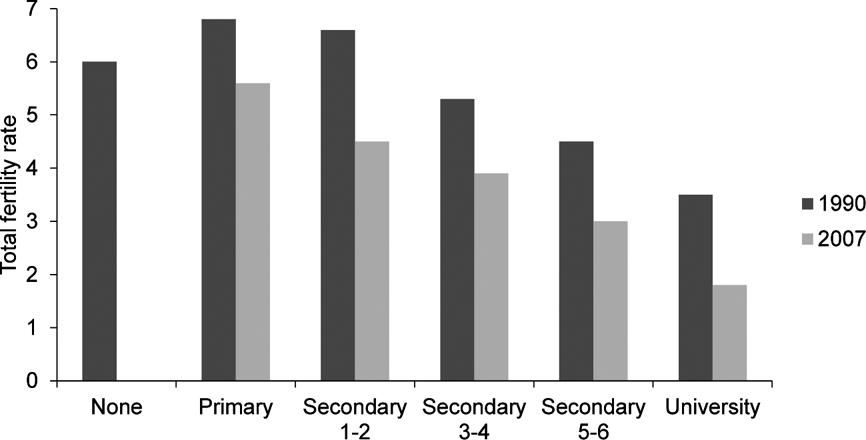
Total fertility rates by education group, shown in Fig. 3, make it clear that for each education group there has been a decline in the TFR since 1990. These declines are quite substantial, ranging in magnitude from roughly 1–2 children per woman. While Kravdal (Reference Kravdal2002) has shown that increases in women's general level of education in the aggregate may contribute to lower fertility at the individual level, the large observed declines in fertility at each educational level seem greater than what one would anticipate from the observed aggregate increase in education.
Total fertility rates, by educational attainment, 1990 and 2007, Kinshasa. An inadequate sample size in 2007 for women with no schooling prevented calculation of a TFR for this group.
Thus, while increased women's education between 1990 and 2007 has contributed to the overall reduction of fertility from 5.7 to 3.7 by virtue of fewer women being in education groups with higher fertility while more women are in groups with lower fertility, it appears that declining fertility within education groups has played a major role in the overall decline in fertility. To foreshadow arguments that will be developed further below, the sustained and acute economic difficulties that have been experienced since 1990 appear to be the key factor underlying these across-the-board declines in fertility.
Indeed, using TFRs by education group and the proportion in each education group for each year, the difference in overall TFRs between 1990 and 2007 may be decomposed into a portion attributable to increasing women's schooling and a portion reflecting changing behaviour (i.e. lower fertility) of women with given schooling. Application of this decomposition to the data suggests that at most, about a quarter of the observed reduction since 1990 in the city's overall TFR may be attributed to the growth in women's schooling. The remaining three-quarters of the fertility reduction is a consequence of the lower fertility of women with given schooling – what may be characterized as changing behaviour. A similar procedure can be carried out for data on children ever-born by age and education group. For that decomposition, approximately one-third of the decline in the average number of children ever-born was attributable to increased schooling of women, with the remaining two-thirds due to changing behaviour (Shapiro, Reference Shapiro2010).
It is of interest to note the pattern of TFRs by education group. In 1990, peak fertility occurred among women with primary schooling. This pattern was also evident in 1975 (Shapiro, Reference Shapiro1996), and has been observed in some other countries in the region as well (Castro Martin, Reference Castro Martin1995). By 2007, there were too few women with no schooling in Kinshasa to estimate their total fertility. However, other evidence suggests that peak fertility in the DRC now is among women with no schooling: regression analyses of children ever-born among women in Kinshasa show that in contrast to 1975 and 1990, when fertility was higher among women with primary schooling than among those with no schooling (Shapiro, Reference Shapiro1996), in 2007 it was highest by far among the small number of women with no schooling (Shapiro, Reference Shapiro2010). This disappearance of higher fertility among women in Kinshasa with primary schooling is consistent with Castro Martin's (1996) finding that that pattern was becoming less common. Further, at the national level the TFR for women with primary school (7.1) is equal to the TFR for women with no schooling, while the average number of children ever-born among women aged 40–49 is higher for the primary-educated women, suggesting that they previously had higher fertility.
Comparison of the changes in educational differentials in fertility between 1990 and 2007, as shown in Fig. 3, indicates that for the most part the differences between adjacent schooling groups widened. This is consistent with Castro Martin's (Reference Castro Martin1995, p. 190) argument that ‘countries in the midst of their fertility transition display the largest differentials’.
Adverse economic conditions, entry into marital unions and initiation of childbearing since 1990
This section examines other changes that have taken place since 1990 that contribute to, or are part of, the overall decline in fertility, and how these changes are linked to the ongoing adverse economic conditions and enduring economic hardship. This examination focuses on changes in the likelihood of women being in a marital union and of initiating childbearing.
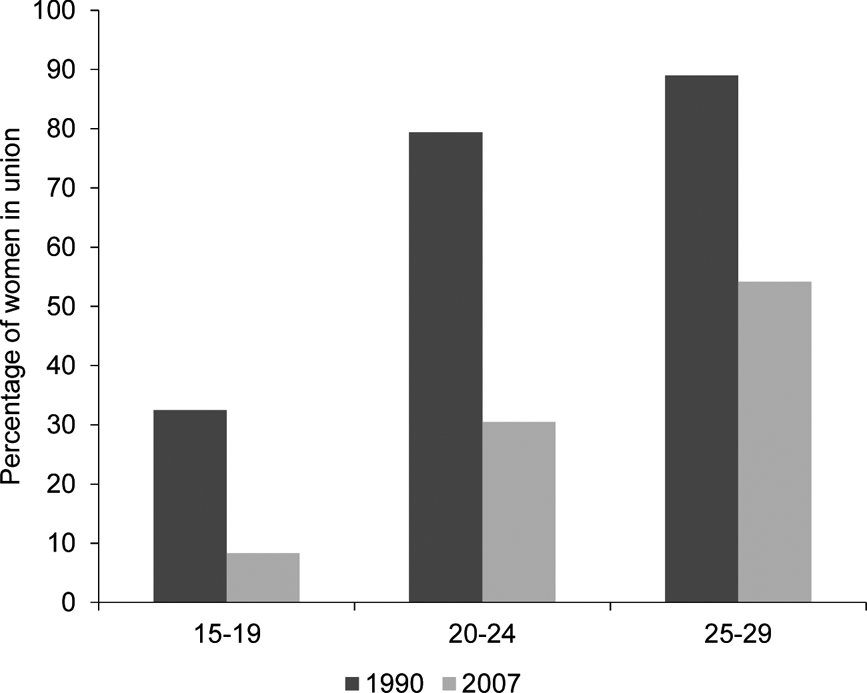
Associated at least in part with the increased schooling of women, but more importantly, with the adverse economic environment that characterized much of the period since 1990, there has been a sharp decline in the propensity of women to be in a marital union, particularly among women under the age of 30. This may be readily seen in Fig. 4, showing the percentage of women in union by age group for women under age 30 in 1990 and in 2007. In each year, the percentage in union increases as one moves from the adolescents to those in their late 20s. But the percentages are considerably lower in 2007 than they were in 1990, with the relative declines being greatest among the youngest women. That is, the percentage of adolescents in union fell by almost three-quarters, while the decline was greater than 60% for those aged 20–24 and close to 40% for those aged 25–29. Ngondo (Reference Ngondo1996) and De Herdt (Reference De Herdt and Trefon2004) cited evidence that average household size in Kinshasa has increased over time, and argued that poverty has caused young women to postpone marriage.
Percentage of women in union, by age group, 1990 and 2007, Kinshasa.
A Bongaarts analysis of the proximate determinants of fertility and their impact on observed fertility (Bongaarts, Reference Bongaarts1978) from the 1990 and 2007 surveys shows that there was a sharp drop in the index of marriage, by about 30%, from 0.88 to 0.62. Since the index of contraception declined slightly over the same span while the index of postpartum infecundability increased slightly, it is clear that among these three key proximate determinants, changes in the proportion of women in union were the driving force regarding the influence of proximate determinants on fertility.
These results for Kinshasa parallel what took place in Addis Ababa, Ethiopia, between 1990 and 2000, as reported by Sibanda et al. (Reference Sibanda, Woubalem, Hogan and Lindstrom2003): in conjunction with a sharp decline in fertility in the city to a below-replacement level, there was a corresponding decline in proportions married of women under the age of 30. As was the case for Kinshasa, a Bongaarts analysis of the proximate determinants of fertility found the decline in proportions married to be the single most important mechanism contributing to fertility decline in Addis Ababa. And the authors suggested that the decline in proportions married was probably a consequence of poor employment prospects and high housing costs that led couples to delay marriage and childbearing. Similarly, Gurmu & Mace (Reference Gurmu and Mace2008, p. 339), in their study of fertility in Addis Ababa, argued that ‘most of the unmarried men and women are “retreating from marriage” due to economic stress’.
Further, if one separates out women in union in Kinshasa who, in response to a question about their marital status, identify themselves as married from those who say they are living together with a man as if married, the declines are more substantial among those in their 20s in the ‘married’ group as compared with the ‘living together’ group. Indeed, among those aged 25–29 the entire decline between 1990 and 2007 in the percentage of women in union is attributable to the decline in the percentage of women who describe themselves as married rather than living together. Among those aged 20–24 there was a decline between 1990 and 2007 both in the percentage responding ‘married’ and in the percentage responding ‘living together’, but the decline was more substantial for the ‘married’ group.
In the mid-1950s, close to 95% of women in their 20s in Kinshasa were in union (Shapiro & Tambashe, Reference Shapiro and Tambashe2003). By 2007, however, the percentages in union in these two age groups had declined substantially, so that only about 30% of those aged 20–24 and a little more than half of those aged 25–29 were in union. In about half a century, then, being married (in union) has gone from being close to universal among women in their twenties to being unusual among women in their early twenties and constituting the state of only a small majority of women in their late twenties. In effect, the period since 1990 is one that has seen a certain ‘retreat’ from marriage, both broadly and narrowly defined.
That is, the percentage of women in union has declined sharply, and the mix of women in union among those in their 20s as between ‘married’ and ‘living together’ has changed, reflecting a move away from the former and towards the latter among those in union. Both aspects are pertinent to fertility decline. As more women delay entry to marriage, fewer women in union means lower exposure to the risk of becoming pregnant. And the fact that relatively more of those in union are living together also has fertility implications, given that sexual behaviour as well as fertility differs for the two groups. From the DHS data, median duration since last intercourse was 7 days for women in Kinshasa who identified themselves as married, while it was 21 days for their counterparts who said they were living together. Likewise, the number of children ever-born is distinctly higher for those describing themselves as married. Consistent with this difference in sexual behaviour by type of union, Agyei-Mensah (Reference Agyei-Mensah2006, p. 464) noted that in Ghana, ‘women in mutual consent marriages had lower fertility than women in traditional unions’.
These results for Kinshasa showing delays in entry to marriage and declines in the proportion of those in union who are formally married as opposed to living together are similar to the findings of Philippe Antoine (Reference Antoine2006) in his study of changes in marriage patterns in four sub-Saharan African capitals that have all experienced prolonged periods of economic recession. He noted the adverse effects of recession on labour markets in these cities, with limited employment opportunities in both the modern private sector of the economy and the public sector, and growing employment in the informal sector as well as high levels of unemployment. All of these features typify the labour market in Kinshasa as well (Shapiro et al., Reference Shapiro, Gough and Pongi2011), and as Antoine points out, they make it difficult for young men to obtain the resources required to marry and establish an independent household and family.
Using biographical data to compare different cohorts that came of age in very different economic times, Antoine found delays in age at first marriage among the young, associated with the deterioration of the economic environment. He concluded that this adverse economic environment causes men to delay marrying due to uncertainties about employment and corresponding difficulties in making bride payments and securing housing. This in turn contributes to delays in entry to marriage of young women because of the scarcity of men on the marriage market. Antoine pointed out that in three of the four capitals studied – Lomé, Yaoundé and Antananarivo – entry into union ‘is done more and more according to new arrangements, outside of traditional prescriptions: new union forms are appearing, notably informal unions and de-cohabitation of the couple’ (2006, p. 32, author's translation from the French). (The fourth capital, Dakar, has a strong Muslim influence, and marriage there remains traditional and unchanged.)
In Kinshasa, in the early 1990s when the economy was particularly severely depressed, a practice emerged called ‘Yaka, tofanda’. In Lingala, the predominant local language in the city, this literally means ‘Come, let's sit down’. But in practice the term is used to refer to a situation where a couple cohabits without going through any of the formal or traditional marriage processes and procedures. The unions to which this term applies, then, correspond to the informal unions that Antoine found in other capitals that had experienced prolonged adverse economic conditions.
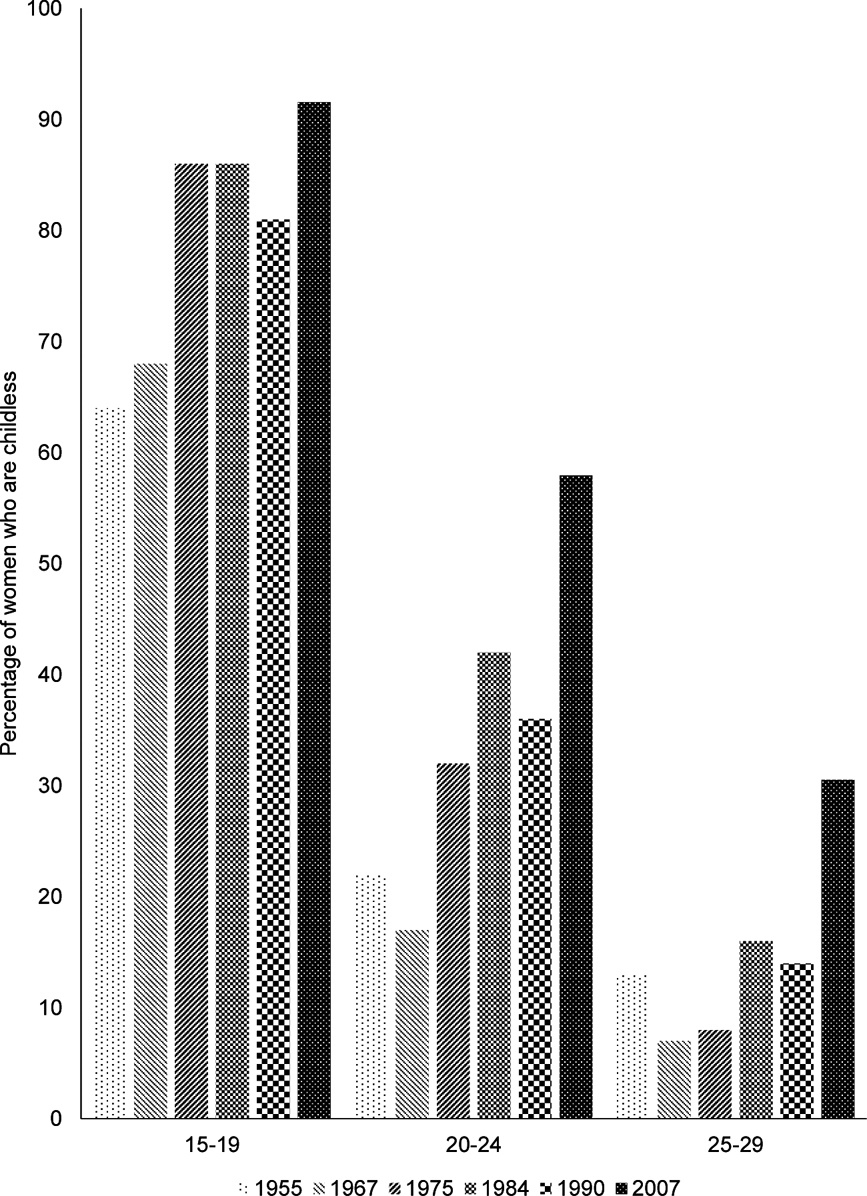
Along with the declining propensity of women under age 30 to be in union, there has been an increase in the percentage of women who have not yet initiated childbearing. Figure 5 shows the percentages of women who are childless, by age group, for women under age 30, for six surveys going back to the mid-1950s. Here the focus is on the last two surveys.
Percentage of women who are childless, by age group, 1955–2007, Kinshasa.
Compared with 1990, there have been increases in childlessness in all three age groups. These increases have been greatest among those aged 20–29. By 2007, more than 30% of women aged 25–29 were childless; this was more than twice the corresponding percentage in 1990. And the increases in childlessness are not simply a consequence of school enrolment. For example, among those aged 20–24 in 2007, just under 30% were enrolled in school, almost the same percentage as in 1990. However, in 2007 nearly 60% of women in this age group had not yet had a child, compared with just over 35% among their counterparts in 1990. Hence, while in 1990 women in this age group were either enrolled in school or had initiated childbearing, by 2007 a substantial minority of these women was not in school but also had not yet begun to have children.
This increase in childlessness is evident among older women as well. More than 10% of women aged 30–44 were childless in 2007, compared with fewer than 3% in 1990. Clearly, there has been a distinct delay in the onset of childbearing that has emerged during the period of especially adverse economic conditions since 1990. Further, this increased childlessness is evident among all education groups of young women (not shown here), and hence is not primarily due to the modest increase in women's schooling.
In sum, then, it appears that in Kinshasa, the extremely poor economic situation since 1990 has resulted in both declines in the proportion of young women entering into marital unions and also delays in entry to childbearing. These were the two principal mechanisms discussed in the National Research Council (1993) study of demographic effects on fertility of economic reversals, and similar outcomes have been observed elsewhere in the region as well.
Conclusions
This paper has documented that the decline in fertility in Kinshasa that was evident in 1990 has continued up through 2007, at essentially the same strong pace as the city's initial decline in fertility between 1975 and 1990. The total fertility rate has fallen by an average of a little more than 0.1 per year, from 5.7 in 1990 to 3.7 in 2007. The declines in fertility have been greatest at both younger (under age 25) and older (ages 35 and older) ages. The ages at which peak childbearing occurs have continued to increase, such that by 2007 the highest age-specific fertility rate was evident among women aged 30–34. In addition, total fertility rates by educational attainment have declined substantially, across all education groups, and this change in behaviour has been a major factor contributing to the sustained decline in fertility.
Despite the economic difficulties during the 1990s, educational attainment of women of reproductive age has continued to increase, albeit at a slower pace than before. This increased schooling has thus contributed to the ongoing fertility decline. Overall, however, increased educational attainment appears to account for perhaps a quarter to a third of the observed decline in fertility, with the bulk of that decline being a consequence of changing behaviour: across the board reductions in fertility by education group. This changing behaviour is largely driven by the extremely harsh economic conditions that have prevailed for most of the period since 1990. In effect, economic adversity has supplanted increased women's educational attainment as the primary factor contributing to ongoing fertility decline.
The proportions of women in union among women under age 30 have declined considerably since 1990, and a greater percentage of unions is made up of couples living together as opposed to being formally married. Associated with later entry into marriage is a correspondingly later entry into motherhood. In particular, the data show sharp increases in the proportion of women under age 30 who are childless. It thus appears that women are remaining out of union and childless for distinctly longer in their lives than in the past.
The key conclusion here is that enduring economic hardship is a major factor contributing to Kinshasa's ongoing fertility decline, primarily via delayed marriage and childbearing. This is consistent with earlier studies discussed above suggesting that adverse economic conditions in sub-Saharan Africa have contributed to fertility decline in a number of other places in the region.
Further, recent studies of fertility transition in sub-Saharan Africa (Shapiro & Gebreselassie, Reference Shapiro and Gebreselassie2008; Shapiro, Reference Shapiro2012) have found that controlling for other factors such as changes in women's educational attainment, infant and child mortality, and modern contraceptive use, growth in real GDP per capita is associated with slower fertility decline. These results (based on data that did not include the DRC) are quite consistent with Kinshasa showing both sharp declines in real GDP per capita and large reductions in fertility as well.
The observed fertility decline in Kinshasa, according to the analysis in this paper, has been driven primarily by two forces: increasing education and persistent economic hardship endured by the vast majority of the city's inhabitants. The first factor is an important element of the forces of modernity, while the second has been characterized by some demographers who have studied fertility decline in environments of poverty and social disorganization in sub-Saharan Africa as a ‘Malthusianism of poverty’ (Fassassi et al., Reference Fassassi, Vignikin and Vimard2010; Romaniuk, Reference Romaniuk2011).
Romaniuk (Reference Romaniuk2011), in considering determinants and correlates of fertility as part of the process of understanding fertility transition, emphasizes the desirability of taking a balanced approach that would take into account both the forces of tradition that typically hinder fertility decline and the forces of modernization that tend to promote fertility transition. From this perspective, many residents of Kinshasa are torn between pronatalist traditions and antinatalist modernity. At the same time, enduring economic hardship has made it very difficult for many individuals and couples to realize traditional high levels of fertility. These offsetting forces should be kept in mind when studying childbearing in Kinshasa and when making prognoses for the future.
What, then, is the future of fertility transition in Kinshasa? The secular and ongoing increase in women's schooling, in conjunction with the clear negative effect of schooling on fertility, suggests that fertility will continue to decline. But what happens to the economy will also be relevant, with the possibility that improvements in the DRC's economic performance might slow the pace of fertility decline. Relaxing economic constraints would presumably allow for reversal of the delays in entry to union and in onset of childbearing that have characterized the city's fertility decline since 1990.
In part because the short-term prospects for economic improvement are not good, fertility is expected to continue to decline – but to what level? Lesthaeghe (Reference Lesthaeghe and Lesthaeghe1989) suggested that so long as children remained the primary source of old-age security among parents, fertility was likely to stop falling well short of the replacement level. Indeed, it is of interest to note that fertility preferences have changed very little since 1990, despite the sharp drop in the TFR: in 1990, mean ideal fertility was 5.0, below the observed TFR of 5.7, while in 2007 mean ideal fertility was 4.8, distinctly above the TFR of 3.7. This reversal of the relationship between ideal and actual fertility is consistent with the argument that economic constraints are playing a major role in the city's ongoing fertility decline.
Acknowledgments
Anatole Romaniuk provided numerous insightful comments and helpful suggestions, and the paper has benefited as well from comments by Clementine Rossier and anonymous referees. Excellent research assistance for this paper was provided by Nathan Bartell, Thomas McCreary, Amy Meckes, Patrick Kemp and Brett Brackett. Solely the author is responsible for the contents of the paper.