

So as not to repeat something that each of you knows, I will not go into the details of the economic crisis in Kuwait, but instead I will only give its basic cause. The ballot box in Kuwait is dominated by an overgrown bureaucracy with an absolute majority. This bureaucratic majority [of state employees] enjoys lavish benefits far beyond any measures of productivity or qualifications. It owns the political arena, and it feels that economic reform threatens its selfish interests both in terms of income and influence. . . . The executive and legislative branches (including the parliamentary blocs) compete to win the loyalty of this majority by satisfying its desires for consumption. . . at the expense of the future of Kuwait and coming generations.Footnote 1
—Ali Thunayan al-Ghanim, president of the Kuwait Chamber of Commerce and IndustryNot long ago, two safe generalizations could be made about the Gulf monarchies: ruling families dominated their politics, and oil dominated their economies. In recent years that has begun to change. In Kuwait the parliament challenges the political predominance of the ruling family. Meanwhile, Dubai and, increasingly, the other emirates of the United Arab Emirates (UAE) have made real progress in diversifying their economies away from oil—at least until the recent economic crisis. Yet political liberalization and economic diversification have not gone hand in hand: Kuwait's economy remains dependent on oil, and the United Arab Emirates remains resolutely authoritarian. This is no accident. Kuwait's high level of political participation encourages its dependence on oil while the UAE's economic diversification requires a lack of political participation by citizens. The reasons for this are specific to the peculiar political economy of these labor markets: in these richest of rentier-states, there is little need for the class compromise between capitalists and workers on which capitalist democracy usually rests.Footnote 2
The UAE and Kuwait are very rich rentiers, and they have much else in common. Both are predominantly Arab Gulf countries with small citizen populations, around one million. They share a common history of relations with Britain. In the past their economies relied on trade and, for a period, pearling. Neither had much in the way of an agrarian economy with landlords and peasants. In both countries the ruling families form institutions that dominate political power as corporate groups.Footnote 3 These many similarities make these two countries excellent cases for understanding the effect of variation in the level of political participation on economic development.
There are some differences, of course, chief among them that the UAE is a federation (or, in some respects, confederation) of seven emirates, each with its own ruling family, and Kuwait is a unitary state with one ruling family. This poses some complications for my argument in making comparisons between the two countries. Most of the UAE's oil wealth is found in Abu Dhabi. A second emirate—Dubai—has led the way in economic diversification away from oil, and its ruling family enjoys a good deal of autonomy within the UAE. Nonetheless, the UAE's federal structure complicates but does not undermine my overall argument, and I address some consequences of federalism at later points in the article.
EXTREME RENTIERISM
The measures of rentierism commonly used in the literature on the resource curse do not distinguish well between rentierism that makes citizens rich and rentierism that does not. The measures usually employed are fractional: a country is typically considered a rentier when rent revenues make up a minimum percentage of all government revenues, when oil exports make up the bulk of GDP, or something similar. In these fractional measures, the denominator matters a great deal. Angola and Nigeria are just as much rentiers by these measures as are Kuwait and the UAE. Yet Emiratis are among the world's richest people and Angolans among the world's poorest. Fractional measures do not capture this, but per capita measures do.
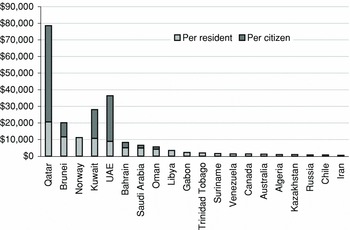
Figure 1 gives an indication of just how much the richest rentiers stand out from other rentiers when researchers use per capita measures. I divide rent revenues by both residents and citizens: in countries where oil wealth pays for importing vast amounts of poorly paid service labor, dividing the rents by the number of citizens gives a better sense of just how rich oil makes citizens. The UAE, Qatar, Kuwait, Brunei, and Norway are the richest of rentiers (data for Equatorial Guinea is missing in this series). Several other countries make up a second tier, including Saudi Arabia, Bahrain, and Oman. In the remaining countries, the sum of per capita rents from natural-resource exports trails off dramatically. Although the literature does occasionally acknowledge the distinction between rich and poor rentiers, only a modest amount of attention has been given to the consequences of this variation. Some studies set aside extreme rentiers as exceptionalFootnote 4 while most lump them together with far poorer rentiers on the basis that petroleum accounts for a similar percentage of government revenue or of the economy. Truly rich rentiers, however, have labor markets of a very peculiar sort that give rise to a set of class interests not found in poorer rentiers or in nonrentiers. The Gulf press has made note of the distinctive class interests that I discuss in this article although the academic literature has to my knowledge paid little attention to extreme rentierism's effects on labor markets and class politics.Footnote 5
Top twenty per capita net exporters of fuels and minerals in 2004 (U.S.$). Sources: World Trade Organization Statistics Database, http://stat.wto.org (accessed 29 July 2008); World Bank, World Development Indicators, http://www.worldbank.org (accessed 29 July 2008); Onn Winckler, Arab Political Demography (Brighton, U.K.: Sussex Academic Press, 2005), 43; United States Department of State, 2006 Report on International Religious Freedom, http://www.state.gov/g/drl/rls/irf/2006/ (accessed 27 May 2009).

ECONOMIC DIVERSIFICATION
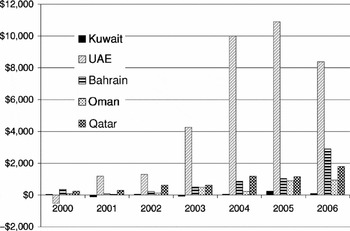
Although Dubai's economic boom is legendary, Kuwait has developed a reputation in the Gulf as a poor place to do business. This is not a point of occasional comment but of frequent discussion—and, in Kuwait, lamentation. It is not impossible to make money in Kuwait—oil exports provide a durable support to the economy—nor is there a lack of successful Kuwaiti companies. The leaders of these companies, however, complain consistently and loudly that Kuwait is a more difficult and less profitable place to do business than its neighbors in the Gulf, in particular Dubai. Economic figures bear this out. Kuwait badly lags behind the UAE—and all other Gulf states—in foreign direct investment (see Figure 2).
Inward foreign direct investment (U.S. millions). Source: United Nations Conference on Trade and Development (UNCTAD), World Investment Report 2007, http://www.unctad.org/en/docs/wir2007_en.pdf (accessed 27 May 2009).

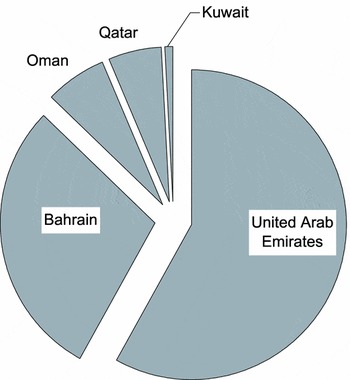
The gap became particularly clear as the recent boom in foreign direct investment spread from the UAE to the other Gulf states. In 1980 Kuwait's merchandise exports (less fuels and minerals) were 84 percent of those of the UAE. By 2006, they were only 5 percent, as a consequence of Dubai's success in the entrepôt trade.Footnote 6 The UAE had six and a half times more passengers at its airports in 2005 than did Kuwait, and container traffic at UAE ports was fourteen times greater than at Kuwait's ports.Footnote 7 In tourism, the picture is even starker. Kuwait makes some efforts to attract tourists but largely fails (see Figure 3). The prohibition on alcohol and the lack of major developments catering to tourists do not help, and Kuwait has fewer tourist arrivals than any other Gulf state.Footnote 8
International-tourism number of arrivals in 2003. Source: World Bank, World Development Indicators, http://www.worldbank.org (accessed 29 July 2008).

In Dubai, diversification has proceeded to the point that government revenues are increasingly derived from the productive nonoil economy rather than from oil receipts (although in the UAE as a whole, oil still reigns supreme).Footnote 9 For a rentier-state, this is perhaps the ultimate indication of successful diversification, but it also cements Dubai's dependence on foreign business and foreign residents. Dubai's explosive growth in recent years, along with its integration into the global economy, made it vulnerable to the global economic crisis that emerged in full force in 2008. Nonetheless, key elements of the Dubai model—especially the combination of First World infrastructure, an accommodating business climate, and low-cost labor—are likely to survive the current crisis in Dubai and among its better capitalized neighbors.
POLITICAL PARTICIPATION IN KUWAIT AND THE UAE
The stark economic contrast between Kuwait and the UAE is matched by an equally stark contrast in levels of political participation. Kuwait holds generally free and fair parliamentary elections with near universal adult suffrage for citizens. Its parliament is the strongest in the Gulf and among the strongest in the Arab world. At the heart of the parliament's power lies the ability of a majority of the elected members (less any who have been appointed to the cabinet) to interpellate and to vote no confidence in individual ministers. An interpellation is the parliamentary questioning of a minister that must precede a vote of confidence (in Arabic, the word is istijwāb; in the English-language press of the Gulf, it is a grilling).Footnote 10
The threat of interpellation profoundly shapes how Kuwait is governed in two ways. First, the ruling family avoids appointing ministers at risk of losing a parliamentary vote of confidence. This extends to members of the ruling family: as a consequence, family members who are responsive to the parliament are more likely to serve in the government and gain valuable political experience. Second, once in office, members of the government—or those who wish to stay there a long time—try to avoid offending the major parliamentary blocs. This can be accomplished by pursing policies congenial to the parliament and by dispensing patronage to its members. The end result is that the parliament, by wielding the threat of interpellation, has a substantial impact on policymaking in Kuwait.
The UAE lacks anything like Kuwait's parliament. The powers of the Federal National Council (FNC)—which is what passes for a national parliament in the UAE—are perhaps best summed up by the results of a survey of its members, who are presumably favorably inclined toward the institution: of the forty members of the body, thirty agreed (with varying degrees of emphasis) that “the power of the FNC is almost insignificant.”Footnote 11 This perception reflects the powers allotted to the parliament in the UAE's constitution, which makes the FNC an entirely advisory body.Footnote 12 Up until 2006, all forty FNC members were appointed by the rulers of the seven emirates. In 2006, half were elected by an electorate of some 6,000 citizens handpicked by the seven rulers.Footnote 13 One deputy who won a seat in the election described it as a “farce.”Footnote 14 The emirates of Abu Dhabi and Sharjah have appointive councils with advisory powers. Elections to councils have occasionally been proposed in Abu Dhabi, Sharjah, and Dubai, but none has been held.
The strength of Kuwait's parliament warrants an explanation, especially as it is unusual among the Gulf monarchies, although a full discussion of the issue requires much more detail than it is possible to provide here. The most convincing explanation for Kuwait's progress toward democracy is exogenous. In crucial episodes—after independence in 1961 and after invasion in 1990—the ruling family needed to demonstrate its legitimacy, and the best way to display (and maintain) that was via an elected parliament with real powers. The Iraqi irredentist claim of 1961 led to the constitution of 1962 (that the emir at the time was liberal in his inclinations also helped), and in the aftermath of the 1991 liberation, the al-Sabah restored the 1962 constitution. In the years since the 1992 elections, parliamentary life has taken on a self-reinforcing (or path-dependent) quality: elections and parliamentary life have created a political class invested in the parliament.
This political class gains its power, authority, and social status through winning elections, and it includes members of each major political current and ascriptive group in Kuwaiti society. By and large the accepted political leaders of their communities and political organizations, these politicians would lead opposition to any effort to close the parliament—as did most members of the suspended 1985 parliament. Today, the ruling family would find it difficult to create an authoritarian coalition capable of supporting a long-term suspension of parliament.Footnote 15 The UAE, by contrast, faced no threat from a foreign power comparable to that faced by Kuwait at independence, and this reduced pressure to grant a liberal constitution. Although the UAE does have a dispute with Iran over several offshore islands, the existential threat from Iran is much less than that posed by Iraq to Kuwait in 1961 and again in 1990. Iran does not make a territorial claim to all of the UAE; water, not flat desert, separates the two countries.Footnote 16
EXPLAINING DIFFERENCES IN ECONOMIC PERFORMANCE
Differences in the level of political participation alone do not explain the divergent economic performances of Kuwait and the UAE. Two other factors bear noting.
First, the structure of the Kuwaiti political system tends to encourage political deadlock. The parliament's powers are largely negative: it has the ability to stymie government action without the responsibility for rule that would come from the formation of the government by parliamentary parties. Were the government to have a reliable majority in parliament—as a result of parliamentary appointment of a commoner prime minister—some of the paralysis in large-scale projects would likely ease. This would especially be true of the sort of project spending that has direct and immediate benefit for Kuwaiti citizens, such as construction of new housing.
Second, Dubai's authoritarianism is not unusual in the Gulf. Something else must explain why this one emirate has met with such success in diversifying its economy. The best explanation lies in the odd confederal structure of the UAE and the competition it engenders among ruling families. Oil in the UAE is owned by the emirate in which it is found, the bulk of it in Abu Dhabi. Oil made the Al Nahyan of Abu Dhabi preeminent among their peers, and the Al Nahyan hardly needed private-sector growth to provide wealth or political influence in the years following independence in 1971. The rulers of some of the resource-poorer emirates recognized that their minimal prosperity required Abu Dhabi's money, so they allied themselves with the Al Nahyan as junior partners. Dubai's rulers took a different tack, however, and invested their substantial oil wealth in promoting economic growth to avoid becoming vassals of the Al Nahyan.
This policy, relentlessly pursued, has met with signal success, yet this success has changed the nature of competition among the ruling families. Rulers of the poorer emirates now have more opportunities to promote private-sector development in their own emirates. Overshadowed by the international prominence of Dubai, the Al Nahyan have seemingly decided to adopt elements of the Dubai model, albeit with more capital. The crown prince of Abu Dhabi—and dominant figure in the ruling family—said in 2006 that Dubai (and Singapore) are “a step ahead of us, but it's good to have a challenge,” a remarkable admission from the de facto ruler of the largest, richest, and most politically influential of the emirates of the UAE.Footnote 17 Although Dubai was no longer so obviously a “step ahead” after the onset of the financial crisis, key elements of its pioneering model will continue to influence the other emirates and the rest of the Gulf.
The federal nature of the UAE also poses the most serious threat to Dubai from the global economic downturn: Dubai's pursuit of its distinct development model has required political and economic autonomy within the UAE. An Abu Dhabi bailout of Dubai threatens that autonomy and thus the set of policies that have promoted rapid growth in Dubai. Of course, the model itself may survive, with the more deep-pocketed emirates (especially Abu Dhabi and Qatar) positioned to benefit when the global economy revives.
PARTICIPATION AND ECONOMIC DIVERSIFICATION
Although there is no monocausal explanation for the divergence in economic performance between Kuwait and the UAE, the level of political participation matters. The Kuwaiti private sector certainly does not hesitate to lay many of Kuwait's economic problems at the door of the National Assembly. Jasim Sadoun, a prominent Kuwaiti economist, said that “Kuwait has adopted the worst of democracy and the worst of dictatorship,” adding that “the country lives on oil revenues, which makes it a temporary country.”Footnote 18 A prominent Kuwaiti businessman complained that “what takes one year to accomplish in Dubai takes ten years in Kuwait” and claimed that the fastest way to wealth in Kuwait today is to become a member of parliament, echoing many complaints of corruption.Footnote 19 A front-page headline in Al-Qabas summed up a prominent view on the relationship between the parliament and economic growth: “The Kuwaiti Way of Democracy Blocks Development.”Footnote 20
That said, Kuwaiti merchants do not have a wholly negative view of the parliament. Democracy (as Kuwaitis see it) is an integral part of Kuwaiti political culture and identity. Yet there is often a palpable sense that many wealthier Kuwaitis would like to see the National Assembly's power weakened in a way that would open up opportunities for the private sector. Kuwaiti merchants, in blaming the parliament for private-sector problems, sound like many capitalists through the ages, yet the clear compatibility of private-sector wealth and democracy in the world's most economically advanced states belie their arguments. Extreme rentiers are different from other countries, however: the extremely high level of natural-resource wealth in these countries weakens the threads of mutual interest that usually tie together capital and wage labor.
STATE EMPLOYMENT AND THE DISTRIBUTION OF OIL WEALTH
One can imagine a variety of ways in which regimes in rich rentiers might distribute oil wealth—and rulers might just hoard it. In practice, a distinct pattern has emerged in Kuwait, the UAE, and Qatar, echoed to a lesser degree in Bahrain, Saudi Arabia, and Oman. In the initial years of the oil boom, these countries hired armies of foreigners to staff government offices because the citizen populations lacked the necessary education and skills to build modern states. Over time, citizens pushed hard to secure jobs in the public sector and in state-owned enterprises. Rulers sometimes resisted, but more often they encouraged citizens to seek education and join public service. By the 1970s, most citizens who held jobs in Kuwait, Qatar, or the UAE were employed by the state (or in a state-owned enterprise), and today the figures are around 90 percent. (States also indirectly distribute oil revenues in the form of generous public services, in particular for health and education.) These jobs, along with the resulting pensions, remain the primary way by which the Gulf states provide direct income support to citizens.Footnote 21 These jobs have gone to women as well as men, and as a result Kuwaiti women made up 40 percent of the citizen workforce in 2006; the female share was smaller (but rapidly increasing) in the UAE.Footnote 22
The paychecks that Gulf citizens receive from jobs held in the public sector are nominally tied to services rendered, but their pay might better be thought of as a monthly disbursement from the national trust fund. Politics and the price of oil in world markets, rather than local labor markets, determine the size of stipends paid to citizens. The number of citizens hired by the government is driven not by government need for employees but instead by the supply of citizens, with most new entrants to the job market receiving a position.
These rich rentiers also have substantial private sectors, staffed largely by foreigners. These expatriates almost without exception have no chance of gaining citizenship. Prevailing wages in the private sector are heavily influenced by the cost of labor in the home countries of the workforce, and some of these countries—Bangladesh, for example—have a very low cost of labor indeed. Expatriate wages in the private sector, for all but the most skilled labor, are well below wages paid to citizens in the public sector; hours are longer, job security more fragile, and performance expected. As a consequence, less skilled citizens have no desire to compete in the open labor market with immigrant labor from poorer Arab countries or labor from the even yet poorer countries of the Indian subcontinent. Public-sector wages thus set what economists call a “reservation wage,” and citizens in Kuwait, the UAE, and Qatar, rarely work for less.Footnote 23 It is not surprising that the private sector has little interest in employing citizens; this is especially true of those citizens with fewer skills.
Some citizens do work in the private sector. Governments sometimes require companies to employ citizens, although these mandates are more seriously implemented and enforced in the three comparatively poorer Gulf rentiers (i.e., Saudi Arabia, Bahrain, and Oman). In many cases, the only job responsibilities of Kuwaiti citizens hired by the private sector are to collect a paycheck. Well-educated citizens can compete with Western expatriate labor and earn higher wages than are offered in government positions, and some work as independent professionals. Finally, some citizens work in family businesses of varying sizes, but from the data released by the Kuwaiti and UAE governments, it is not possible to determine just how many citizens hold these jobs. Thus the reliance on government jobs is most pronounced in the less privileged parts of citizen society, among those who, on the private-sector job market, compete directly with unskilled or less skilled labor from the Indian subcontinent or poorer Arab countries. It is less marked in private-sector jobs that require a high level of expertise and offer generous wages.
CLASS POLITICS IN RICH RENTIERS
In Capitalism and Social Democracy, Adam Przeworski lays out the basic compromise that underlies class politics in capitalist societies, quoting the German Social Democratic leader Helmut Schmidt: “The profits of enterprises today are the investments of tomorrow, and the investments of tomorrow are the employment of the day after.”Footnote 24 Workers and capital might differ on the share of profits that capital keeps, but both have a basic interest in the profitability of the private sector as a whole.
This link is broken in the richest rentiers of the Gulf. Citizens who work for the state have little stake in the vitality of the private sector because it provides them neither with jobs nor with public services funded by tax revenues. The private sector, for its part, strenuously avoids hiring citizen labor. The severing of this link does not result in the redistribution of capitalist assets: Kuwaiti capitalists have enough political influence to prevent that. For their part, citizens outside the capitalist class rarely express hostility to the notion of employment in the private sector. However, they do have little stake in adopting policies that promote the private sector, especially when those policies impose social and cultural costs on citizens. The result is a distinctive form of class conflict in the Gulf in which salaried citizen employees of the state have a jaundiced attitude toward the private sector while the private sector views most citizens as parasites on the state and avoids hiring them.
Although this class distinction is almost wholly overlooked in studies of Gulf monarchies, it should not be exaggerated. Cleavages of sect and tribe often trump economic divisions, many families rely on a combination of different sorts of income, and class membership is not always similar across the extended families that are so fundamentally important in Gulf society. That said, a substantial chasm of suspicion and contempt often separates the two groups, particularly in Kuwait, where politics are freer, class differences more openly expressed, and class distinctions overlap with an identity cleavage between recently settled bedouin and Kuwaitis of long-standing urban residence.Footnote 25
A 2006 survey of Kuwaiti voters conducted by the National Assembly illustrates citizens' perceptions of their interests. Surveyed voters were asked to select ten out of nineteen possible priorities that they thought the National Assembly should pursue in its upcoming session. The top-ranked choice was a parliamentary proposal to have the government pay off consumer debts. Health services and housing (both seen as government responsibilities) were second and third. Three of the nineteen items directly concerned the growth of the private sector: privatization ranked sixteen, reforming the stock market was eighteen, and encouraging foreign direct investments came in dead last.Footnote 26 In early 2009 the Kuwaiti government sent a proposal to the assembly to bail out investment companies: one prominent member of parliament opposed the plan on the grounds that investment companies “do not pay taxes on their funds and do not participate in any way worth mentioning in . . . creating jobs for Kuwaitis.” He then explicitly contrasted this with the American private sector, implying that it deserved a bailout precisely because it paid taxes and employed citizens.Footnote 27
In Kuwait, Qatar, and the UAE, the failure to wean citizens from dependence on public-sector jobs may be myopic in the long run. Some day oil will run out. Yet that day is not coming soon in the richer rentiers although clearly the recent global economic crisis has brought an end to a remarkable period of economic plenty in the Gulf. The International Monetary Fund (IMF), usually an advocate of fiscal caution, commented in 2005 that “the vast resources of the UAE may be sufficient to pay a reasonable annuity” to every citizen who wants a job into the foreseeable future; although this may reflect the optimism of the times, it is nonetheless true that these Gulf states have a lot of oil and not so many citizens.Footnote 28 Qatar, with a small citizen population even by Gulf standards, sits on the third largest pool of natural gas on the planet.Footnote 29 Kuwait's supplies appear more prone to exhaustion than those of the other two, but reserves are sufficient to mid-century and probably substantially longer.Footnote 30 If the 2008 global financial crisis meets the expectations of the most committed pessimists, the implicit jobs guarantee in the rich rentiers will be tested sooner rather than later. Yet the more likely scenario is eventual global economic recovery, with a corresponding recovery in the price of oil. Myopia may have severe consequences, but they may not be apparent for a while.
The consequences of oil wealth in Bahrain, Saudi Arabia, and Oman differ from those in their richer Gulf Cooperation Council counterparts. Citizens in these countries have a very strong preference for state employment; very large numbers work for the state. Nonetheless, oil revenues are not sufficient to offer the sort of guaranteed state employment found, for example, in Qatar.Footnote 31 In the relatively poorer rentiers, a substantial group of citizens must find jobs in the private sector, and thus citizens have a stronger interest in private-sector growth and economic diversification. These countries have very large noncitizen populations, and citizens do not want to compete directly with foreigners for jobs: head-to-head competition with labor imported from poor countries drives down the wages earned by citizen labor. Businesses, by contrast, have a strong interest in avoiding citizen labor because it is more expensive that foreign labor in wages, productivity, ease of dismissal, and otherwise. This establishes the basic contours of class conflict in these societies. Governments have responded by walling off some parts of the private-sector job market from foreigners. Official Saudi figures show stability in the foreign percentage of the population up to 2004 although more recent reports suggest a rapid increase in the number of foreign workers in the later years of the economic boom.Footnote 32
The UAE's oil wealth is found primarily in Abu Dhabi; Dubai and Sharjah have comparatively modest oil wealth, and the remaining emirates have little or none. This raises the possibility that the citizens of Dubai and the other poorer emirates have an interest in private-sector growth that parallels that of citizens of Bahrain or Oman. Yet employment patterns across even the poorer emirates of the UAE resemble Kuwait, Qatar, and Abu Dhabi much more than Bahrain or Oman. Few UAE citizens seem compelled to work in the private sector although many commute from poorer emirates to government jobs in Abu Dhabi or Dubai.
POLICY CONSEQUENCES OF DIFFERENCES IN PARTICIPATION
Kuwait's parliament does what it is designed to do: it represents citizens, most of whom rely on government jobs. In the UAE, in the absence of a parliament, political power resides primarily in the hands of those who have an interest in private-sector growth. Ruling families dominate the political systems, but merchants—decidedly second fiddle to ruling families—have more representation in the federal and emirates' governments than any group outside the ruling families.Footnote 33 Tribes and technocrats enjoy some representation also. The group most clearly underrepresented is Emiratis of average means from nonelite families and without elite educations.
RULING FAMILIES, FOREIGNERS, AND THE ECONOMY IN THE UAE
In the absence of parliamentary constraints, the UAE's ruling families have made themselves into the leading capitalists in their emirates. Because the families control policymaking, it is not surprising that policy reflects their interests. In Dubai the economic dominance of the ruling family is most apparent: it is not for nothing that Dubai is often dubbed “Dubai Inc.,” with the members of the ruling family (the Al Maktoum) as the main shareholders. The IMF notes that the “financial activities” of the emirate's government “interact with activities of the Ruler's Court, and the lines defining and separating various revenues and expenditure . . . are not very clear.”Footnote 34
This blurring is particularly profitable in real estate. Land outside of developed towns is traditionally considered to be the ruler's personal property, at least according to the ruler.Footnote 35 Today three immense holding companies, largely devoted to real estate, dominate much of the economy. The ruler personally owns the largest, Dubai Holding, and Moody's Investors Service points out that the company's business model is supported by “free land grants from the government.”Footnote 36 The Dubai government owns a second company while the third is publicly traded (although the government owns a third of this company also).Footnote 37 These companies have headed an astounding construction boom in Dubai, the city that led the world in 2007 in the amount of office space under construction. This was accompanied by a corresponding amount of residential construction.Footnote 38 A local newspaper reported in early 2007 on a scheme to build a commercial district—Dubai Business Bay—“along the lines of Manhattan of New York or the Ginza of Tokyo.”Footnote 39 Two of the planned “palms,” artificial peninsulas built off the shoreline into the Gulf, are intended to have a million residents each.Footnote 40
Some of this will not be built soon or perhaps ever. However, there are not enough Emirati citizens to fill up even the already constructed offices and homes. For the investments of the various ruling families to pay off, expatriates must move to Dubai and the other emirates of the UAE, buy residences, rent office space, and start businesses. This can be accomplished only if the UAE remains attractive to foreign shoppers, tourists, investors, and businesspeople. Unfettered by a parliament, the rulers have pursued this goal. Dubai in particular feels markedly more liberal in its social mores than Kuwait. Alcohol, for example, is legal, women are more fully a part of public space than elsewhere in the Gulf, foreign entertainers give concerts, and so forth. As a major Western newsweekly puts it, “Westerners are welcome, along with their vices. Europeans in bikinis mingle on the beach with Muslim women in abayas; alcohol flows freely at Dubai's nightclubs and resorts.”Footnote 41
The UAE's business model also relies on abundant, low-cost labor. The IMF, in comments of a sort regularly seen in the English-language business press in the region, points out that the “internationally competitive wages” paid to expatriate workers in the UAE's private sector fuel its expansion and warns that restrictions on recruiting foreign labor (via quotas and so forth) would limit growth.Footnote 42 Again, without constraints imposed by citizens via a parliament, the result has been a flood of foreigners into the UAE: Dubai's population increased by almost 300,000 in 2006 alone, in a country with a citizen population under 900,000.Footnote 43
THE RULING FAMILY, THE PARLIAMENT, AND THE ECONOMY IN KUWAIT
In Kuwait, the government—not the ruling family—owns something on the order of 90 percent of the country's real estate. The consequence is that projects entailing any substantial amount of open land, including seafront, require that the private sector secure access to government land. However, land is a highly politicized issue in Kuwait. In the 1950s, shaykhs laid claim to vast swaths of Kuwait's available land until reined in by the emir.Footnote 44 In some areas of Kuwait, notably Shuwaikh and the “chalets” on the coast, leasing agreements entered into by the government in the past have led, in practice, to de facto ownership of land by private parties.Footnote 45 As a result, parliament remains extraordinarily suspicious of any contracts involving state lands.
When the government opens up land for development, it does so under a build, operate, transfer (BOT) mechanism, in which the private sector finances, builds, and operates the facility. The government retains title to the land, and the entire development transfers back to the government at the end of a period ranging from twenty to forty years. Outside Kuwait this arrangement is usually used for infrastructure projects such as roads or wastewater treatment plants. In Kuwait it is used for virtually any project that requires state land, including, for example, the larger and newer mall developments on the seafront. A survey of business leaders by the Kuwaiti daily Al-Qabas found that 90 percent thought that the new parliament should make it a priority to “break the grip of the state on land.”Footnote 46
The challenges facing the private sector do not end there, however. Although Kuwait has successfully implemented some BOT projects (several malls, a wastewater treatment plant), many more projects have languished as a result of bureaucratic inaction. Al-Qabas laments delays in a number of projects—some involving a BOT mechanism, others not—as a result of “democracy in the Kuwaiti style.” These projects include the following:
• development of two offshore islands (Failaka and Bubiyan) for tourism, residences, and a new port;
• development of a new city (“City of Silk”) mostly for residential purposes;
• expansion of the airport and modernization of the seaport;
• construction of a subway;
• creation and development of free zones;
• building of the Subiya causeway across Kuwait Bay; and
• development of the northern oil fields.Footnote 47
There are multiple reasons for project delays. The causeway, for example, was held up by officials responsible for the environment: one said that “[w]e are not like elsewhere in the Gulf, where projects get the go-ahead [with] only limited environmental impact assessments.”Footnote 48 Developers have complained that BOT timelines give them too little time to make a profit on their investments before transferring them to the government.Footnote 49
However, perhaps the most serious issues grow out of a parliamentary suspicion that major contracts unfairly enrich merchants who gain them through corruption and influence. In one case, the government retroactively suspended BOT agreements on the grounds that the initial contracts were flawed by corruption, taking over a prominent project after a private-sector company had invested millions. A court later overruled the government, but the episode did not inspire confidence in the BOT mechanism. Yet some members of parliament reacted by asking why more BOT contracts were not cancelled, including one for a project involving the emir's son.Footnote 50 The Middle East Economic Digest said that, out of a desire to avoid “friction with the National Assembly,” bureaucrats “involved with Kuwait's landmark infrastructure schemes are happy for every possible avenue to be explored before making decisions.”Footnote 51 The head of a prominent Kuwaiti architectural firm commented that projects do not get approved because “previous decision makers have found themselves in the [public prosecutor's] office being accused of squandering public funds.”Footnote 52
Only a few of these projects, in any case, promise to promote diversification beyond oil. The ambitions of the Kuwaiti private sector, in this regard, should be put in some perspective: the private sector wants the government to spend its riches on major infrastructure projects while the average Kuwaiti wants the government to distribute revenues directly to citizens. It is less an argument about diversification than about how the oil wealth should be distributed. There are positive aspects to parliament's close oversight: parliament is imposing its control over state resources, creating and enforcing a norm that state property should be used in the service of the people and not for the benefit of those close to the regime. However, it is done in a context in which there is no pressing need to keep the private sector healthy, profitable, and job generating. The Kuwaiti capitalist class is notably lacking in Charles E. Lindblom's structural power of capital, by which the need to create an attractive environment for business growth constrains the policy choices of democratic leaders.Footnote 53
FOREIGNERS
Over the past several years, Kuwait has seen a major influx of foreigners—although not the flood that has inundated the citizen population of the UAE. Foreigners make up two-thirds of Kuwait's population, yet the number of expatriates is not a point of contention between citizens and the government, in sharp contrast to the situation in the UAE. Kuwaitis who find the situation problematic view it as a national failure that cuts across economic classes and identity groups. Foreigners make life easier for Kuwaitis by doing much of the hard work of cleaning houses, cooking food, raising children, and so forth: foreign labor is an item of luxury consumption. In many ways, foreigners are a drag on the Kuwaiti economy. Foreigners send remittances back home, and their presence in the country also imposes costs on the government that it does not recoup in service fees or taxes.Footnote 54 Foreigners in Kuwait generate convenience; in Dubai, foreigners generate foreign exchange.
Kuwaiti authorities do not go out of their way to create a welcoming environment for foreigners. By contrast, their counterparts in Dubai, and increasingly in the other emirates, go to great lengths to make foreigners (or, to be more specific, better-off foreigners) feel welcome, encouraging them to visit, reside, and do business. The difference in atmosphere between Kuwait and Dubai is apparent after even a few hours in each city. Kuwait is clearly a country for Kuwaitis. It is not that Kuwaitis are not welcoming (at least of Westerners), but one quickly senses that foreigners are in Kuwait in order to make life easier for Kuwaitis in general and not to play a central role in the ruler's ambitions to create a thriving and cosmopolitan metropolis. A Kuwaiti student summed up his view of the difference: “In Dubai, an Emirati rides a bicycle, and an Indian drives a Mercedes.” Although hardly accurate in the details, this quip gets at the heart of the difference in atmosphere between the two cities.
In Dubai, citizens have fled the city center for several suburbs, most notably, Mizhar and surrounding neighborhoods, abandoning their original neighborhoods to foreigners.Footnote 55 In Kuwait, too, citizens have left the old city core as a result of government purchases of property intended, as much as anything else, to redistribute oil income. However, many of the best Kuwaiti suburbs are those that ring the old city core, and most of the city consists of villas occupied by citizens. In a real sense, citizens dominate the landscape of Kuwait. In Dubai, by contrast, soaring residential and office towers dominate the topography of the city, with citizens relegated to the fringes. Even there, in citizen neighborhoods like Mirdif, better-off Western expatriates have also taken up residence, and well-tanned Westerners in tank tops and shorts can be seen walking about the main Mirdif mall.
Kuwait's cultural atmosphere reflects the Islamist leanings of the largest bloc in parliament. In Kuwait, a minister of information lost his job after controversies that started with Islamist anger over a concert featuring Arab pop stars.Footnote 56 Dubai authorities, as a part of efforts to attract tourists and residents, allow concerts by a variety of entertainers, Arab and Western: these have included Shakira, Pink Floyd, and Mariah Carey.Footnote 57 Kuwait's parliament banned alcohol back in the 1960s, over the objections of the ruling family.Footnote 58 This cripples Kuwait's tourist industry and, reasonably or not, makes Kuwait less attractive as a regional business center. The policy is unlikely to change. During the 2008 election campaign, a prominent member of parliament declared,
The Kuwaiti people have made it clear that this is a conservative country and that they will not accept any threat to values or morality. We will resist and strike on the head anyone who wants tourism on the islands and in hotels built on alcohol and prostitution. We know the names of those who want this, but we will confront them anyways.Footnote 59
He directed his threat at the minister of information, a shaykh of the al-Sabah. Although this was in part political theater—no one will be hitting shaykhs on the head—neither will the parliament be making any substantial concessions to encourage tourism.
We might conclude, then, that the UAE, were it to have a parliament like Kuwait's, would put an end to the sort of development seen in Dubai. It is possible, however, that the UAE differs from Kuwait not just in the level of participation but also in the attitudes of citizens toward economic growth, public morality, the role of the ruling family in the economy, and so forth. If this is the case, even in a counterfactual world in which the UAE had a parliament, development on the Dubai model would proceed nonetheless. On balance, however, evidence does not suggest that this is the case.
The UAE and Kuwait are similar on a wide variety of measures: culture, religion, language, the nature of British rule, oil wealth, dynastic regimes, and so on. Islamists tend to do well in Gulf elections, in Bahrain and in Kuwait as in the rest of the Arab world. The UAE is not immune to Islamist influence: one Emirati author writes that “the Islamists successfully captured the discourse in the UAE” in the 1990s, when “the return to Islam became a means of regaining one's true cultural identity.”Footnote 60
The UAE truly lacks a visible, organized political opposition either within its borders or outside. This is partly attributable to the authoritarian nature of the regime, but it has not always been this way. In the 1930s, and then again in the 1950s, opposition movements emerged in Dubai. The 1938 movement was driven, more than in Kuwait, by a dissident branch of the ruling family. In the 1950s the National Front emerged, with support from prominent Dubai merchant families. Among its goals, according to a dissertation written by an Emirati, was to “stop further immigration into Dubai from Persia, India, and Pakistan” and “to oppose the autocratic and traditional system of rule by the pro-Persian Al Maktum family.”Footnote 61 The movement faded away in the 1960s, although the sense of grievance about foreigners, and Al Maktoum autocracy, has not.Footnote 62
In the second half of the 1970s, tensions among the ruling families, and especially between the Al Maktoum and Al Nahyan, opened up a space for public expression of political opinion by UAE citizens, and thousands took to the streets in support of a stronger federation that would curb Dubai's autonomy. Shaykh Zayid, ruler of Abu Dhabi and president of the UAE, favored a new federal constitution that would have given the federal government ownership over oil revenues, strengthened the office of the president, and set up a parliament with powers of interpellation similar to those enjoyed by the Kuwaiti parliament. A crucial 1979 memorandum, drawn up by a joint committee of the government and the FNC, laid out the concerns of those who favored a stronger federation. It amounted to a criticism of Dubai and, among other things, called for curbs on immigration and federal oversight of development in the emirates with the goal of ensuring that development took into account “domestic factors and population policy.”Footnote 63 The proposed constitution won the enthusiastic support of Emiratis from all emirates, and thousands joined demonstrations in favor of Zayid and a stronger federation.Footnote 64
Dubai's ruling family vigorously fought the proposed constitution, recognizing that it would limit the policymaking freedom that they needed to develop Dubai's economy. In the end, Dubai won, and the constitutional structure of the UAE remains essentially as it was at independence.Footnote 65 Abdullah Taryam, who was involved in these events, has written that, as a consequence of this failure, “haphazard development, coupled with unhealthy competition between emirates, led to unprecedented influxes of foreign workers who eventually outnumbered the local population and caused grave social, cultural, and economic problems.”Footnote 66 In recent years, Emirati public opinion has been more difficult to determine, given the absence of real elections, polling on sensitive issues, and the general lack of an organized opposition. A survey of citizens at the university revealed a strong preference for democracy.Footnote 67
The FNC, reflecting public concerns, conducted a “long-running” debate in the 1990s on the demographic issue.Footnote 68 Emirati intellectuals, many of them professors at the national university, have been the most prominent citizen voices on political issues, and they have bemoaned the flood of foreigners into the UAE, sometimes with a sense of urgency and more often with a tone of resignation to a deeply troubling reality. In 2007 Jamal Al-Suwaidi, head of the prominent Emirates Centre for Strategic Studies and Research, said in a widely noted local newspaper interview that, when he visited a mall in Dubai, “I felt awkward, as everybody there was staring at me as if I was from another planet. It was because I wore a kandoura [dishdasha].” He added that sometimes “we feel like strangers in our own country.”Footnote 69 Abdulkhaleq Abdullah, a professor at the UAE's main national university, wrote in a newspaper editorial that “there is a limit to how much one can conceal the deadly demographic imbalance in the UAE. The numbers alone, which have reached critical levels, are frightening.”Footnote 70 Abd al-Rahim al-Shahin, a scholar from the northern emirate of Ras al-Khaimah, wrote that “cries have risen warning of the possibility of a retreat of the Arab border—or part of it—to what is behind the oil wells” as a result of demands for the right of self-determination by the demographic majority.Footnote 71 Interviewed for a 60 Minutes segment on Muhammad bin Rashid, Ebtisam al-Kitbi, a professor of political science at the main national university, pointed out that Emiratis have been “put in a situation they didn't choose. Nobody asked them, ‘What do you want? Is it really, this is what you want?’”Footnote 72 In the prominent Arab scholarly journal Al-Mustaqbal al-ʿArabi, economics professor Yousif Khalid al-Yousif criticized Gulf ruling families for “transforming the islands and the desert that the people used, in the past, to make a living and for recreation into private plots surrounded by fences and guards.” He complained that the ruling families also “issued thousands of visas to foreign labor, throwing them into the country . . . only to achieve profits even if [the country's] identity is lost.”Footnote 73
Christopher Davidson, who has written extensively on UAE politics, noted that “[w]ith accelerating foreign ownership, many of the nationals, both young and old, feel that Dubai's development is not really for their benefit any more.”Footnote 74 Some Emiratis went so far as to welcome the global economic crisis, at least initially, as a way to reduce the number of foreigners: Abdulkhaleq Abdullah called it a “blessing.”Footnote 75 These widespread concerns about the foreign presence and national identity, however, do not garner much sympathy from Muhammad bin Rashid, ruler of Dubai. He once said in a newspaper interview, “As for those who focus on the side effects [of Dubai's economic boom], who consider them negative and try to inspire fear, they are shortsighted or just speaking their minds or suffering from inferiority complexes, which are hard to cure.”Footnote 76
In short, evidence suggests that the difference in economic performance between the UAE and Kuwait does not lie primarily in variation in the political attitudes of citizens but instead in the opportunities that they have to express those attitudes. Kuwaitis have a parliament, and the parliament has enough power to keep the ruling family in check, to ensure the cultural and social dominance of citizens in their own country, and to squelch an overenthusiastic liberalism intended to attract foreign business and tourists. Citizens of the UAE lack this power, and their interests are not reflected in government policies that pursue diversification at the cost of overwhelming levels of immigration, cultural change, and a loss of identity.
CONCLUSIONS
In the very richest of rentier-states we would expect to find the pathologies of the resource curse most fully manifested. We do in Kuwait and the UAE, but they are not the pathologies that the literature leads us to expect. Despite Kuwait's utter dependence on oil, its parliament has become notably stronger in recent years. However, Kuwait's higher levels of political participation have exacerbated its economic dependence on oil. In the UAE, by contrast, oil has not prevented the creation of a thriving entrepôt in Dubai and the increasing diversification of its economy. Yet growth, in its current form at least, is incompatible with the sort of citizen political participation seen in Kuwait. The curse of oil in the Gulf—if it can be called a curse at all—works in unexpected ways.
My argument has several further implications for the larger literature on the resource curse. First, the similarities between Kuwait and the UAE run deep, and they share an extreme rentierism found only in a very small number of other countries in the world. Nonetheless, they have experienced a surprisingly wide divergence in outcomes, and the best explanation for this divergence is variation in the level of political participation. This provides yet more evidence that, as other scholars have observed, oil does not mechanically predict outcomes, even when oil arrives in similar quantities in similar situations.Footnote 77
Second, it matters how rentierism is measured. The effects of rentierism on labor markets depend not on the relative importance of rents in the economy (as measured by fractional measures of rentierism) but instead on per capita levels of rent income. Extreme rentierism vitiates the class compromise on which modern capitalism rests, but poor rentierism does not. In poorer rentiers the interests of capital and labor resemble those of their counterparts in nonrentier economies. In poor rentiers, rent wealth cannot provide a stipend to most citizens (in the form of a state job or otherwise), and the average citizen thus depends on the private sector for employment opportunities.
A number of countries fall in a middle ground, between the richest and poorest rentiers on a per capita scale of rentierism, including the other three Gulf Cooperation Council states, Saudi Arabia, Oman, and Bahrain. These countries have a long tradition of foreign-labor immigration, and they share the type of class conflict found in the richest rentiers. Many citizens work for the state, and private-sector employers have a strong preference for foreign labor over citizen labor. Yet some citizens must find employment in the private sector. Class politics in these countries revolve around the balance between private-sector desires to employ foreigners and needs of the citizen working class to find private-sector employment. This paper helps us understand the nature of class conflict in these societies and how it differs from that in nonrentiers.
Is there any hope for combining political participation and economic diversification in rich rentiers? The high levels of participation in Kuwait are flatly incompatible with the sort of economic diversification seen in Dubai: the Kuwaiti parliament simply will not take the steps necessary to attract foreign business and foreign workers, nor will Kuwaitis tolerate the geographic, political, and economic marginalization of citizens or the blurring of lines between the ruling family's business interests and that of the state. The impossibility of the Dubai model forecloses the rapid creation of a nonoil, productive economy.
However, several slower routes to diversification may be possible. The private sector might put to good use the labor of more skilled Kuwaitis who find state employ too stultifying and not well enough paid: the emir's desire to turn Kuwait into a banking center would contribute nicely to this sort of diversification, although Kuwait faces stiff competition from other Gulf states. The private sector might employ expatriate labor in ways that do not threaten Kuwaitis' conservative mores or marginalize citizens in their own country. This would be easiest to accomplish in areas outside Kuwait City and in industries with a low profile. The result would be a different sort of diversification than that found in Dubai: it would be built not on providing a social environment congenial to foreigners but on finding a way to isolate and limit the impact of foreign workers on citizens.
The prospects for a Kuwaiti-style parliament in the UAE are dimmer than the prospects for some measure of economic diversification in Kuwait. A Kuwaiti-style parliament in the UAE would repudiate Dubai's economic model. However, this would come at an enormous cost to the expatriate middle class in the UAE. Four out of every five residents do not hold Emirati citizenship. Many are transient laborers or temporary residents whose gains from employment in the UAE are perhaps marginal. However, many foreigners, mostly from poorer countries, have created lives in the UAE that give them, and their children, more opportunities than they would have otherwise. As time goes on, and the UAE further diversifies, this foreign middle class will become larger, more permanent, and more fundamental to the economy of the UAE. It is here that we find the central dilemma of democratic development in the Gulf. Even the most fervent advocate of democracy must pause when considering the consequences for these noncitizens of a powerful parliament representing only citizens.
At the same time, one can fully understand the envy of many Emiratis when comparing their country's politics with Kuwait's, and one can understand their fear of being overwhelmed by foreigners in what is, after all, their own country. The dilemma is not solved, for citizens at least, by a democracy that includes those who are now noncitizens because this would finalize the citizenry's loss of control of the country and could even bring an end to the Arab identity of the UAE. In the end, the most obvious beneficiaries of this dilemma are the ruling families, who provide each group with their second preference. The ruling families protect citizens from a democracy of the noncitizen majority and protect noncitizens from a democracy of the citizen minority. On this basis is built a durable authoritarianism.