




No CrossRef data available.
Working memory and aging: A cross-sectional and longitudinal analysis using a self-ordered pointing task
Published online by Cambridge University Press: 01 July 2004
Abstract
Age-related declines in working memory performance have been associated with deficits in inhibition, strategy use, processing speed, and monitoring. In the current study, cross-sectional and longitudinal methodologies were used to investigate the relative contribution of these components to age-related changes in working memory. In Experiment 1, a sample of 140 younger and 140 older adults completed an abstract design version of the Self-Ordered Pointing Task modeled after Shimamura and Jurica (1994). Experiment 1 revealed that only processing speed and monitoring explained age differences in SOPT performance. Participants in Experiment 2 were 53 older adults who returned 4 years after the initial testing and 53 young adults. A task that assessed the ability to generate and monitor an internal series of responses as compared to an externally imposed series of responses was also administered. Experiment 2 replicated the key findings from Experiment 1 and provided some further evidence for age-related internal monitoring difficulties. Furthermore, the exploratory longitudinal analysis revealed that older age and lower intellectual abilities tended to be associated with poorer performance on the SOPT at Time 2. (JINS, 2004, 10, 489–503.)
Keywords
Information
- Type
- Research Article
- Information
- Journal of the International Neuropsychological Society , Volume 10 , Issue 4 , July 2004 , pp. 489 - 503
- Copyright
- 2004 The International Neuropsychological Society
INTRODUCTION
Older adults often report having to work harder when completing complex everyday tasks, and working memory has been implicated in some of these difficulties (Wilson et al., 1997). For example, when cooking, one must keep the overall goal (recipe) in mind while performing various sub-goals in sequence (preheating the oven, cutting vegetables, etc.). In essence, one must guide and actively monitor one's behavior from an internal representation, or, in other words, use working memory. Baddeley and Hitch (1974) originally described working memory as consisting of three subcomponents: the phonological loop and visuospatial sketchpad, which are responsible for the transient storage of speech-based and visuospatial information respectively; and the central executive, which manipulates and controls the above slave systems. Although the central executive remains the least understood of the three subcomponents (Baddeley & Hitch, 1974), there is general agreement that the central executive is involved in the selection, planning, attentional allocation, and control of various cognitive processes (see Miyake & Shah, 1999). In addition, it is widely accepted that other factors outside of working memory, including slowed processing speed and reduced inhibitory control, can affect the amount and/or type of information available for active monitoring within working memory (see Miller & Cohen, 2001). In the present study, we use both cross-sectional and longitudinal methodologies to further explore the nature of working memory deficits in older adults.
Cross-Sectional Research
The results of cross sectional studies have consistently shown that the working memory performance of older adults is poorer than that of younger adults (Fisk & Warr, 1996; Hultsch et al., 1998; Salthouse, 1994). Within the aging literature, several theories have been postulated to explain the nature of these age-related differences. These theories include deficits in inhibition, processing speed, and strategy use. First, the inhibition theory postulates that older adults have a primary deficit in the ability to inhibit task-irrelevant thoughts (Hasher et al., 1991; Hasher & Zacks, 1988; Lustig et al., 2001; May et al., 1999). This results in the maintenance of irrelevant information in working memory. Related to this position is the hypothesis that proactive interference leads to age-related decline in working memory (Shimamura & Jurica, 1994). Proactive interference occurs when information that was relevant to task performance on previous trials interferes with current task demands. Thus, an older adult's inability to inhibit the information from previous trials (proactive interference) is thought to decrease working memory performance on the current trial. Here, working memory storage is intact, but it is overloaded by a deficient inhibitory system.
Second, deficient strategy use by older adults has been postulated to account for age changes in working memory. Numerous studies indicate that older adults do not spontaneously organize incoming information as often or as well as younger adults (Craik, 1977; Smith, 1996). Daigneault and Braun (1993) compared the performance of older and younger participants who reported spontaneously developing and not developing a task strategy during completion of a working memory task. They found that the older adults failed to benefit from the use of a strategy, suggesting that older adults may be impaired in their exploitation of effective strategies while performing a working memory task.
Third, in its strong form, the processing speed theory proposes that age differences in working memory performance are largely accounted for by differences in processing speed (Salthouse, 1994; Salthouse & Meinz, 1995). This position has been supported by the work of Salthouse and his use of statistical procedures to uncover the amount of age-related variance in working memory tasks that is accounted for by processing speed tasks (see Salthouse, 1994 for a review). In general, Salthouse has typically found that processing speed accounts for a substantial amount of the variance in working memory performance and causes age to become an insignificant predictor.
Longitudinal Research
Despite substantial cross-sectional evidence for age-related deficits in working memory, there is little research on working memory change over time within the same individuals. Although several longitudinal studies have included working memory measures (e.g., Baltimore Longitudinal Study of Aging, Austrian Stroke Prevention Study, and Atherosclerosis Risk Study), these studies have not focused on age-related working memory change in normal older adults. To our knowledge, the Victoria Longitudinal Study (VLS) is the only published longitudinal study of normal older adults that has focused on working memory change across time (Hultsch et al., 1992, 1998). The working memory measures used in the VLS included both verbal and nonverbal working memory span tasks. The second wave of testing was conducted three years after the first wave. These investigators found a significant decline in verbal working memory performance across time, with the oldest cohort (age 71–86) showing more decline than the younger cohort (age 55–70). No significant change over time was found for nonverbal working memory. The potential influence that inhibitory and strategic factors may have played in the noted verbal working memory decline was not fully addressed. These authors did, however, investigate the processing speed hypothesis. Contrary to Salthouse's work (see Salthouse, 1994, for a review), they found that controlling for processing speed did not completely eliminate the longitudinal age-related decline observed in verbal working memory performance (Hultsch et al., 1992).
Measurement of Working Memory
Researchers continue to differ on the best way to measure the construct of working memory. Many of the cross-sectional aging studies employed a few widely used working memory measures, including the computation span and reading span tasks (Salthouse, 1994). These span tasks require the participant to answer questions (or solve arithmetic problems) while also remembering information about the presented stimuli (e.g., for the reading span task, participants are asked to remember the last word in each sentence that is presented; for the computation span task, the last digit in each problem). Although span tasks are commonly used in working memory research, it is important to investigate the construct of working memory using multiple methods.
Within the neuropsychological literature, considerable attention has been paid to decomposing components of global working memory tasks (Shimamura & Jurica, 1994; West et al., 1998; Wiegersma et al., 1990), and to localizing the processes involved in working memory tasks using PET and lesion studies. One such neuropsychological task, which was developed to assess the planning and monitoring aspects of working memory, is the Self-Ordered Pointing Task (SOPT; Petrides & Milner, 1982). In this task, a set of stimuli are arranged in different spatial locations on each of multiple sheets of paper. On each sheet, the participant must point to a stimulus item that was not previously chosen. To prevent the participant from using a strategy that would make the task too easy, selecting the same location on three consecutive sheets is not allowed. Because a given item appears in a different location on each successive sheet, the SOPT requires the participant to actively monitor a sequence of self-generated responses to avoid repeating a response.
The SOPT is particularly well suited to the study of working memory decline in older adults for the following reasons. First, the SOPT is well validated as a relatively selective frontal lobe measure by both lesion and PET studies (Petrides, 1995, 1996; Petrides et al., 1993; Petrides & Milner, 1982), and the prefrontal area has been implicated in working memory ability (Petrides, 1996; Smith & Jonides, 1997). Second, performance on the SOPT is impaired in normal older adults, and in recent years there has been evidence suggesting that the prefrontal areas of the brain may show disproportionate decline with respect to other areas in normal aging (e.g., Martin et al., 1991; Raz, 2000; see West, 1996, for a review). Third, the SOPT allows for the computation of several variables that can be used to investigate the nature of the working memory deficit in older adults. These variables include measures of proactive interference (Shimamura & Jurica, 1994), perseveration and monitoring (West et al., 1998), and strategy exploitation (Daigneault & Braun, 1993).
Previous studies have attributed older adults' poorer performance on the SOPT to one or more of the following factors: proactive interference, poor monitoring, and deficient strategy exploitation. For example, in comparison to younger adults, Shimamura and Jurica (1994) found that older adults in their 60s exhibited impairment on the second but not the first SOPT trial (a trial being one completed administration of the SOPT). Because similar stimuli were used for both trials, the authors hypothesized that the older adults exhibited heightened proactive interference due to difficulties distinguishing responses made during the first trial from those made during the second trial.
Other researchers, however, have found that proactive interference does not appear to be a cause of the working memory impairment in older adults (West et al., 1998). Instead, a study by West et al. suggested that older adults have a problem with monitoring. In their study, these authors separated 1-back errors (where participants pointed to the same design on successive sheets), from 2-back errors (where one other design was pointed to between pointing to the same design again), from forgetting errors (which included the rest of the errors which were not perseverative in nature and which the authors described as a form of monitoring or strategic memory error). They found that older adults had more 1-back and forgetting (strategic monitoring) errors than the younger adults. In addition, West et al. showed that older adults tended to make more errors towards the end of a trial, regardless of the set size for the trial (e.g., more errors were made on the 9th selection of the 10-item set size than on the 9th selection of the 12-item set size). The authors interpreted this result as a failure by older adults to accurately monitor progression through the trial, and suggested that the finding was consistent with the idea that a monitoring deficit may be contributing to older adults' errors on the SOPT.
Support for deficient strategy exploitation comes from the work of Daigneault and Braun (1993). These authors compared older and younger adults who reported using a strategy to complete the SOPT with those who did not report using a strategy. They found that in contrast to younger adults, who benefited from using a strategy, older adults' performance did not improve when they reported using a strategy, suggesting that strategy exploitation was impaired in their sample of older adults.
The current study used both cross-sectional and longitudinal methodologies to investigate working memory performances in older adults, as measured by an abstract design version of the SOPT (see Shimamura & Jurica, 1994). Our primary goal was to better understand the nature of working memory deficits associated with aging on the SOPT. In Experiment 1, age differences in inhibition (proactive interference), strategy use, processing speed, and monitoring were investigated within a single study by comparing the SOPT performances of a sample of 140 older and 140 younger adults. A subset of the older adults from Experiment 1 was then re-tested approximately four years later and compared to a new sample of younger adults. In Experiment 2, we replicated and extended key findings from Experiment 1. In the cross-sectional analyses, we also further investigated whether the older adults' difficulties on the SOPT were specific to generating internal sequences of responses. The goals of the longitudinal analyses were to examine whether nonverbal working memory performance would change over the course of 4 years and, if it did, to identify variables that might be associated with the decline. However, because only 53 older adults from the original sample were retested, the longitudinal analyses should be considered exploratory.
EXPERIMENT 1: CROSS-SECTIONAL ANALYSIS
The purpose of Experiment 1 was to determine whether difficulties with inhibitory control, strategy use, processing speed, and/or monitoring contribute to the working memory deficit observed in older adults.
Methods
Research participants
A sample of 140 older adults (M = 70.65, SD = 7.53, range = 57–93 years) and 140 younger adults (M = 20.58, SD = 2.12, range = 18–28 years) were participants in this study. The older adults were recruited through a mailing to alumni, faculty and staff of Washington State University, or through local volunteer and senior citizen organizations. The data were collected as part of a larger study of cognitive aging in which extensive neuropsychological testing was conducted. The older adults were provided with information about their cognitive performance in exchange for volunteering their time. They were also compensated for parking expenses. The younger adults were recruited through the Washington State University psychology participant pool and received course credit for their participation.
All participants were native speakers of English. They were individually interviewed in order to exclude those with a significant history of substance abuse, brain surgery, cerebrovascular or cardiovascular accident, brain damage sustained earlier from a known cause, severe psychiatric disorder, or serious health problems. Persons who had difficulty seeing the SOPT stimuli (i.e., a Snellen ratio of less than .50 at 40.6 cm) were excluded from the study. The older adults had, on average, completed more years of formal education (M = 16.86, SD = 2.63) than the younger adults [M = 14.40, SD = 1.27; t(280) = 9.98], and had a higher estimated full scale IQ [older: M = 117.93, SD = 11.60; younger: M = 105.79, SD = 10.67; t (272) = 8.99], as measured by a short form of the Wechsler Adult Intelligence Scale, Revised (WAIS–R, Wechsler, 1981; Vocabulary, Block Design, Similarities, and Arithmetic subtests, Sattler, 1988).
Materials and procedure
The following tests were administered as part of a larger battery of tests that took approximately 3 hr to complete.
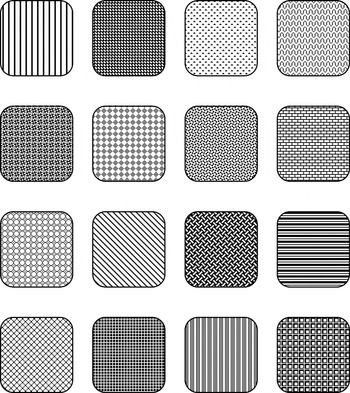
Self-ordered pointing task. An abstract designs form of the self-ordered pointing task was used as a measure of working memory (see Shimamura & Jurica, 1994). Participants were shown sheets of 22 × 28 cm paper with either 9 designs arranged in a 3 × 3 array or 16 designs arranged in a 4 × 4 array (see Figure 1). There were two different versions (A and B) of both the 9- and 16-item stimuli. The stimuli included in each version were similar in visual quality, that is, black-and-white computer-generated designs. A trial was defined as a series of sheets equal in number to the number of designs printed on the initial sheet (i.e., 9 sheets for 9 designs and 16 sheets for 16 designs). For each trial, the same designs appeared on each successive page but in a different spatial location. Participants were instructed to point to a design on the first sheet, turn the page and point to another design, and so on until all the designs had been pointed to without pointing to a given design more than once. Two trials were administered for each set size, for a total of four trials overall. Progression through the task was self-paced; however, the total time per administration was noted. The examiner recorded the design chosen on each sheet and provided no feedback to the participant. An error occurred each time a participant selected a pattern that had been chosen previously within a trial. Selecting the same location on successive sheets was discouraged if this appeared to be the strategy used (pointing to the same location on three or more sheets in a row), as this would increase performance without using working memory to complete the task. Participants were randomly assigned to one of eight conditions counterbalanced for set size and alternate versions. For example, for four of the eight conditions participants received two trials of set size nine followed by two trials of set size 16, and vice versa for participants in the other four conditions. Within a set size, participants either received Version A twice, Version B twice, A then B, or B then A. Thus half of the participants had the same stimuli on successive trials and half had different stimuli on successive trials within each set size.

Example sheet from the 16-item SOPT.
WAIS–R, Digit Symbol subtest. This task is a measure of visual motor processing speed (Wechsler, 1981). In this task, participants were presented with a key at the top of the page where each of a series of numbers (1–9) is paired with a different symbol. Their task was to copy the symbol that goes with each number in the space below the number, as quickly as possible. Participants were stopped after 90 s and the total number of correct responses was tabulated.
Results
The eight counterbalanced conditions were combined for all analyses, as there were no differences between task versions (A or B) or order of administration of set size (9 or 16) as a function of age group and set size.1
1In the full factorial model, the three-way interaction of age group, set size, and version (A or B) was not significant, F = .13. The three-way interaction of Age Group × Set Size × Order (nine first or 16 first) was also not significant, F = .07.
Total errors
Errors committed on the SOPT were submitted to a group (older adult vs. younger adult) by set size (9-item and 16-item) ANOVA with repeated measures on the last factor.2
2For all analyses, the univariate and multivariate results were similar; therefore, we only present the univariate results. In addition, since the older adults in our sample had significantly higher estimated full scale IQs than the younger adults, correlational analyses were conducted to evaluate whether SOPT performance was related to IQ. The correlation between total errors on the SOPT and estimated full scale IQ was significant for both the younger (r = −.31, p < .05) and older (r = −.35, p < .05) adults, indicating that individuals with higher IQs also tended to perform better on the SOPT. When IQ was included as a covariate in the analysis, the effect of age group only increased, indicating a greater opportunity to find group differences. Therefore, we chose not to covary for IQ in the remaining analyses.
Proactive interference
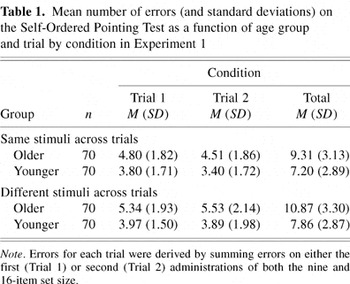
Previous research that has investigated the role of proactive interference in SOPT performance has examined performance across trials that use the same stimuli. Poorer performance on the second trial with the same set of stimuli has been used as evidence of proactive interference (Shimamura & Jurica, 1994). In this study, half of the participants received the same stimuli on successive trials within a set size (either AA or BB) and half received different stimuli (either AB or BA). We expected that the potential for proactive interference would be greater when the same stimuli were presented across trials because of the greater opportunity for difficulty distinguishing responses made during the first trial from those made during the second trial. Therefore, if proactive interference contributed to the older adults' higher error rate, we would expect errors for older adults who had the same stimuli across trials to increase on the second trial. To investigate this, errors committed on the SOPT were submitted to a group (older adult vs. younger adult) by condition (same stimuli: AA or BB vs. different stimuli: AB or BA) by trial (first vs. second) ANOVA with repeated measures on the last factor (see Table 1). The “first trial” was composed of the first trial administered for both the nine-item and 16-item set sizes, and the “second trial” by the second trial administered for each set size. This analysis revealed a significant main effect of group [F(1,276) = 49.38, MSE = 230.15], and condition [F(1,276) = 9.21, MSE = 42.90], but not trial (F = 1.41). The interaction of Group × Trial was also not significant (F < 1). No other interaction terms were significant (F < 2.55). Contrary to expectations based on a role for proactive interference in SOPT performance, the main effect of condition indicated that those who received the same stimuli across trials actually made fewer errors than those who received different stimuli. In addition, this effect was the same for the younger and older adults. Thus, this analysis revealed no evidence to suggest that the older adults' difficulties on the SOPT were due to proactive interference.3
3Shimamura and Jurica (1994) reported that older adults in their 60s suffered from proactive interference. Since the analysis we completed included older adults in their 70s and 80s and both similar and different stimuli on successive trials, we re-ran the analysis and compared the older adults in their 60s who had the same stimuli across trials (N = 27) to the younger adults (N = 70) who had the same stimuli across trials. Neither the main effect of trial, F = 2.73, MSE = 5.24, nor the interaction of Age × Trial (F = .02, MSE = .004) were significant. The mean error rate for the older adults in their 60s on the first and second trials was 4.33 (SD = 1.75) and 4.00 (SD = 1.59), respectively.
Mean number of errors (and standard deviations) on the Self-Ordered Pointing Test as a function of age group and trial by condition in Experiment 1

Strategy use
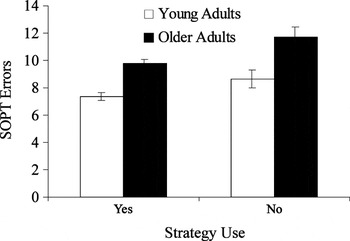
Another possible contributor to the older adults' poorer performance on the SOPT is a failure to develop an effective strategy. Based on participants' responses to a question asking how they went about completing the SOPT task, participants were classified as using a strategy (83.9%) if they reported grouping the designs in a specific manner and as not using a strategy (13.6%) if they reported guessing, pointing in a random fashion, or pointing by memory.4
4Percentages do not add up to 100% because of missing data.

Mean number of errors (with standard error bars) on the SOPT as a function of age group and strategy use in Experiment 1. Errors reflect the total number of errors across all trials.
Processing speed
The hypothesis that processing speed can account for the majority of the changes in working memory with age (Salthouse, 1994) was investigated using a series of hierarchical multiple regressions (see Salthouse, 1994 for a review of this approach). Correlations for the variables in the model were as follows: age and Digit Symbol = −.74, age and SOPT = .44, SOPT and Digit Symbol = −.42. First, when total SOPT errors were regressed on age alone, the resulting model yielded a multiple R of .442, thus accounting for 19.5% of the variance in SOPT performance, F = 66.82, p < .05. The addition of Digit Symbol performance significantly increased the proportion of explained variance to 21.5% (Fchange = 6.94, p < .05) and attenuated the beta weight for age (from .442–.286; Digit Symbol beta = −.210), although age still remained highly significant. Starting over, when SOPT errors were regressed on Digit Symbol performance alone, the resulting model yielded a multiple R of .422, accounting for 17.8% of the variance in SOPT performance (F = 59.71, p < .05). Adding a term for age significantly increased the proportion of explained variance by 3.7% (Fchange = 12.91, p < .05). These findings indicate that processing speed is related to performance on the SOPT. However, even after removing variance associated with processing speed, age effects on SOPT performance continued to explain a significant amount of the variance.
Monitoring
To examine the influence of monitoring difficulties on the older adults' SOPT performance, similar to the strategy used by West et al. (1998), we conducted an analysis involving error distance. Error distance refers to the number of sheets that are presented after a design is selected the first time until the design is selected a second time (the error occurs at this point). Unlike West and colleagues, however, we conceptualized error distance as a continuous rather than a dichotomous variable. More specifically, we did not categorize errors as 1-back, 2-back and forgetting (monitoring), but investigated the entire range of possible error distances as an indicator of monitoring ability. We were not convinced that forgetting (monitoring) and perseverative errors could be dichotomized as West et al. proposed, because shorter error distances could also result from poor monitoring. We believe it is possible that perseverative errors (1-back errors) could reflect a severe monitoring deficit, where the participant is unable to monitor even one design within working memory. Thus, for the purposes of the current study, error distance was used as a measure of monitoring ability on the assumption that increased proximity in errors (i.e., shorter error distances) reflects greater impairment in the self-monitoring aspects of executive control (see also Glosser & Goodglass, 1990).
The error distance analyses were conducted on the 9-item and 16-item set sizes separately. For each participant, we calculated the number of errors that fell within each of four errors distance groups for the nine-item set size (1–2, 3–4, 5–6, 7–8) and each of five error distance groups (1–3, 4–6, 7–9, 10–12, 13–15) for the 16-item set size. Due to the nature of the test, the opportunity for errors at shorter distances is much greater than it is for errors at longer distances. Therefore, to confidently interpret any group differences in the error distance data, we needed to determine whether the distribution of errors within each trial was similar for the older and younger adults. That is, was the baseline probability of committing an error when choosing the second item (no error is possible for the first item), third item, fourth item and so on similar across age groups. If one of the groups committed proportionately more errors on earlier items, then this would likewise decrease the probability of that group making errors at longer error distance ranges since the probability of committing an error at the varying error distance ranges is not independent of the accuracy of prior responses. For the nine-item set size, a Group (young and old) × Item (1st item through 9th item selected) ANOVA with repeated measures on the last factor revealed no significant interaction (F = 1.87), suggesting that the baseline distribution of errors within the nine-item trial was similar for the older and younger adults. The mean number of items selected before the first error occurred also did not differ between the younger adults (M = 6.75, SD = 1.86) and older adults (M = 6.95, SD = 1.72). For the 16-item set size, the ANOVA revealed a significant Group × Item interaction [F(15,4170) = 2.0, p < .05]. Using p < .01 to establish significance, post-hoc analyses revealed that the number of errors committed by the older adults was greater than that of the younger adults for the 13th item, 14th item, and 15th item chosen. In addition, the mean number of items selected before the first error was 8.49 (SD = 2.80) for the older adults and 9.88 (M = 2.98) for the younger adults [t(278) = −4.03, p < .05]. Because group differences in the probability of committing an error occurred only for later items when the opportunity existed to make an error at nearly any error distance range, we proceeded to interpret the raw data from the error distance analysis. We were interested in determining whether the older adults' performance differed from the younger adults' performance in the errors made at some distance ranges but not others (i.e., the interaction of Age × Error Distance).
In terms of the nine-item set size error distance analysis, the group (older adults vs. younger adults) by error distance (1–2, 3–4, 5–6, 7–8) ANOVA with repeated measures on the last factor revealed a significant main effect of error distance [F(1,278) = 304.18, MSE = 150.16]. As expected, due to the nature of the task, the number of errors increased as the error distance decreased for both groups. There was also a significant main effect of age group [F(1,278) = 24.19, MSE = 11.81]. More importantly, there was a significant Error Distance × Age Group interaction [F(1,278) = 16.72, MSE = 8.25]. Post-hoc analyses (corrected for multiple comparisons, p = .01) revealed that when compared to the younger adults (M = .86), the older adults (M = 1.35) made significantly more errors in the 1–2 error distance range [t(278) = 4.27]. No other comparisons reached significance, although the difference between the older (M = .99) and younger (M = .76) adults approached significance for the 3–4 error range (p = .04).
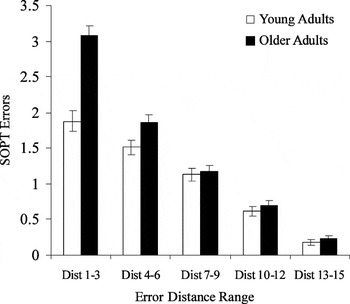
For the 16-item set size, the group (older adults vs. younger adults) by error distance (1–3, 4–6, 7–9, 10–12, 13–15) ANOVA also revealed that the number of errors increased as error distance decreased [F(1,278) = 554.19, MSE = 869.14; see Figure 3]. There was a significant main effect of age group [F(1,278) = 39.10, MSE = 41.49], and a significant Error Distance × Age Group interaction [F(1,278) = 28.86, MSE = 45.26]. Post-hoc analyses (corrected for multiple comparisons, p = .01) revealed that the older adults (M = 3.07) made significantly more errors in the 1–3 error distance range than the younger adults [M = 1.88; t(278) = 5.79]. No other comparisons were significant, although the difference between the older (M = 1.86) and younger (M = 1.51) adults approached significance for the 4–6 error distance range (p = .02). These findings suggest that, relative to the younger adults, when older adults committed errors on the SOPT they selected the same designs within a closer proximity for both the nine-item and 16-item set sizes.

Mean number of errors (with standard error bars) as a function of error distance range for Experiment 1. Errors are based on the number of errors made at each of five error distances summed across the two trials of the 16-item set size.
Experiment 1: Discussion
Consistent with previous studies that have used tasks other than the SOPT to assess working memory (e.g., reading span task; Fisk & Warr, 1996; Hultsch et al., 1998; Salthouse, 1994), we found that the older adults exhibited poorer working memory performance than the younger adults.5
5In order to rule out the possibility that the older adults' difficulties on the SOPT were due to deficits in visual pattern recognition or memory dysfunction, 35 older adults (M = 68.98 years old, SD = 7.10) and 35 younger adults (M = 20.29, SD = 1.49) completed two trials with a similar set of 16 stimuli. A recognition test for the 16 designs followed (16 target designs and 16 distracter designs). As expected, the older adults (M = 5.86, SD = 1.80) committed more errors on the SOPT than the younger adults [M = 4.86, SD = 2.03; t(68) = 2.18, p < .05]. In contrast, recognition testing revealed no differences between the older and younger adults in the proportion of hits [.87 and .89, respectively; t(68) = −.94], or the proportion of false alarms [.16 and .14, respectively; t(68) = .94]. These results indicate that age differences on the SOPT cannot be fully accounted for by differential visual pattern recognition or visual memory deficits.
Overall, these observations suggest that proactive interference and strategy exploitation appear to contribute little towards explaining age differences in errors on the SOPT. In contrast, both slower processing speed and difficulties in monitoring a series of designs in working memory appear important. The authors of the SOPT contend that this task measures the ability to monitor a self-generated sequence of responses (Petrides & Milner, 1982). In order to further examine the nature of the older adults' difficulty with this task, in the second wave of testing, participants completed an additional task (Externally-Ordered Pointing Task) designed to separate the internally ordered component of the SOPT from the ability to keep track of a sequence of responses in an externally ordered situation.
EXPERIMENT 2: CROSS-SECTIONAL AND LONGITUDINAL ANALYSES
The cross-sectional analyses in Experiment 2 were conducted in order to replicate the proactive interference, processing speed, and monitoring analyses of Experiment 1. Strategy use was not analyzed in Experiment 2 because nearly all of the older adults (52 out of 53) in this sample reported using a strategy at Time 2.6
6Forty-nine of the 53 returning older adults also reported using a strategy at Time 1.
Methods
Research participants
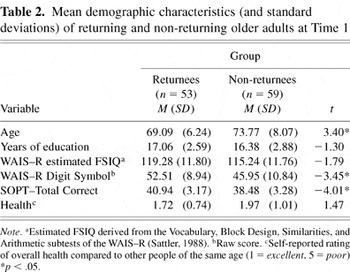
Fifty-three older adults (M = 73.41, SD = 6.31, range = 60–85 years) were retested in Experiment 2. Of the 140 older adults who participated in Experiment 1, 28 were excluded because they had been retested on the SOPT in a separate study (this study is described in Footnote 5). Thus, we attempted to contact 112 older adults and 53 (47.3%) were willing to participate. Of the 59 older adults who did not return for the second testing, 11.9% had died, 15.3% had moved out of the area, 32.2% were not interested, 13.6% were not able to be scheduled during the study duration, 25.4% were unable to be contacted (did not answer phone or could not be located), and 1.7% no longer met minimum study requirements (see Experiment 1). The demographic characteristics of those who returned for testing and those who did not return are presented in Table 2. The time between initial testing and the current assessment was approximately 4 years (M = 4.32, SD = .39, range = 3.51–4.90 years). The same exclusionary criteria used in Experiment 1 were used for the current study.
Mean demographic characteristics (and standard deviations) of returning and non-returning older adults at Time 1%*p < .05.

As can be seen in Table 2, the sample of older adults who were re-tested for the current study were on average younger than those who did not participate, and had better performances on both Digit Symbol and the Self-Ordered Pointing Test. There were no differences between those re-tested and those not re-tested in estimated full scale IQ, years of education, or self-report ratings of health at Time 1 (ts < 1.8).
A new sample of 53 younger adults (M = 20.14, SD = 1.80, range = 18–29 years) was also tested. The younger adults were recruited through the Washington State University psychology participant pool and received course credit for their participation. The older adult participants were provided with written information about their cognitive performance in exchange for volunteering their time. They were also compensated for parking expenses. The older adults had, on average, more years of formal education (M = 17.08, SD = 2.60) than the younger adults [M = 13.00, p < .01, SD = .83; t(104) = −10.86]. The older adults also had a higher estimated intelligence (M = 124.12, SD = 5.26), as measured by the Shipley Institute of Living Scale (Zachary, 1994), than the younger adults [M = 105.18, p < .01, SD = 10.70; t(102) = −11.52].
Materials and procedure
The following tests were part of a larger battery of tests that took approximately 2.5 to 3 hr to complete. The EOPT task was always administered following the SOPT task because participants were provided strategy information during the EOPT.
Self-ordered pointing task. The materials and procedure used for the SOPT in Experiment 2 were the same as those used in Experiment 1. The order of trial presentation for each older adult was identical to that given at Time 1. For the younger adults, the order of trial presentation was counterbalanced and assigned randomly based on when each participant entered the study.7
7Cell numbers were approximately equal, as 52 participants (27 younger adults and 25 older adults) received set size nine first and 54 participants (26 younger adults and 28 older adults) received set size 16 first. Fifty-seven participants (26 younger adults and 31 older adults) were administered the same stimuli across trials, while 49 participants (27 younger adults and 22 older adults) were administered different stimuli across trials.
Externally-ordered pointing task. This task was designed to further investigate the nature of the deficit observed in the older adults' performance on the SOPT. The EOPT involved two trials of 16 items. The “internal” trial (administered first) was very similar to the SOPT in that it assessed the ability to generate an internal sequence of responses. The “external” trial (administered second) assessed the ability to follow an externally determined sequence of responses given by the examiner. The 16 abstract designs used in this task were selected from among the stimuli used in the different conditions of the SOPT with the goal of having two or three designs that clearly fit into one of six grouping categories (e.g., horizontal lines, diagonal lines). On the internal EOPT trial, participants were instructed to use a grouping strategy to complete the trial. At the end of the internal trial, participants were asked to describe in detail the grouping strategy they used. The external trial required participants to point to specific groups of designs in an order specified by the experimenter (six groupings of two or three items). The groupings were first explained to the participants by displaying a card that showed which group each design belonged to. A card outlining the order of the groupings was then displayed during the entire trial. Specifically, this card instructed participants as follows: (1) Point to the THREE designs that have DIAGONAL GRIDS; (2) point to the THREE designs that have VERTICAL LINES; (3) point to the THREE designs that have DIAGONAL LINES; (4) point to the THREE designs that look like GRIDS; (5) point to the TWO designs that have CIRCLES in them; and (6) point to the TWO designs that have HORIZONTAL LINES. Thus, unlike the SOPT, the EOPT will allow us to compare performance on a trial where a strategy is generated and followed internally by participants with a trial where a grouping strategy is provided and followed externally by participants. The internal trial of the EOPT also differs from the SOPT in that participants are specifically told to devise and use a strategy.
WAIS–R, digit symbol subtest. This task was administered in the same manner described in Experiment 1.
Results
Analysis
The eight counterbalanced conditions were combined for the following analyses, as there were no differences between task versions (A or B) or order of administration of set size (9 or 16) as a function of age group and set size.8
8In the full factorial model, the three-way interaction of Age Group × Set Size × Version (A or B) was not significant (F = .58). The three-way interaction of Age Group × Set Size × Order (nine first or 16 first) was also not significant, F = 1.61.
Cross-sectional analysis
Self-ordered pointing task. The total number of errors committed on the SOPT was submitted to a group (older adults vs. younger adults) by set size (nine-item and 16-item) repeated measures ANOVA. Again, the number of errors at each set size was divided by the total number of sheets administered for each set size. Consistent with Experiment 1, the older adults (M = .17) committed a higher overall proportion of errors than the younger adults [M = .13; F(1,104) = 15.54, MSE = .12]. In addition, the percentage of errors was greater for the 16-item set size (M = .17) compared to the nine-item set size [M = .13; F(1,104) = 29.23, MSE = .07], and this effect was the same for both the older and the younger adults (F = 2.60).
Also consistent with Experiment 1, there was no evidence to support the hypothesis that proactive interference accounted for the age-differences found in SOPT performance. That is, there was no evidence to suggest that participants who received the same set of stimuli across trials performed more poorly on Trial 2 than those who received different stimuli across trials. A Group (older vs. younger adults) × Condition (same stimuli vs. different stimuli) × Trial (1st vs. 2nd) repeated measures ANOVA with total errors as the dependent variable revealed a significant main effect of group [F(1,102) = 17.85, MSE = 82.17], but not condition (F = .29), or trial (F = .30). Furthermore, none of the interactions were significant, Fs < 1.19.
Hierarchical multiple regression analyses were again used to evaluate the influence of processing speed on SOPT performance. Correlations for the variables in the model were as follows: age and Digit Symbol = −.67, age and SOPT = .43, SOPT and Digit Symbol = −.34. When total SOPT errors were regressed on age alone, the resulting model yielded a multiple R of .430, thus accounting for 18.5% of the variance in SOPT performance (F = 23.34, p < .05). Although the beta weight for age was attenuated upon adding Digit Symbol (from .430–.363), Digit Symbol performance failed to significantly increase the proportion of explained variance (beta = −.099, F < 1, Fchange = .68). Starting over without a term for age, when SOPT errors were regressed on Digit Symbol performance, the resulting model yielded a multiple R of .343, accounting for 11.8% of the variance in SOPT performance (F = 13.76, p < .05). Adding a term for age significantly increased the proportion of explained variance by 7.2% (Fchange = 9.11, p < .05), indicating that age effects on SOPT performance continued to explain a significant amount of the variance even after removing variance associated with processing speed. Additionally, when age was entered in the model first, Digit Symbol was no longer a significant predictor of SOPT performance. These results provide further evidence that age effects contribute unique variance to working memory performance above and beyond the contribution of processing speed.
Before analyzing the error distance data, we again confirmed that the baseline distribution of errors within each trial was similar for the older and younger adults. Group × Item ANOVAs with repeated measures on the last factor revealed no significant interaction for either the nine-item or the 16-item set size (Fs < 1.2). The age groups also did not differ significantly in the mean number of items selected before the first error for both the nine-item (older adults: M = 6.69, SD = 1.65; younger adults: M = 6.61, SD = 1.58) and the 16-item (older adults: M = 9.20, SD = 2.86; younger adults: M = 10.2, SD = 3.24) set sizes, ts < 1.8.
The error distance analyses revealed a pattern of findings similar to Experiment 1 only on the 16-item set size. On the nine-item set size, errors at each of the four error distance ranges (1–2, 3–4, 5–6, 7–8) were submitted to a 2 (age group) × 4 (error distance) repeated measures ANOVA. The main effect of error distance was significant [F(1,104) = 141.22, p < .05, MSE = 63.19], as was the main effect of age group [F(1,104) = 6.10, p < .05, MSE = 2.73]. The interaction of Error Distance × Age Group, however, was not significant [F(1,104) = 3.31, MSE = 1.48, p = .07], indicating that on the nine-item set size, the younger and older adults made a similar number of errors at each of the error distances. Although not significantly different, the means for the younger and older adults were in the correct direction with older adults having more errors relative to the younger adults at the 1–2 and 3–4 error distance ranges (older adults: M = 1.15 and 1.11; younger adults: M = .89 and .75, respectively).
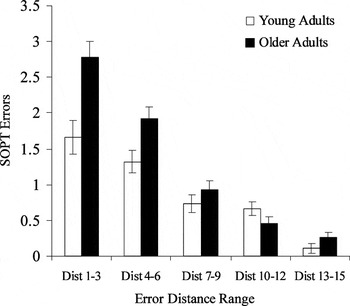
On the 16-item set size, errors at each of the five error distance ranges (1–3, 4–6, 7–9, 10–12, 13–15) were submitted to a 2 (age group) × 5 (error distance) repeated measures ANOVA (see Figure 4). The main effect of error distance was significant [F(1,104) = 204.15, MSE = 278.16], as was the main effect of age group [F(1,104) = 20.00, p < .05, MSE = 18.12]. In addition, the interaction of error distance and age group was significant [F(1,104) = 14.56, p < .05, MSE = 19.84]. Post-hoc analyses (corrected for multiple comparisons, p = .01) revealed that compared to the younger adults, the older adults committed significantly more errors in the 1–3 error distance range [t(104) = 3.39], and in the 4–6 error distance range [t(104) = 2.61]. The older adults made the same number of errors as the younger adults at the other distance ranges (see Figure 4).

Mean number of errors (with standard error bars) as a function of error distance range for Experiment 2: Cross-sectional Analyses. Errors are based on the number of errors made at each of five error distances summed across the two trials of the 16-item set size.
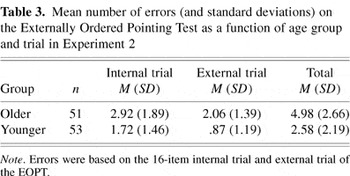
Externally-ordered pointing task (seeTable 3). Because the EOPT data were skewed, we examined the EOPT data using non-parametric statistics. We were most interested in whether the performance of the older adults would improve to the level of the younger adults when given an external sequence to follow. The Wilcoxon Signed Ranks Test revealed that fewer errors occurred on the external trial compared to the internal trial for the younger adults (M = .87 vs. 1.72; z = −3.65, p < .001), as well as the older adults (M = 2.92 vs. 2.06; z = −2.58, p < .01). However, the older adults committed more errors than the younger adults on the internal trial (M = 2.92 vs. 1.72; Kolmogorov-Smirnov Z = 1.72, p < .005), as well as the external trial (M = 2.06 vs. .87; Kolmogorov-Smirnov Z = 2.08, p < .001) of the EOPT. These findings indicate that even though both groups improved their performance when given an external sequence to follow, the older adults continued to perform more poorly than the younger adults.
Mean number of errors (and standard deviations) on the Externally Ordered Pointing Test as a function of age group and trial in Experiment 2

Adherence to the external sequence was analyzed to further clarify the nature of the older adults' relative difficulty with the external trial of the EOPT. It is noteworthy that nearly half of the younger adults made no adherence errors on the external trial of the EOPT, while only 13% of the older adults had no adherence errors. Errors in following the external plan (adherence errors) were classified as perseverations (pointing to the same design more than once within a category), intrusions (pointing to a design from an incorrect category), sequence errors (pointing to an entire category out of sequence), or number errors (pointing to too few or too many designs within a category). Because of the low number of adherence errors in the younger adult group, the error type analysis was only conducted for the older adults. Additionally, p values were Bonferroni adjusted to .01, in order to control for Type 1 error due to multiple comparisons. The analyses revealed that the older adults made more perseverative adherence errors (M = 1.28, SD = .91) than any other type of error [intrusion: M = .57, SD = .75, t(45) = 4.31; sequence: M = .28, SD = .58, t(45) = 5.97; number: M = .20, SD = .50, t(45) = 6.51]. None of the other error types differed significantly from each other.
Longitudinal analyses
In order to determine if working memory performance declined over time in the longitudinal sample, a paired sample t test was conducted on the overall SOPT error score. There was no mean difference between Time 1 and Time 2 performance in overall errors on the SOPT (Time 1, M = 9.07, SD = 3.19; Time 2, M = 9.06, SD = 3.11). Digit Symbol performance also failed to show a statistically significant decline between Time 1 (M = 52.51, SD = 8.94) and Time 2 (M = 52.36, SD = 10.76) in this sample. The correlation between Time 1 Digit Symbol and Time 2 Digit Symbol was also too high (r = .86) to explore the relationship between individual change in processing speed performance and SOPT performance over time.9
9When Time 2 SOPT errors were regressed on Time 1 SOPT errors, Time 1 Digit Symbol, and Time 2 Digit Symbol, Time 2 Digit Symbol was excluded from the analysis due to low tolerance (.265) indicating collinearity among the variables in the model. As an alternative analysis, Time 1 Digit symbol alone was investigated as a predictor of SOPT change. Time 1 Digit Symbol performance failed to significantly predict change in SOPT performance, Fchange = .56.
We began by examining the correlation between age and SOPT performance at Time 1 and at Time 2. We found that for the 53 older adults involved in this longitudinal analysis, age was not significantly correlated with overall errors on the SOPT at Time 1 (r = .23); however, age was significantly correlated with total errors at Time 2 (r = .45). Thus, it appears that SOPT performance was more related to age when this sample was older. We then used regression analysis to further explore whether age effects would continue to account for variance in Time 2 SOPT performance after the variance associated with Time 1 SOPT performance, and other demographic variables that might be related to individual differences in working memory (i.e., years of education and estimated full scale IQ), were removed. When total SOPT errors at Time 2 were regressed on Time 1 SOPT errors, the resulting model yielded a multiple R of .40, accounting for 16.3% of the variance in SOPT performance. Adding education and IQ significantly increased the proportion of explained variance by 14.2% (Fchange = 4.99, p < .05). Lastly, adding age effects further increased the proportion of explained variance by 17.9% (Fchange = 16.60, p < .05). Age and IQ were the only variables in the final model that explained unique variance in Time 2 SOPT errors (beta weights for final model; age = .44, IQ = −.37, education = −.15, SOPT Time 1 = .18). Thus, older age and lower intellectual abilities tended to be associated with poorer SOPT performance at Time 2.
EXPERIMENT 2: DISCUSSION TO MATCH EXPERIMENT 1
Consistent with Experiment 1, the older adults made more errors overall on the SOPT than the younger adults. Again, proactive interference was not related to SOPT performance, and age was found to be a significant predictor of SOPT performance when processing speed was controlled for. The monitoring analysis (error distance) also revealed that, in comparison to the younger adults, the older adults selected the same design twice within a closer proximity (i.e., the 1–3 and 4–6 error distance ranges).
In terms of EOPT performance, the older adults were able to benefit from an external plan; however, they still had relative difficulty with this plan compared to the younger adults. These results could suggest that the older adults' difficulty with the SOPT involves both internal and external monitoring. Closer inspection of the external trial suggests, however, that some internal monitoring was required to keep track of the two or three designs within a category. This was reflected most in the perseveration adherence errors, as this type of error occurred when the participant pointed to the same design within a category. The other three types of adherence errors (number, sequence, and intrusion), which occurred much less frequently than perseveration errors, primarily reflect a problem following the external plan, as the information needed to prevent these types of adherence errors was on the card given to the participant. Therefore, the older adults' working memory deficits on the SOPT appear to be more related to difficulties with internal monitoring, than with sequencing abilities in general. In addition, the EOPT findings were similar to the findings from the strategy use analysis in Experiment 1, in that the older adults benefited from using an external plan but were still performing poorer on the EOPT than the younger adults. It may be that in Experiment 1 the older adults had difficulty monitoring the designs within the structure of their strategy, similar to how they performed on the external EOPT trial.
The exploratory longitudinal analysis revealed that age was more highly correlated with SOPT performance at Time 2. This suggests that as older adults become older, age may become more important for determining SOPT performance. It is important to note, however, that the sample of older adults with data at both Time 1 and Time 2 was significantly different than the entire sample assessed at Time 1. Thus, the finding that age was more highly correlated with SOPT performance at Time 2 than at Time 1 may not have held up if the entire original sample had been retested at Time 2. The regression analyses also revealed that age and IQ were significant predictors of Time 2 SOPT performance, suggesting that older age and lower intelligence were associated with poorer working memory performance in our longitudinal sample. Therefore, had an older group of participants returned for the second testing, we might have observed average decline on the SOPT in our sample. Given that the time between testing was four years, it is unlikely that our failure to observe average change on the SOPT and Digit Symbol reflects contamination by practice effects. Additionally, given the moderate correlation between Time 1 and Time 2 SOPT performance, relatively low reliability in this measure may have deflated the correlations between the SOPT and the other variables.
GENERAL DISCUSSION
The purpose of the current research was to better understand those factors that may contribute to the working memory deficit observed in older adults. Several constructs that attempt to explain older adults' working memory deficit, including inhibition, processing speed, strategy exploitation, and monitoring, were investigated within the context of one working memory measure (SOPT). Longitudinal analyses were also conducted to determine if nonverbal working memory performance changed over time in our sample and, if so, what variables were associated with that change.
Inhibition
Overall, an inhibition hypothesis was not well supported by the data. First, consistent with some previous research (West et al., 1998), across repeated trials, we found no evidence of proactive interference, a type of inhibitory failure. Although proactive interference did not appear to limit the older adults' performance across two trials of our SOPT, it is possible that with additional trials or alternate stimuli evidence for proactive interference would have been elicited. Other research indicating that proactive interference may be a mediator of age-related differences in working memory performance has typically involved semantically related words and examined the build-up of interference over several trials (Lustig et al., 2001; May et al., 1999). It should be noted, however, that using a similar two-trial administration of an abstract design version of the SOPT (the one this study was modeled after), Shimamura and Jurica (1994) found evidence for proactive interference in their sample of older adults in their 60s. Additionally, although not directly tested in this study, inhibition problems within a trial are unlikely to account for the older adults' poorer performance. More specifically, Hasher and Zacks (1988) postulated that older adults maintain irrelevant information in working memory, which overloads the system. Unlike for other tests (e.g., negative priming tasks; Hasher et al., 1991), better performance on the SOPT is obtained if items are maintained in working memory, rather than if previously pointed to items are discarded. Thus, although inhibition does not appear to explain age-related deficits on the current version of the SOPT, inhibition deficits may be an important limiting factor for older adults on other working memory tasks (e.g., WCST, Trail Making Test; Arbuckle & Gold, 1993) and for other populations with working memory deficits (e.g., schizophrenia; see Golden, 1978).
Strategy Exploitation
The strategy exploitation theory (Daigneault & Braun, 1993) was not supported by the current results, as the older adults in this study who used strategies to complete the SOPT benefited to the same extent as the younger adults. Age-differences remained; however, even though the older adults' performance improved with the use of a self-generated strategy. Overall, however, there were relatively few participants (both older and younger adults) who did not use a strategy. Age differences were also observed on both the internal and external trials of the EOPT, even though the older adults' performance improved with the use of an external strategy. This may suggest some additional age-related difficulties in the ability to follow an externally imposed pointing strategy. Closer analysis of the EOPT external trial revealed, however, that internal monitoring was also involved in this task. More specifically, the older adults were most likely to make perseverative adherence errors within a category when following the external sequence, than sequence, number, or intrusion adherence errors. These findings suggest that the older adults may have experienced some difficulty monitoring which of the two or three designs within a pattern grouping they had previously selected.
Processing Speed
There was evidence to suggest that processing speed accounts for a portion of the age differences in SOPT performance. However, in both cross-sectional processing speed analyses, age remained a significant predictor of SOPT performance when processing speed was accounted for in the model. Our results indicate that variables other than processing speed are also important in explaining age differences in working memory. One important difference between the current study and the work of Salthouse and colleagues is our use of the SOPT as the measure of working memory rather than the reading span and computation span tasks (Salthouse, 1994; Salthouse & Meinz, 1995). These span tasks involve somewhat different processes than the SOPT, including reading and arithmetic skills. In addition, reading speed and computational speed may be important factors in performance on these span tasks. Thus, differences in processing speed may determine working memory performance more highly on these span tasks than on the SOPT. It is also possible that the Digit Symbol test, like other speeded coding measures, may be contaminated by working memory (Piccinin & Rabbitt, 1999).
Monitoring
With respect to the SOPT, monitoring refers to the ability to keep track of designs already selected and those that have not been selected. As one progresses through the test, a greater number of designs must be monitored and avoided. Whenever a selection is being contemplated, the participant must compare the new selection to all previously selected designs and determine if it is a new design or an old design. In the current study, error distance was used as a measure of monitoring ability on the assumption that increased proximity in errors (i.e., a shorter error distance) reflects greater impairment in the self-monitoring aspects of executive control (see also Glosser & Goodglass, 1990). In both experiments, relative to younger adults, we found that older adults made significantly more errors at shorter error distances, while they had a comparable amount of errors in the longer error distance ranges. For the most part, however, the groups did not differ in the mean number of items selected before the first error was committed. This suggests that once a breakdown in performance occurred the older adults experienced greater difficulty than the younger adults monitoring the items within working memory. Difficulties in monitoring may have appeared towards the end of the trials because the older adults were no longer able to use a strategy to guide their performance.
In addition to a deficient self-monitoring explanation, an increased tendency towards perseverations by older adults could also account for the above findings. Concerning perseverations, West et al. (1998) found that older adults tended to make more errors of a perseverative nature (pointing to a design twice in a row, similar to a perseverative error on the WCST) than younger adults on the SOPT. Although the older adults in the current study made relatively more errors at shorter distances than the younger adults, they did not make a higher percentage of perseverative 1-back errors (older adults: M = .17, SD = .13; younger adults: M = .14, SD = .13). Given that we conceptualized monitoring as being on a continuum, which includes perseveration at one extreme (failure to monitor one design), it appears that the older adults' monitoring deficit is a more subtle deficit in that they typically do not make a greater proportion of 1-back errors.
Longitudinal Data
The longitudinal analyses, although exploratory, provided some interesting hypotheses for future research. First, there was no average change in SOPT performance, indicating that decline on this task was not universal, as some participants improved during this time period. This was not due to low sensitivity to age changes in the SOPT because the Digit Symbol subtest, a highly sensitive test of speeded processing, also failed to show average decline across the approximate 4-year period. Second, age was more highly related to SOPT performance when the sample was older, suggesting that age may become more important for determining working memory performance as older adults get older. We also found that after accounting for Time 1 SOPT performance and education, older age and lower intellectual abilities tended to be associated with poorer performance on the SOPT at Time 2. Thus, we may have failed to detect working memory decline in our sample due to the selective attrition of our oldest participants. In addition, the high education and intelligence of this sample may have further limited our ability to detect average decline. Therefore, our results may not generalize to older adults of lower education and intellectual level. Our results are, however, consistent with many longitudinal studies of aging that report very little change in cognitive functioning until the later decades (Mitrushina & Satz, 1991; Schaie, 1994).
Conclusion
In this study, we used cross-sectional and longitudinal methodologies to investigate specific abilities that have been hypothesized to contribute to age-related working memory deficits. Within the context of our sample of highly educated and intelligent older adults, the findings suggest that older adults' compromised SOPT performance is not due to impairment in strategy exploitation or proactive interference. Although processing speed was an important factor in working memory performance, it did not account for all of the age-related variance. That is, the older adults also appeared to have relative difficulty monitoring the designs within working memory. Overall, our results suggest that the older adults' difficulties on the SOPT appear to be partially due to a related ability (processing speed) that influences the amount of information available to working memory, and partially due to difficulties in the self-monitoring aspects of executive control. Returning to the cooking example given at the outset, if the older adults' working memory difficulties result from internal monitoring and processing speed problems, older adults should exhibit the most difficulty keeping track of what steps in the recipe have been completed and which still remain, and completing these steps in a timely manner.
ACKNOWLEDGMENTS
This project was completed in partial fulfillment of Naomi Chaytor's master's degree in psychology at Washington State University. We thank Paul Whitney and John Hinson for their help and insightful comments. We gratefully acknowledge the contributions of the Cognitive Aging Research Laboratory for their help in collecting and scoring data. Heather Nissley is also recognized for her assistance with coordinating data collection.
References
REFERENCES
Arbuckle, T. &
Gold, D.
(1993).
Aging, inhibition, and verbosity.
Journal of Gerontology,
48,
225–232.CrossRefGoogle Scholar
Baddeley, A.D. &
Hitch, G.J.
(1974).
Working memory. In
G. Bower (Ed.),
The psychology of learning and motivation
(Vol. 8, pp.
47–90).
San Diego, CA:
Academic Press.
Craik, F.I.M.
(1977).
Age differences in human memory. In
F.I.M. Craik &
S. Trehub (Eds.),
Aging and cognitive processes (pp.
191–211).
New York:
Plenum.
Daigneault, S. &
Braun, C.M.
(1993).
Working memory and the self-ordered pointing task: Further evidence
of early prefrontal decline in normal aging.
Journal of Clinical and Experimental Neuropsychology,
15,
881–895.CrossRefGoogle Scholar
Fisk, J. &
Warr, P.
(1996).
Age and working memory: The role of perceptual speed, the central
executive, and the phonological loop.
Psychology and Aging,
11,
316–323.CrossRefGoogle Scholar
Glosser, G. &
Goodglass, H.
(1990).
Disorders in executive control functions among aphasic and other
brain-damaged patients.
Journal of Clinical and Experimental Neuropsychology,
12,
485–501.CrossRefGoogle Scholar
Golden, C.
(1978).
Stroop Color and Word Test: A manual for clinical and experimental
uses.
Los Angeles, CA:
Western Psychological Services.
Hasher, L.,
Stoltzfus, E.,
Zacks, R., &
Rypma, B.
(1991).
Age and inhibition.
Journal of Experimental Psychology: Learning, Memory, and
Cognition,
17,
163–169.CrossRefGoogle Scholar
Hasher, L. &
Zacks, R.
(1988).
Working memory, comprehension, and aging: A review and a new
view. In
G.H. Bower (Ed.),
The psychology of learning and motivation
(Vol. 22, pp.
193–225).
San Diego, CA:
Academic Press.
Hultsch, D.,
Hertzog, C.,
Dixon, R., &
Small, B.
(1998).
Memory change in the aged.
Cambridge, UK:
Cambridge University Press.
Hultsch, D.,
Hertzog, C.,
Small, B.,
McDonald-Miszczak, L., &
Dixon, R.
(1992).
Short-term longitudinal change in cognitive performance in later
life.
Psychology and Aging,
7,
571–584.CrossRefGoogle Scholar
Lustig, C.,
May, C., &
Hasher, L.
(2001).
Working memory span and the role of proactive interference.
Journal of Experimental Psychology: General,
130,
199–207.CrossRefGoogle Scholar
Martin, A.J.,
Friston, K.J.,
Colebatch, J.G., &
Frackowiak, R.S.
(1991).
Decreases in regional cerebral blood flow with normal aging.
Journal of Cerebral Blood Flow and Metabolism,
11,
684–689.CrossRefGoogle Scholar
May, C.P.,
Hasher, L., &
Kane, M.J.
(1999).
The role of interference in memory span.
Memory and Cognition,
27,
759–767.CrossRefGoogle Scholar
Miller, E. &
Cohen, J.
(2001).
An integrative theory of prefrontal cortex function.
Annual Reviews of Neuroscience,
24,
167–202.CrossRefGoogle Scholar
Mitrushina, M. &
Satz, P.
(1991).
Changes in cognitive functioning associated with normal aging.
Archives of Clinical Neuropsychology,
6,
49–60.CrossRefGoogle Scholar
Miyake, A. &
Shah, P. (Eds.).
(1999).
Models of working memory: Mechanisms of active maintenance and
executive control.
New York:
Cambridge University Press.CrossRef
Petrides, M.
(1995).
Impairments on nonspatial self-ordered and externally ordered
working memory tasks after lesions of the mid-dorsal part of the
lateral frontal cortex in the monkey.
Journal of Neuroscience,
15,
359–375.CrossRefGoogle Scholar
Petrides, M.
(1996).
Functional organization of the human frontal cortex for mnemonic
processing: Evidence from neuroimaging studies.
Annals of the New York Academy of Sciences,
769,
85–96.Google Scholar
Petrides, M.,
Alvisatos, B.,
Evans, A., &
Meyer, E.
(1993).
Dissociation of human mid-dorsolateral from posterior dorsolateral
frontal cortex in memory processing.
Proceedings of the National Academy of Science USA,
90,
873–877.CrossRefGoogle Scholar
Petrides, M. &
Milner, B.
(1982).
Deficits on subject-ordered tasks after frontal- and temporal-lobe
lesions in man.
Neuropsychologia,
20,
249–262.CrossRefGoogle Scholar
Piccinin, A.M. &
Rabbitt, P.M.A.
(1999).
Contribution of cognitive abilities to performance and improvement
on a substitution coding task.
Psychology and Aging,
14,
539–551.CrossRefGoogle Scholar
Raz, N.
(2000).
Aging of the brain and its impact on cognitive performance:
Integration of structural and functional findings. In
F. Craik &
T. Salthouse (Eds.),
Handbook of aging and cognition
(2nd ed., pp.
1–90).
Mahwah, NJ:
Lawrence Erlbaum Associates.
Salthouse, T.
(1994).
The aging of working memory.
Neuropsychology,
8,
535–543.CrossRefGoogle Scholar
Salthouse, T. &
Meinz, E.J.
(1995).
Aging, inhibition, working memory, and speed.
Journal of Gerontology,
50B,
297–306.CrossRefGoogle Scholar
Sattler, J.M.
(1988).
Assessment of children
(3rd ed.).
San Diego, CA:
Jerome M. Sattler, Publisher.
Schaie, W.
(1994).
The course of adult intellectual development.
American Psychologist,
49,
304–313.CrossRefGoogle Scholar
Shimamura, A. &
Jurica, P.
(1994).
Memory interference effects and aging: Findings from a test of
frontal lobe function.
Neuropsychology,
8,
408–412.CrossRefGoogle Scholar
Smith, A.D.
(1996).
Memory. In
J.E. Birren &
K.W. Schaie (Eds.),
Handbook of the psychology of aging
(4th ed., pp.
236–250).
San Diego, CA:
Academic Press.
Smith, E. &
Jonides, J.
(1997).
Working memory: A view from neuroimaging.
Cognitive Psychology,
33,
5–42.CrossRefGoogle Scholar
Wechsler, D.
(1981).
Manual for the Wechsler Adult Intelligence Scale–Revised.
San Antonio, TX:
The Psychological Corporation.
West, R.,
Ergis, A.,
Winocur, G., &
Saint-Cyr, J.
(1998).
The contribution of impaired working memory monitoring to
performance of the self-ordered pointing task in normal aging and
Parkinson's disease.
Neuropsychology,
12,
546–554.CrossRefGoogle Scholar
West, R.L.
(1996).
An application of prefrontal cortex function theory to cognitive
aging.
Psychological Bulletin,
120,
272–292.CrossRefGoogle Scholar
Wiegersma, S.,
Van Der Scheer, E., &
Hijman, R.
(1990).
Subjective ordering, short-term memory, and the frontal lobes.
Neuropsychologia,
28,
95–98.CrossRefGoogle Scholar
Wilson, R.S.,
Bennett, D.A., &
Swartzendruber, A.
(1997).
Age-related change in cognitive function. In
P.D. Nussbaum (Ed.),
Handbook of neuropsychology and aging.
New York:
Plenum Press.
Zachary, R.A.
(1994).
Shipley Institute of Living Scale–Revised manual.
Los Angeles, CA:
Western Psychological Services.
Example sheet from the 16-item SOPT.
Mean number of errors (and standard deviations) on the Self-Ordered Pointing Test as a function of age group and trial by condition in Experiment 1
Mean number of errors (with standard error bars) on the SOPT as a function of age group and strategy use in Experiment 1. Errors reflect the total number of errors across all trials.
Mean number of errors (with standard error bars) as a function of error distance range for Experiment 1. Errors are based on the number of errors made at each of five error distances summed across the two trials of the 16-item set size.
Mean demographic characteristics (and standard deviations) of returning and non-returning older adults at Time 1%*p < .05.
Mean number of errors (with standard error bars) as a function of error distance range for Experiment 2: Cross-sectional Analyses. Errors are based on the number of errors made at each of five error distances summed across the two trials of the 16-item set size.
Mean number of errors (and standard deviations) on the Externally Ordered Pointing Test as a function of age group and trial in Experiment 2
 You have
Access
- 24
- Cited by