Political actors, from national governments to social movement leaders, often work to co-ordinate costly individual behaviors. Yet, many costly behaviors only provide individualized benefits after participation becomes widespread. For example, civil rights leaders mobilized citizens to engage in individually risky protests, even as the efficacy of these protests depended on the number of individuals who participated.Footnote 1 Alternatively, many national governments have enacted unilateral climate reforms even as the climatic impacts of these costly reforms depend on the joint efforts of all countries.Footnote 2
When political action entails individual costs but group-contingent benefits, participation may require individuals to perceive themselves as members of a ‘community of fate’: a group of voters or political elites who share a common understanding of a political challenge and a shared commitment to forging a solution.Footnote 3 The importance of such a community has been conceptualized within a variety of theoretical frameworks. From one perspective, we can view membership in a community of fate as a form of common knowledge about game structure that facilitates behavioral co-ordination.Footnote 4 Alternatively, we can view group-contingent beliefs and behaviors as the direct result of social conditioning or sanctioning.Footnote 5 In each case, costly individual political behaviors linked to group-contingent benefits may depend on individual perceptions of others’ beliefs. In this sense, the establishment of political communities of fate across a range of contemporary political issues may depend not only on first-order personal beliefs, the overarching focus of political behavior and public opinion studies to date, but also on second order-beliefs, individuals’ perceptions of others’ beliefs.
The degree to which individuals are able to accurately estimate the distribution of others’ beliefs – and the behavioral consequences of these estimates – are ultimately empirical questions. However, detailed empirical attention to second-order beliefs – beliefs that individuals have about the beliefs of others – remains rare within political science.Footnote 6 We still know very little about the ways in which different political actors – both mass publics and elites – understand the communities of fate that structure important political conflicts. What are the empirical patterns that describe second-order beliefs across a range of different issue domains? Does the distribution of second-order beliefs vary across countries for specific issue domains? How do the public’s second-order beliefs about their own country compare to their beliefs about relevant foreign populations? Do elites and mass publics have different second-order beliefs? Do efforts to shape second-order beliefs shape individual support for costly political behaviors?
Among the substantive issues for which we lack a detailed empirical understanding of second-order beliefs, the issue of climate change stands out. Any effective effort to mitigate the risks of dangerous human-caused climate change will require both co-ordination within countries to generate political support for national policy enactment, as well as reform co-ordination between countries to ensure the collective efficacy of national climate mitigation efforts. Both types of political co-ordination will entail individually costly behaviors whose benefits are group-contingent. Further, domestic and international climate politics have already been characterized by intense ideational conflict, including explicit efforts by both advocates and opponents to shape individual understanding of the climate threat and the distribution of group climate beliefs. For example, climate policy opponents have invested enormous efforts in distorting public beliefs about the percentage of climate scientists who believe in human-caused climate change.Footnote 7 A priori, we thus have good reason to suspect that second-order beliefs structure climate-related political behaviors.
Yet, the potential importance of second-order beliefs to climate policy making has received minimal attention. To explain the gap between the urgent need for climate policy and the limited political supply of climate policies, scholars have instead pointed to such diverse factors as the absence of global institutions to co-ordinate climate policy action,Footnote 8 the role of powerful business opponents,Footnote 9 weak issue salienceFootnote 10 and domestic distributive conflict.Footnote 11 Many scholars also draw attention to the uneven distribution of climate and energy opinions as a serious constraint on efforts to enact climate reforms.Footnote 12 Recognizing the potential importance of individual beliefs to climate policy action, a related literature has subsequently explored the determinants of individual climate and energy beliefs.Footnote 13 By contrast, the issue of second-order beliefs has largely been ignored.Footnote 14
In this article, we examine the distribution and content of second-order beliefs in the domain of climate change, heeding a call by prominent scholars who have urged for more political science research on the climate issue.Footnote 15 Rather than studying the propensity to freeride or co-operate (if others co-operate)Footnote 16 or responses to cost and institutional design issues,Footnote 17 we focus on beliefs. Specifically, our argument builds from six new opinion surveys to offer the first empirical examination of second-order climate beliefs in the United States and China, the world’s two most important carbon-polluting countries. Breaking from previous work that investigates second-order beliefs only amongst mass publics, we study the distribution of second-order climate beliefs across a full range of relevant political actors – including mass publics in China and the United States as well as political and intellectual elites in the United States. We show consistent egocentric bias within the second-order beliefs of each class of political actors. These biases apply broadly, to second-order beliefs about climate science, support for diverse climate policies and with respect to the likelihood of compliance with the November 2014 US–China climate agreement. Notwithstanding individual opinions, most actors also underestimate pro-climate beliefs and support for pro-climate policies within target populations. Examining for the first time the content of second-order beliefs at a population level, we also find that individuals mostly share an understanding of why other individuals hold divergent views on climate change, despite their biased estimates of these viewpoints’ distribution within a given target population. Finally, we demonstrate experimentally that second-order beliefs shape willingness to engage in climate co-ordination; after respondents update their second-order beliefs to reduce bias, we see increased support for climate policy action. Together our results suggest that the extant distribution of second-order climate beliefs reinforces weak political incentives to engage in ambitious climate policy reforms. We conclude that scholars should focus more closely on second-order beliefs as a key factor in shaping climate policy inaction. Scholars should also pay attention to second-order beliefs more generally when political behaviors in any issue domain entail individual costs but group-contingent benefits.
THE IMPORTANCE OF SECOND-ORDER BELIEFS
Despite intensifying risks, global greenhouse gas concentrations continue to grow, unabated, to levels that scientists believe will trigger dangerous anthropogenic climate change.Footnote 18 This inaction persists even as climate impacts begin to realize, including across advanced economies.Footnote 19 Yet, political co-ordination around climate change remains stunted at both domestic and global levels, an outcome that has been linked, in part, to the uneven distribution of climate and energy opinions.Footnote 20 Efforts to link policy inaction to the distribution of public preferences echo a diverse literature documenting the ways in which public policy making is responsive to mass public opinion.Footnote 21
Public climate and energy opinions are highly variable, both across countriesFootnote 22 and within countries.Footnote 23 At the same time, public concern about climate change remains consistently lower than concern among climate scientists and policy experts.Footnote 24 Efforts to explain this disconnect between the serious nature of climate risks and uneven public level of concern about climate change have tended to emphasize cognitive and emotional biases at the individual level. Scholars have elaborated a diverse set of reasons why the human mind is poorly adapted to thinking about climate risks.Footnote 25 For instance, even trained experts struggle to identify the rational response to climate threats that involve feedbacks and time delays.Footnote 26 Scholars have also explored how public beliefs about climate change respond to a range of social and psychological cues, rather than to changes in knowledge about climate science. Various studies have described how climate attitudes are a function of elite political cues,Footnote 27 media content,Footnote 28 emotional self-regulation,Footnote 29 ideological biases,Footnote 30 personal weather experiences,Footnote 31 economic conditionsFootnote 32 or cultural world views.Footnote 33 Still other work investigates how diverse framing and persuasion techniques can shape public beliefs about climate and energy reforms.Footnote 34 However, these explanations have almost exclusively focused on first-order climate beliefs – that is, an individual’s personal preferences. However, we suggest here that second-order opinions – beliefs that individuals hold about the beliefs of others – also impose important structural constraints on climate policy making across and within countries.
Our argument echoes a growing body of literature that emphasizes a need to focus not just on what people think, but what they think others think.Footnote 35 Much of this literature draws from research in cognitive psychology, which has long focused on how individuals make inferences about the mind states of others. In recent years, the simulation view has grown more popular, as psychologists argue that individuals make inferences about the mind state of others by imagining themselves as other people.Footnote 36
In the simplest simulation models, individuals use their own beliefs as a heuristic to impute the beliefs of others.Footnote 37 Because individuals will have some intuitive sense that other people are different than themselves, they will often modify this imputation as a function of perceived differences between themselves and the imputed population. For example, Nickerson suggests that individuals discount the ability of others to access personal knowledge they link to their own expertise.Footnote 38 However, referencing the anchoring and adjustment heuristic,Footnote 39 he argues that most individuals insufficiently adjust when imputing the beliefs of others. The result is that many individuals systematically over-represent the incidence of similar beliefs to their own and systematically underestimate the incidence of contrasting beliefs. Epley and Gilovich link this underadjustment to a satisficing dynamic: individuals stop their efforts to impute the beliefs of others once they reach a plausible belief that is closest to their own beliefs, rather than searching for the likely belief of another person. A resulting tendency to underestimate group disagreement is also reflected in literature on the ‘false consensus effect’, which documents how individuals overestimate the homogeneity of group beliefs.Footnote 40 Relatedly, scholars describe a ‘pluralistic ignorance effect’ where most individuals hold some belief but mistakenly assume that others do not.Footnote 41 The overall finding of these literatures, then, is that there is a general egocentric bias in the way that individuals make judgments about the beliefs of others, particular the beliefs of people who they perceive as similar.
Political scientists have documented the presence of such biased second-order beliefs in a range of consequential empirical domains. Shamir and Shamir show the existence of pluralistic ignorance across issue domains in Israel, including preferences for territorial return, nuclear weapons policy and electoral reform.Footnote 42 In similar research, Todorov and Mandisodza find that the US citizens overestimate public support for unilateral foreign policies, and that these misperceptions may condition both an individual’s personal preferences as well as beliefs about the legitimacy of foreign policies.Footnote 43 Still other scholars have demonstrated that Americans perceive more partisan polarization than exists in reality, a phenomenon American politics scholars have described as false polarization.Footnote 44 Related research suggests that the public perceives ideological partisans as more extreme than they are in reality.Footnote 45
These biases are consequential. Most fundamentally, an individual’s second-order beliefs may shape or constrain their first-order beliefs.Footnote 46 For example, Mutz argues that media characterizations of the distribution of opinions critically shapes individual political preferences and behaviors.Footnote 47 These constraints may operate through a mechanism of individual conformity to perceived group preferences.Footnote 48 In other words, second-order beliefs may shape an individual’s views of what is acceptable and thus shape their participation in democratic deliberations. At the extreme, Noelle-Neumann describes a spiral of silence where isolation-fearing individuals may choose to not express themselves when they believe their viewpoint is in the minority.Footnote 49
Such potential misperceptions are compounded by individual tendencies to interact with people who share their beliefs, values and identities. For instance, the US public prefers to communicate with co-partisans,Footnote 50 prefers to consume media that reinforce their ideological predispositionsFootnote 51 and discounts politically relevant information that contradicts existing attitudinal commitments.Footnote 52 Generally, asymmetric communication patterns of this sort will tend to reinforce egocentric second-order beliefs by (incorrectly) validating respondent perceptions that their views are widely shared by the population at large.
Biased second-order beliefs also bear on an individual’s liklihood to engage in co-operative behavior, which depends on beliefs about the beliefs of others.Footnote 53 This is because game outcomes depend on perceptions of the pay-offs of others and, in turn, your perceptions of others’ perceptions of your pay-offs; strategic uncertainty about these perceptions subsequently shape the potential equilibria available to players.Footnote 54 To this effect, Thomas et al. argue that an understanding of the distribution of groups beliefs (for example, common knowledge) is a psychological precursor for costly co-ordination behaviors; when individuals had knowledge about other individuals’ incentives and behaviors, they were more willing to engage in risky (in the sense of potentially costly) forms of co-operation.Footnote 55 Keltner and Robinson primed negotiators to believe there were differences between their own beliefs and the beliefs of others, when in reality, their beliefs were similar.Footnote 56 They found this intervention made co-operation more difficult. Chambers and De Dreu found that egocentrically biased beliefs about the interests of others can undermine attempts to mediate conflict.Footnote 57 And a literature on conditional co-operators in public good games suggests that many individuals increase their contributions to public goods conditional on their expectations of the likely contributions of others.Footnote 58 Still other research finds that when individuals are exposed to information about the true distribution of beliefs, this generates support for more moderate political positions.Footnote 59
Yet, political science attention to second-order beliefs remains surprisingly rare, with scholars having considered second-order beliefs in only a limited number of issue domains and even more rarely in a comprehensive fashion. A lack of attention to second-order climate beliefs is particularly notable given a reasonable expectation that second-order climate opinions will pose particularly acute challenges for efforts to navigate the climate crisis, emphasizing the importance of the climate case as an empirical domain to elaborate this topic. Broadly, when political actors and national publics have biased perceptions of the climate beliefs of others, their tendency to support national or global climate policy action may increase or decrease, depending on the direction of the bias. To the extent that second-order climate beliefs systematically underestimate the true distribution of climate beliefs, we should generally expect that this will reinforce climate policy inaction at both domestic and global scales.
Climate co-ordination will be stymied when actors do not believe that co-ordinating efforts can be effective.Footnote 60 For instance, actors may not invest scarce time or resources in political climate activism because they don’t believe their efforts will help elect a pro-climate political official, will help pressure an existing official to support some pro-climate policy or will help mobilize peers to engage in climate-friendly behaviors. Similarly, climate co-operation will be stymied when individuals believe that other actors may still freeride or when individuals fear social sanctions related to expressing their pro-climate preferences.
At the domestic level, incentives to act collectively will be depressed if individuals underestimate the willingness of others to also act. In this way, second-order beliefs may condition climate-related political behaviors, from willingness to support individually costly climate reforms to an individual’s willingness to invest time or money in climate advocacy campaigns. We can imagine a welfare-damaging equilibrium condition where individuals fail to co-ordinate even though they all individually desire some form of political action because they believe that others do not share their willingness to act. For example, in an experimental study of US climate attitudes, individuals with depressed estimates of the climate beliefs of others were less likely to communicate their beliefs to others; fearing social sanctions, willingness to discuss climate beliefs increased when researchers provided subjects with information about the true distribution of climate beliefs.Footnote 61 More generally, power-seeking political leaders will be disinclined to support reforms if they do not believe these reforms enjoy the support of the general public.
At the international level, elite beliefs about the strategic knowledge and behavior of other countries shapes foreign policy decisions. At the same time, these elite decisions still depend on the beliefs and perceptions of national publics. A growing literature describes how domestic political considerations and public opinion constrain the range of international policies that political leaders support.Footnote 62 In this way, US political actors may find themselves politically constrained when interacting with foreign governments if the US public believes that government will defect from a climate agreement, or if the US public believes that country has low levels of belief in climate change. Consequently, to the extent that national publics underestimate the distribution of climate beliefs in other countries, this might create indirect incentives for national political actors to underinvest in global collective action efforts. Consequently, a complete understanding of second-order climate beliefs also requires an understanding of what national publics think about the distribution of beliefs among other global publics.
The broad consequence of these considerations is that efforts to study the political incentives associated with climate policy action depend not just on the first-order distribution of climate beliefs, but also the more complex expectations that individuals have about the climate beliefs of others. The nature of this distribution is ultimately an empirical question. To date, we have had only a limited understanding of second-order climate beliefs about climate change. Some scholars have documented how individuals systematically underestimate the fraction of climate scientists who support the scientific consensus on climate change.Footnote 63 However, it has only been recently that a handful of scholars have begun to consider second-order climate beliefs, and primarily in one country (Australia). Building from theories of the false consensus effect, Leviston, Walker and Morwinski find that Australians overestimate the proportion of the population who share their views on climate change, and systematically underestimate the true fraction of the Australian population who believe that climate change is happening.Footnote 64 In a separate Australian study of federal politicians, Fielding et al. find that most elected officials believed their own climate attitudes were more pro-climate than their electorates; the one exception was right-leaning politicians who reported personal beliefs that corresponded to their perceptions of the distribution of beliefs in their electorates.Footnote 65
These findings suggest the potential importance of second-order climate beliefs to a full understanding of climate opinion dynamics. However, much work remains. For instance, we still need to understand variation in second-order climate beliefs in the United States and across countriesFootnote 66 and with respect to different politically relevant subpopulations. Further, this research measured second-order climate opinions exclusively by asking respondents to numerically estimate population-level agreement or disagreement with particular beliefs.Footnote 67 It is equally important to understand the content of individual beliefs about the climate beliefs of others, particularly the complex rationales that individuals construct to make sense of the beliefs of others. Ultimately, it is only with a rich understanding of the distribution of beliefs and expectations around climate change policy that we can develop a full understanding of the political conditions necessary to support a climate policy response.
More broadly, the likely salience of second-order beliefs to climate politics also suggests the importance of climate change as a fertile empirical bed for future development of second-order belief theories. Accordingly, our study of second-order climate beliefs not only speaks to an animated debate on the causes of climate policy inaction; we also use the study of climate change to significantly extend previous political science efforts to chart second-order beliefs. These innovations include our novel efforts to study second-order beliefs in a single issue domain across countries (in China and the USA), experimental evidence linking shifting second-order beliefs to willingness to engage in collective action, efforts to study second-order beliefs simultaneously among mass publics and elites, and the first analysis of second-order belief content (rather than simple attention to the perceived distribution of beliefs).
RESEARCH DESIGN
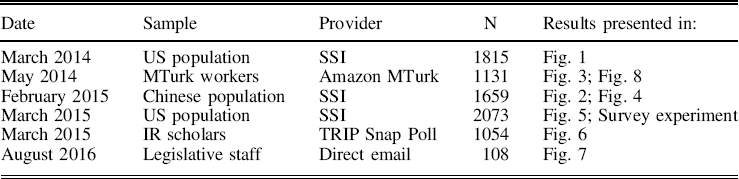
This article explores the empirical distribution of second-order beliefs using questions fielded in a series of national surveys in the United States and China between 2014 and 2016. These data sources are presented Table 1, along with the sections of our results that draw from each survey source.
Overview of Survey Data Described in this Article

Our US survey data draw from five separate data sources. Our first and second sources were nationally representative surveys of the US public. First, we included questions on a nationally representative survey conducted by Survey Sampling International (SSI) of Shelton, CT (n=1,815), in March 2014. We also included questions in a national representative survey conducted by SSI (n=2,073) in March 2015. Survey Sampling International conducts internet surveys from opt-in recruits, and has been widely used within political science research.Footnote 68
Third, we fielded a standalone survey during May 2014 using Amazon’s Mechanical Turk service (n=1,131).Footnote 69 MTurk is an online marketplace that allows researchers to post surveys and other small tasks to be completed by eligible workers. Mechanical Turk populations are not nationally representative; however, they outperform other forms of convenience-based opinion sampling along a variety of dimensions.Footnote 70 Mechanical Turk samples also have a well-studied liberal bias, which correlates with pro-climate beliefs in the US context. We used an innovative sampling method to manage this bias in this study.Footnote 71 Specifically, we drew our samples from a pre-existing database of Mechanical Turk responses that were collected by the authors in previous work. This database included responses to previous questions about respondents’ climate change opinions.Footnote 72 We invited 2,003 Mechanical Turk workers with known climate priors to take our new surveys. Of these invited workers, 1,001 had previously indicated that they believed climate change was happening and 1,002 had previously indicated they did not. We received 1,131 complete surveys, a response rate of 56.5 per cent. This procedure gave a decidedly better balance on individual-level climate beliefs than would have been the case if we had relied on an opt-in sample from the general Mechanical Turk population.Footnote 73 As with all MTurk samples, we should not expect our data to be nationally representative. All respondents were US residents who had over a 95 per cent approval rating from previous Mechanical Turk tasks.
Fourth, we fielded two questions about compliance with the US-China Climate Accord in a Teaching, Research and International Policy (TRIP) Snap poll in March 2015 (n=1,054). The TRIP poll periodically surveys International Relations (IR) professionals about topics in current affairs.Footnote 74
Fifth, we embedded a second-order climate belief question in a survey of US congressional staffers (n=106) in August 2016. This survey focused on chiefs of staff and policy support staff across all Congressional and Senate offices. Methodological details describing this survey, including evidence of balance across most staffer attributes are provided elsewhere.Footnote 75
Sixth, and finally, we also fielded questions in a nationally representative internet-based survey of the Chinese public in February 2015, again using the firm Survey Sampling International (n=1,659). This survey used quota sampling procedure to achieve an approximately nationally representative sample based on gender, age and region in China. The survey was translated from English to Mandarin by native speakers and then back-translated. Differences between the questions asked in the Chinese and US surveys are detailed in the following section.
Survey Questions
Here, we introduce the five survey sections that form the basis for our core analysis.
First, we collected data on individual perceptions of domestic climate beliefs. In our March 2014 SSI survey of the US population, we presented each respondent with three climate-themed statements: (1) Global warming is happening; (2) Global warming is caused by human activity; (3) Most scientists think global warming is caused by human activity. We asked for respondent agreement or disagreement with these statements along a four-point scale from Strongly Agree to Strongly Disagree. Then, for each statement separately, we asked respondents: ‘To the best of your knowledge, what percentage of the US population would AGREE with the statement that [statement]. Type a number from 0 (no one) to 100 (everyone)’. In our MTurk surveys and in our March 2015 SSI survey of the Chinese population, we presented each respondent with a set of four climate-themed statements: (1) Global warming is happening; (2) Global warming is caused by human activity; (3) The [United States/China] should pass a policy to increase the cost of carbon pollution; and (4) The [United States/China] should sign an international treaty that requires the [US/China] to cut its emissions of carbon dioxide 90 per cent by the year 2050. Again, for each statement separately, we asked respondents: ‘To the best of your knowledge, what percentage of the [American/Chinese] population would AGREE with the statement that [statement]. Type a number from 0 (no one) to 100 (everyone)’.Footnote 76
Second, in our MTurk surveys, we asked a series of open-ended questions about the rationales that individuals attributed to the climate beliefs of others. Our first prompt dealt with whether or not climate change is happening and read: ‘Some people in the United States believe that climate change is not happening. Other people think that climate change is happening. We would like for you to imagine you are talking to a group of colleagues who do [do not] believe that climate change is happening. Imagine you asked each of them why they do believe climate change is [is not] happening. What do you think they would tell you? Please write several sentences, focusing on what you think their responses would be. They would say […]’ Individuals in our survey were randomly assigned to speculate as to the rationales of those who do believe or those who do not believe that climate change is happening.
Third, we collected data on individual perceptions of climate beliefs among foreign publics. For both US and Chinese surveys, we used the four-statement set described above. In our US MTurk surveys, we randomly assigned respondents to estimate the fraction of the US or Chinese population that agreed with each statement. We use a between-subject analysis here to avoid concerns that individuals will anchor their responses on their in-group (domestic) estimate when estimating the subsequent distribution of second-order climate beliefs. In our Chinese SSI survey, we randomly assigned the order in which respondents were asked to estimate domestic (Chinese) or foreign (US) beliefs.
Fourth, we collected data on US perceptions of the likely compliance of both the United States and China with the 2014 US–China Climate Accord. To do so, we fielded identical questions among a nationally representative survey of the US population in the March 2015 SSI survey and among IR experts in the March 2015 TRIP poll. For each poll, respondents were provided with the following information: ‘In November 2014, the United States and China announced an agreement to work together to solve the threat of global warming. President Obama announced the US would cut its carbon pollution 26 per cent by the year 2025. China agreed to stabilize its carbon pollution levels by 2030 and meet 20 per cent of its energy needs through clean renewable energy by 2030. The announced goals were voluntary.’ We asked respondents whether they agreed or disagreed that each country ‘will meet its carbon pollution reduction and clean energy goals from the November 2014 agreement’. We then asked respondents: ‘To the best of your knowledge, what percentage (from 0 to 100) of [Chinese/American] citizens would agree with the following statements? (1) The United States will meet its carbon pollution reduction goals from the November 2014 agreement; (2) China will meet its carbon pollution reduction and clean energy goals from the November 2014 agreement.’
Fifth, we embedded a survey experiment within the March 2015 nationally representative survey of the US public. In this experiment, we provided a random subset of respondents with the true Chinese distribution of climate beliefs. These respondents read, ‘According to recent nationally representative polling in CHINA, 98 per cent of the CHINESE population believes that global warming is happening’. In this way, we randomly treated our sample with the true distribution of climate beliefs in China, as measured by our February 2015 SSI Chinese survey data.
RESULTS
First, we summarize the distribution of within-country second-order climate beliefs. This section summarizes how American and Chinese publics perceive climate beliefs and climate policy support within their own countries. Second, we summarize between-country second-order climate beliefs. This section summarizes the perceptions of American and Chinese publics about the distribution of climate beliefs among the other country’s population. Third, we investigate whether the egocentric bias we identify among mass publics extends to both intellectual and political elites. Fourth, we present results from an experimental effort to shift second-order beliefs to increase support for collective climate action. Fifth and finally, we examine the distribution of rationales that individuals ascribe to the beliefs of others.
Within-Country Results
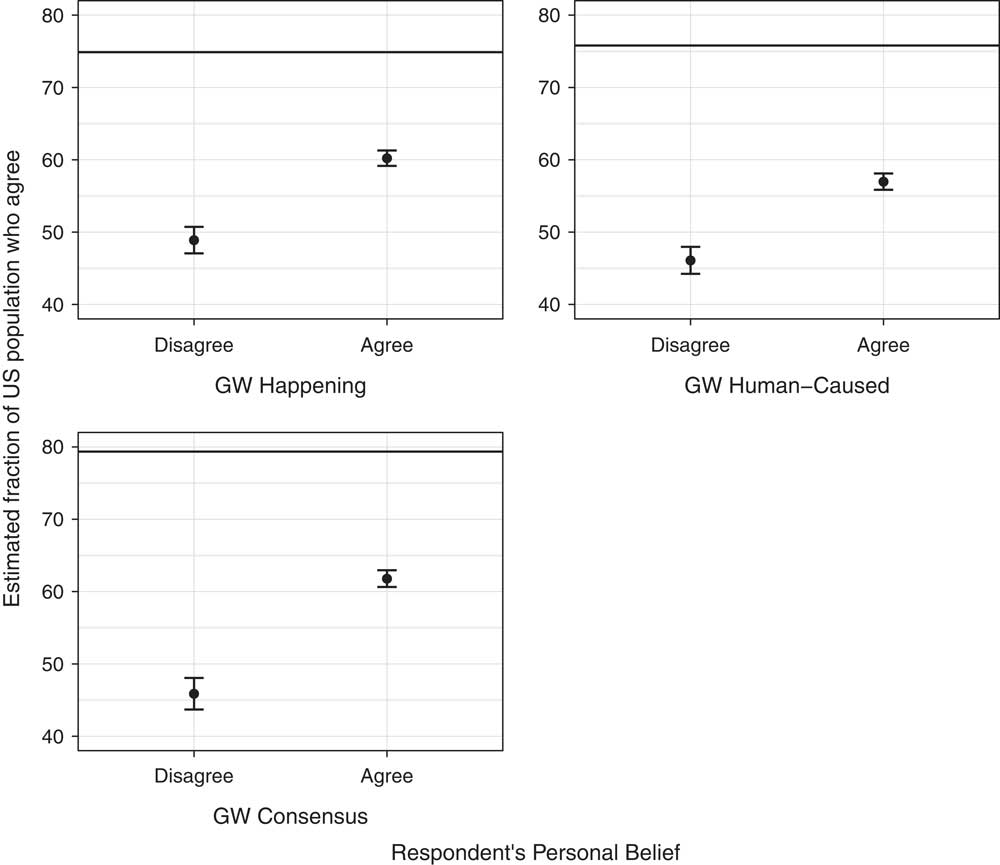
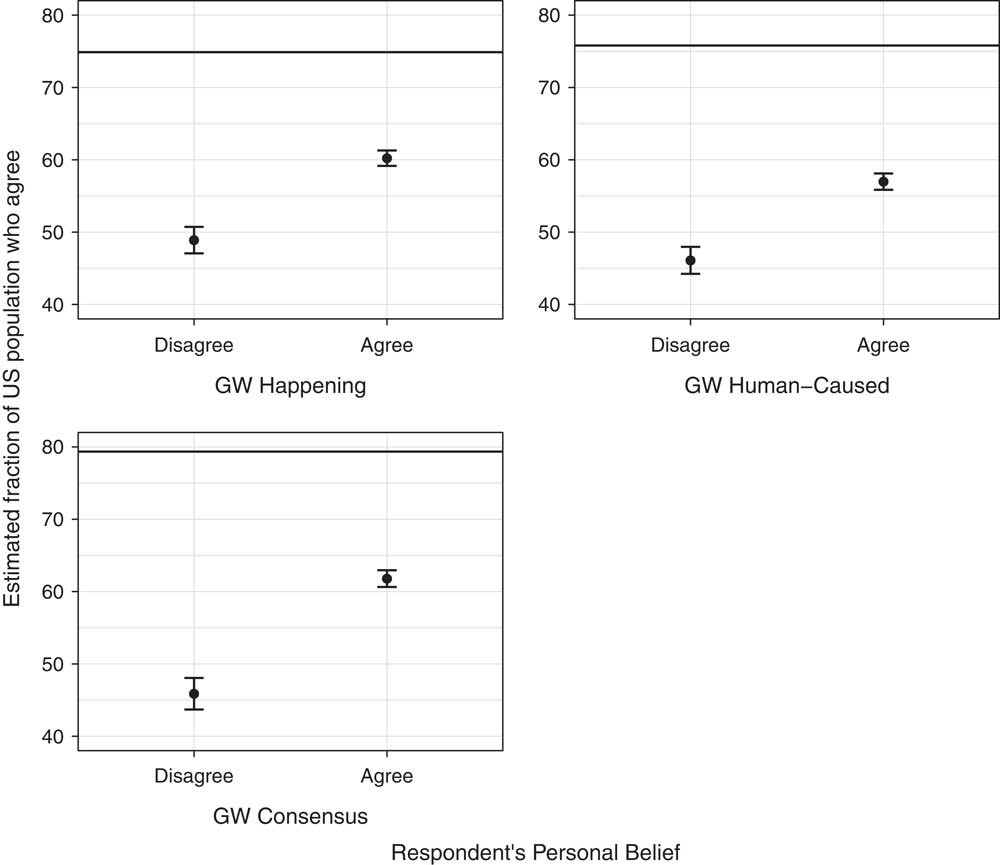
The results of our surveys revealed a consistent pattern among second-order beliefs: people underestimate the percentage of the population with pro-climate beliefs. Figure 1 summarizes the average estimates of the fraction of the US population that agrees or disagrees with three climate statements, collected from a nationally representative SSI survey fielded in March 2014. We find that both climate change believers and disbelievers systematically underestimate the true level of pro-climate beliefs for all three statements.Footnote 77
Estimates by US citizens of US population agreement with statements about climate change, conditional on a respondent’s reported personal beliefs Note: GW Happening=‘Global warming is happening’. GW Human-Caused=‘Global warming is caused by human-activity’. GW Consensus=‘Most scientists think global warming is caused by human activity’. The horizontal line on each graph gives the true population agreement with each statement (as estimated by March 2014 nationally representative SSI survey of the US population). Error bars give the 95% confidence interval.
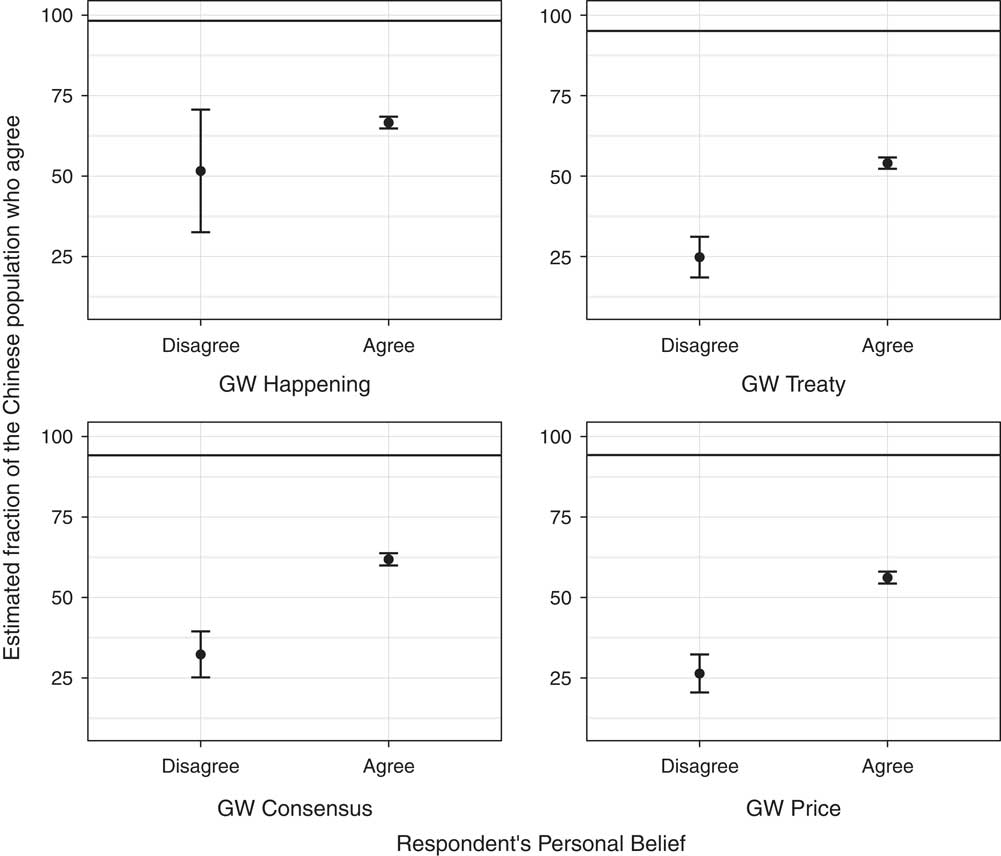
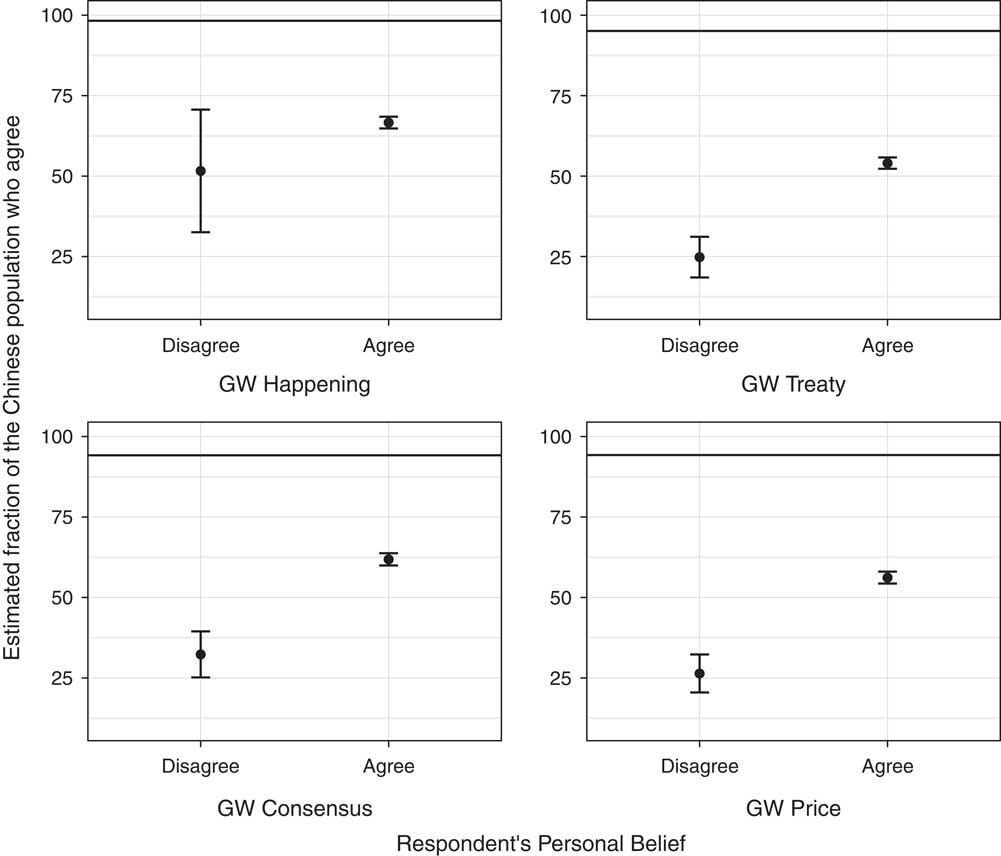
Estimates by Chinese citizens of Chinese population agreement with statements about climate change, conditional on a respondent’s reported personal beliefs Note: GW Happening=‘Global warming is happening’. GW Consensus=‘Most scientists think global warming is caused by human activity’. GW Treaty=‘China should sign treaty requiring 90 per cent cuts by 2050’. GW Price=‘China should put a price on pollution’. The horizontal line on each graph gives the true national level of agreement with these statements (as estimated by March 2015 nationally representative SSI survey of the Chinese population). Error bars give the 95% confidence intervals.
Despite a general tendency to overestimate the number of climate disbelievers, the US public also displays substantial egocentric bias across a range of different climate beliefs and climate policy preferences. By egocentric bias, we mean that an individual’s personal beliefs systematically shape their perceptions of group beliefs. We find that individuals condition their second-order climate beliefs on their personal agreement or disagreement with each statement: those who individually disagree with a statement report systematically lower estimates of population-level agreement with that statement.Footnote 78 Further, we find evidence of similar egocentric bias and similar global underestimation of climate beliefs across different education levels (results provided in the SI). These results replicate findings from Leviston, Walker and Morwinski for the first time in a US context. In the SI, we also explore differences in second-order climate beliefs among partisans.Footnote 79 We find that pro-climate Republicans systematically overestimate the number of Republicans who are pro-climate; however, anti-climate Republicans and all Democrats hold otherwise homogeneous second-order order beliefs about the partisan distribution of climate opinions.
We find similar results in a nationally representative survey of the Chinese public, fielded by SSI in February 2015.Footnote 80 The belief in climate change and support for select climate policies are higher, in an absolute sense, in China than in the United States. However, the Chinese public similarly underestimates the fraction of the Chinese population that supports climate-related statements.Footnote 81 We also find similar evidence for egocentric bias in the second-order climate beliefs within the Chinese population. Chinese respondents who personally agree with particular statements estimate that a larger fraction of the Chinese population agrees with that statement than those who personally disagree.
Between-Country Results
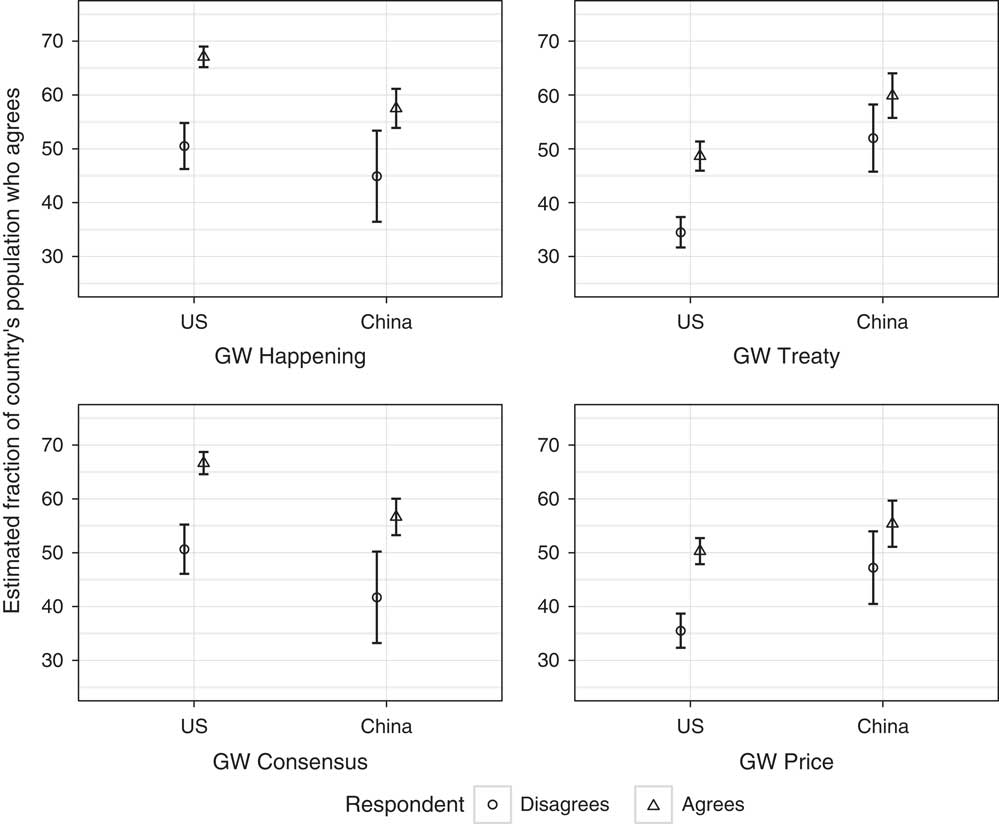
Next, we explore US and Chinese perceptions of climate beliefs in the other country. Figure 3 contrasts US perceptions of the distribution of climate beliefs in the United States with US perceptions of the distribution of climate beliefs in China. The data here come from a non-representative survey using MTurk.Footnote 82 Again, the data are presented conditional on a respondent’s personal beliefs. Americans broadly perceive that the Chinese public has lower support for climate-science related statements than does the US population. At the same time, they perceive the Chinese population as believing that US support for policy action is stronger than Americans themselves believe.Footnote 83 These data also provide suggestive evidence of declines in egocentric bias when estimating Chinese as opposed to US population agreement with climate-related statements. That is, the gap between what those who agree and those who disagree report as second-order beliefs is smaller when estimating China as opposed to the United States.
Estimates by US citizens of US and Chinese population agreement with statements, conditional on a respondent’s personal beliefs Note: GW Happening=‘Global warming is happening’. GW Treaty=‘US should sign a treaty requiring 90 per cent cuts by 2050’. GW Consensus=‘Most scientists think global warming is caused by human activity’. GW Price=‘US should put price on a pollution’. Error bars give the 95% confidence interval.
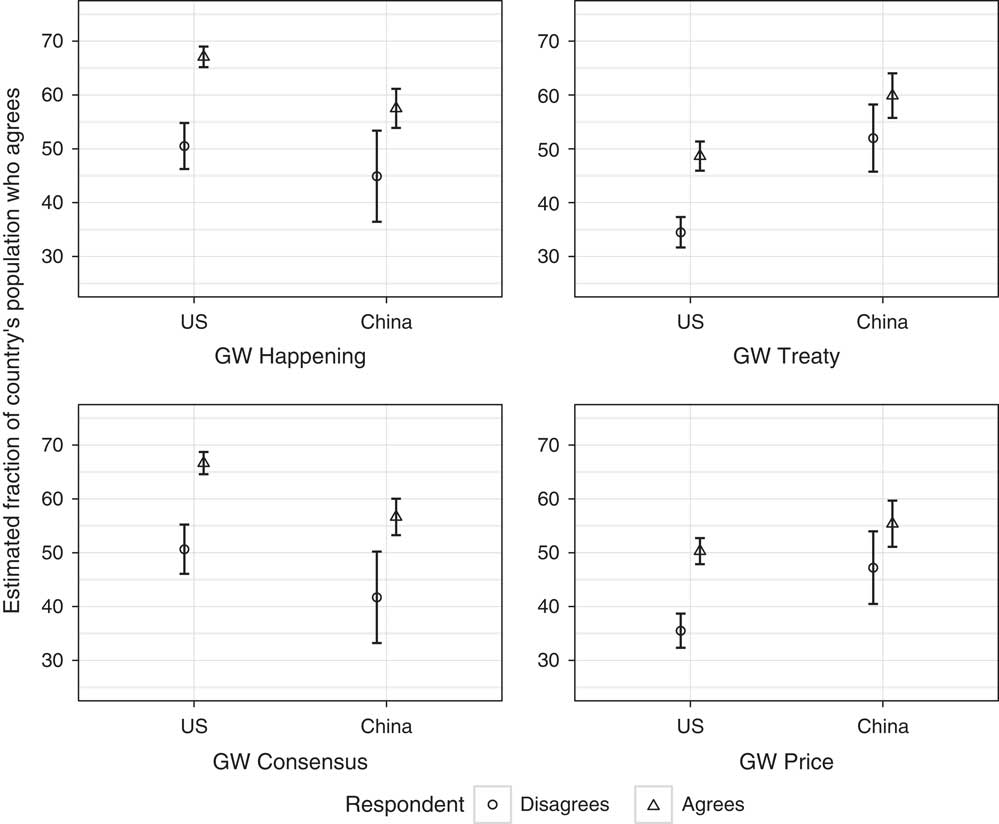
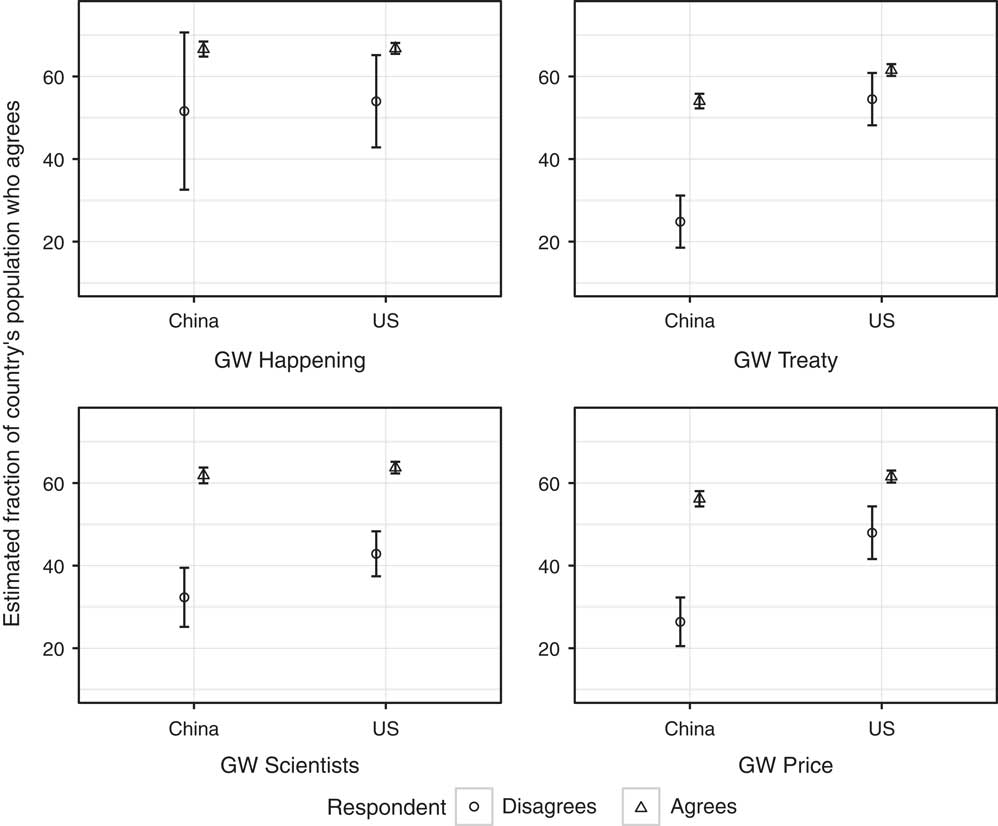
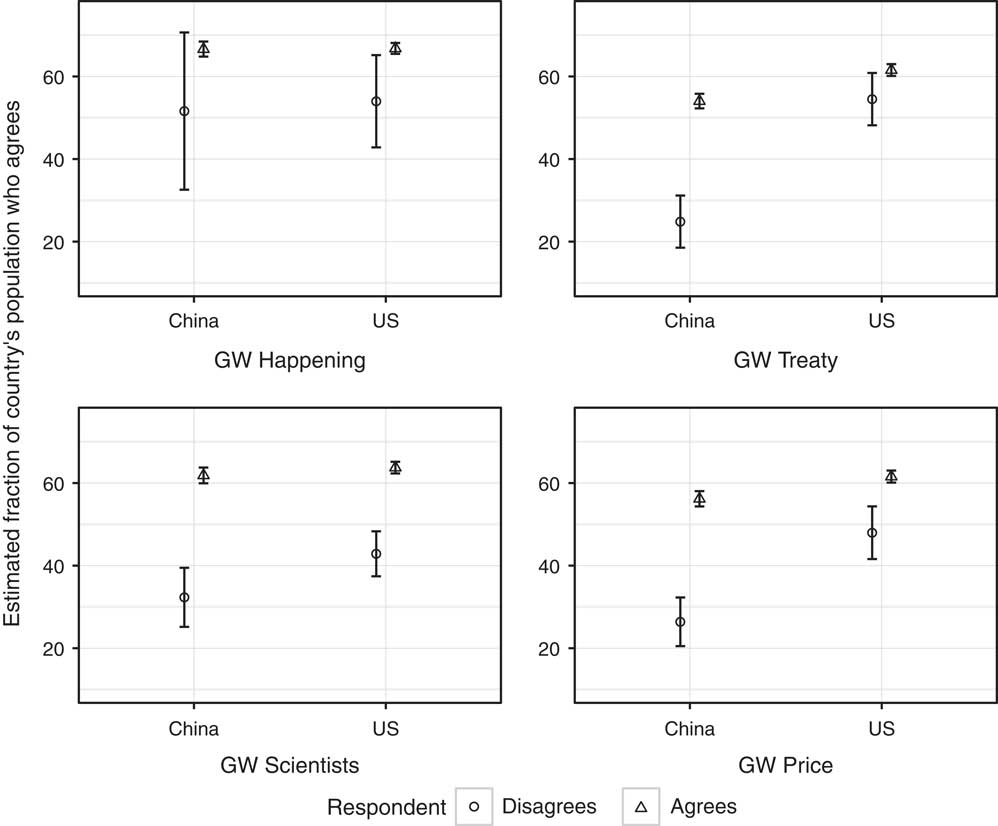
We replicate this analysis in reverse in Figure 4, using a nationally representative sample of the Chinese population. Here, we estimate Chinese perceptions of the distribution of climate beliefs in both China and the United States, conditional on personal beliefs. Unlike the US case, we see only minimal reduction of egocentric bias when estimating population beliefs of the outgroup (now the US) when it comes to whether or not global warming is happening. However, there is a small reduction in egocentric bias when it comes to the question about the scientific consensus around climate change. We see strong attenuation of egocentric bias for the policy questions. In this way, the Chinese population mirrors the US population with its pattern of attenuated egocentric bias when estimating the policy preferences of the other country’s public.
Estimates by Chinese citizens of Chinese and US population agreement with statements, conditional on a respondent’s personal beliefs. Note: GW Happening=‘Global warming is happening’. GW Consensus=‘Most scientists think global warming is caused by human activity’. GW Treaty=‘China should sign treaty requiring 90 per cent cuts by 2050’. GW Price=‘China should put price on pollution’. Error bars give the 95% confidence interval.
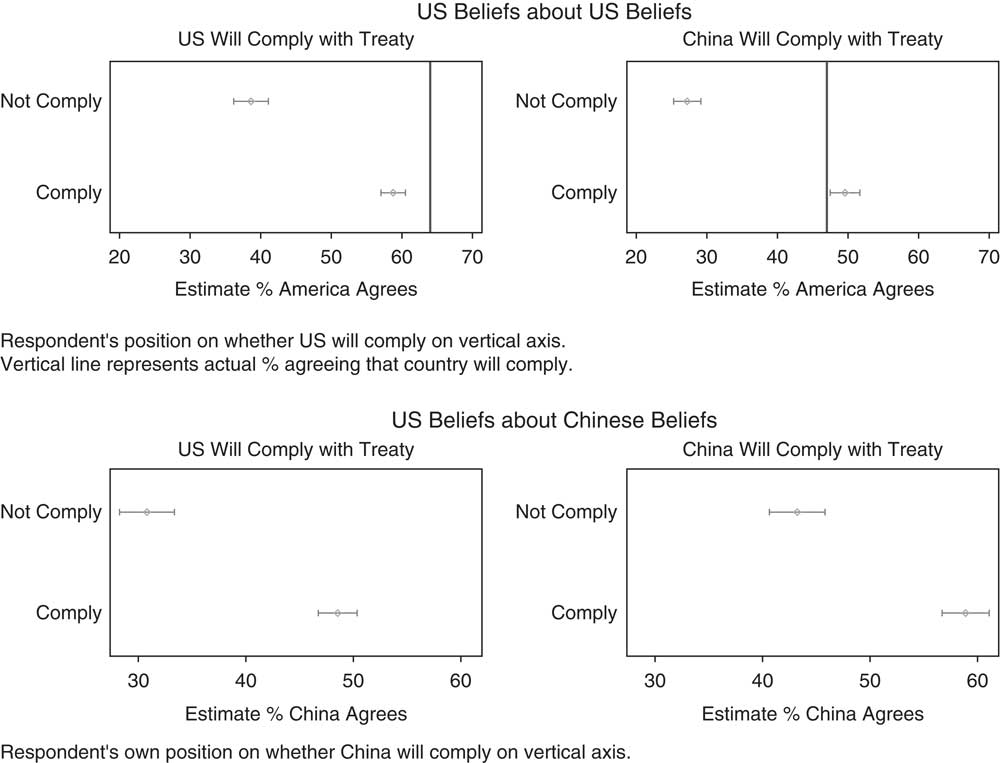
Finally, we examine second-order beliefs concerning compliance with the 2014 US–China climate accord. Our sample is drawn from a subset of our March 2015 SSI survey that was the ‘control’ group in an experiment we describe shortly. Figure 5 gives US estimates of US and Chinese beliefs about US and Chinese compliance with the accord. The top left pane focuses on beliefs about the percentage of Americans that think the US will comply. In this survey, 64 per cent of Americans believe that the US will comply with the treaty. However, individuals who do not believe the US will comply estimate that on average only 40 per cent of Americans expect their country to comply. And while this figure is greater for those individuals who think the US will comply (59 per cent), it is still lower than the actual percentage. This finding, of underestimating population-level support in a way that is still conditional on one’s own belief, parallels what we reported earlier. The top right pane of Figure 5 focuses on the percentage of Americans that think China will comply. Here, as represented by the vertical line, only 47 per cent of Americans believed that China will comply (compared to 64 per cent believing that the US will comply). Individuals who themselves do not think China will comply were particularly pessimistic about Americans as a whole thinking China will comply. Individuals who do think China will comply slightly overestimated the actual percentage who think so among the population, representing the more traditional form of egocentric bias.
Estimates by US citizens of US and Chinese compliance with the US-China Climate Accord Note: Error bars give the 95% confidence intervals.
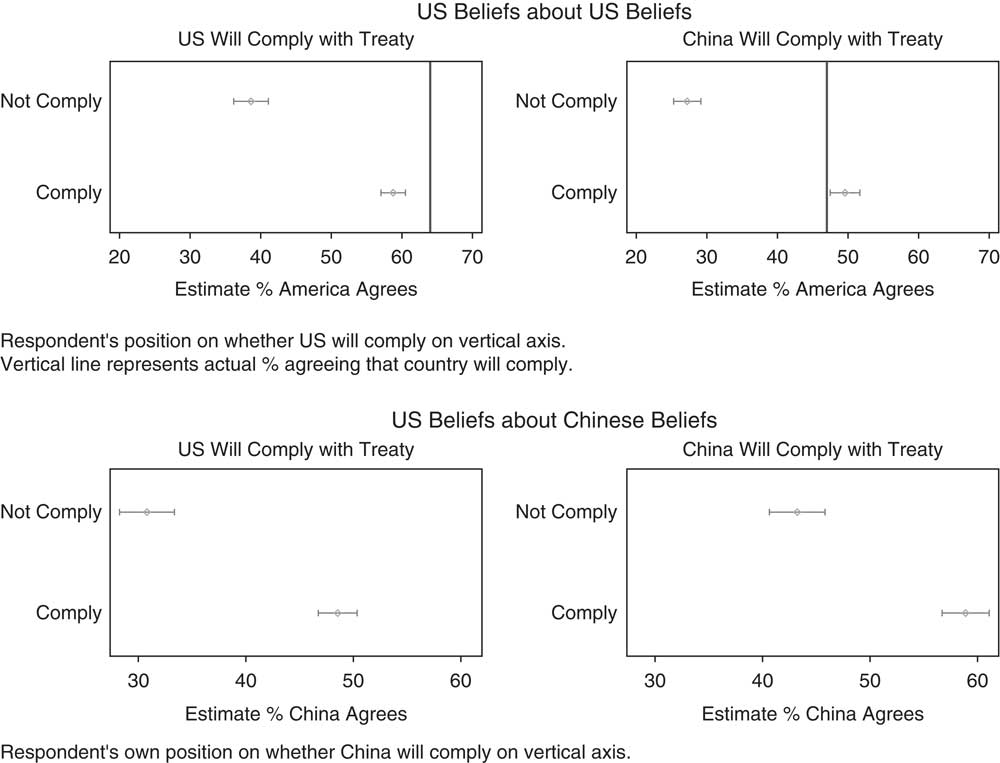
By contrast, the lower two panes of Figure 5 give US estimates of Chinese beliefs about US and Chinese compliance with the accord, again using data from our March 2015 SSI sample. Overall, Americans expect Chinese citizens to think that US compliance is less likely than Chinese compliance. Similarly, Americans think that Chinese respondents will perceive China as more likely to comply than the US.
Elite vs. Public Second-Order Beliefs
While we find evidence of egocentric bias in the distribution of the mass public’s second-order beliefs, do the same biases extend to intellectual and political elites?
We first consider intellectual elites, by examining estimates by US IR scholars of US beliefs about US and Chinese compliance with the accord. While we do not have data for policy elites involved in negotiating international agreements, IR experts are drawn from the same community of experts that shape US foreign policy decisions. We should also expect that most IR scholars will be more familiar with the logic of the collective action challenges with respect to climate change. In sum, surveys of IR scholars offers a partial window into whether policy elites have systematically different perceptions of the distribution of climate opinion when compared to the general public, including whether general public biases are attenuated among active policy influencers.
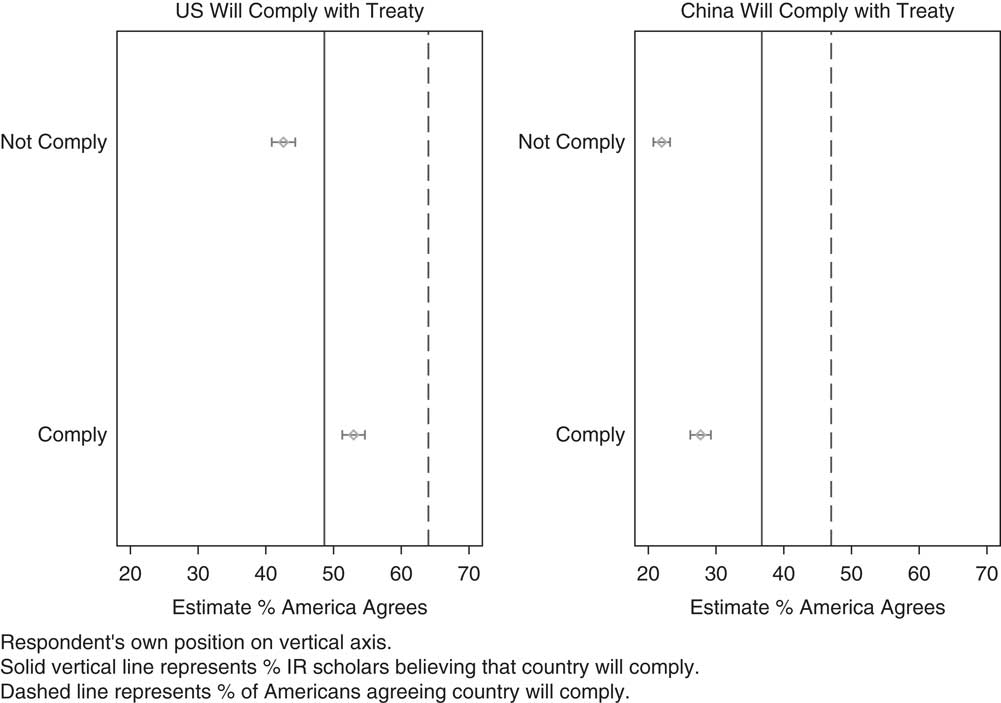
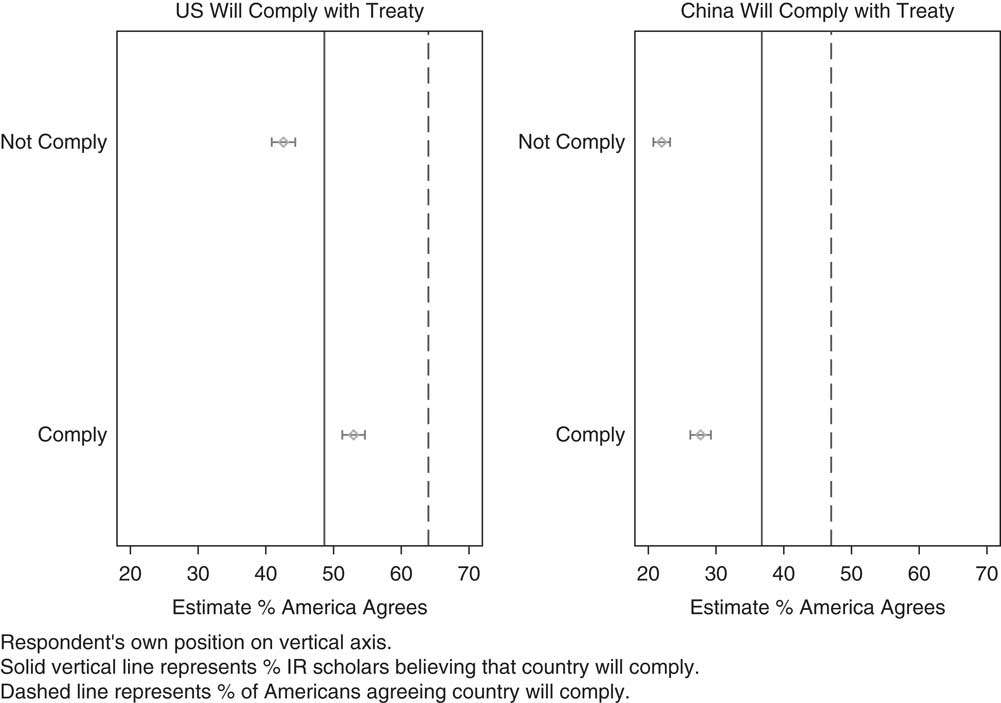
Our results appear in Figure 6, which parallels the structure of Figure 5 and is taken from the March 2015 TRIPS survey. The solid vertical line gives the percentage of IR scholars that think each country will comply. We again see that expectations of US compliance are greater than expectations of Chinese compliance (48 per cent versus 37 per cent). The dashed lines represent the average percentage of Americans thinking that each country will comply (these are the same as the solid lines in Figure 5). International Relations scholars are decidedly more pessimistic about compliance than is the US public. At the same time, we again see evidence of egocentric bias, even among policy elites. IR scholars who believe each country will comply report a larger estimate of the US public that thinks each country will comply, compared to IR scholars who don’t think each country will comply.
Estimates by IR scholars of US and Chinese compliance with the US-China Climate Accord Note: Respondent’s own position on vertical axis. Vertical line represents % agreeing that country will comply. Error bars give the 95% confidence intervals.
Alternatively, we can interrogate the presence of egocentric bias among political elites, drawing from an August 2016 survey of US congressional staffers. This staffer survey focused on chiefs of staff and policy support staff in Congressional and Senate offices. A priori, we should expect that political elites have every incentive to accurately estimate the distribution of national public opinion, since this knowledge allows them to offer better political advice to their Members and thus serve their Members’ electoral interests. Further, we might expect that staffers have substantially more opportunities to learn about the true distribution of US public opinions than members of the US public.
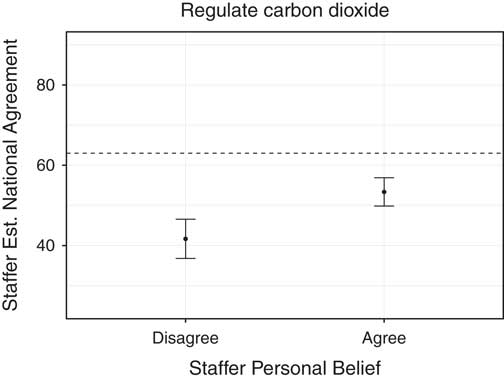
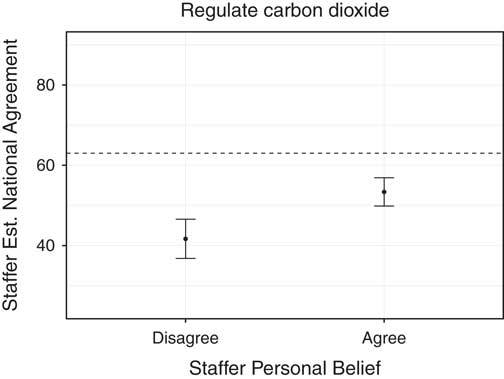
However, as Figure 7 makes clear, we again see persistent evidence of egocentric bias in a climate-related question embedded within the 2016 survey of Congressional staffers. Staffers who personally believe that the US should regulate carbon pollution estimate that a higher fraction of the overall US public believes in such regulation. Further, both staffers who personally agree and those who disagree with the statement globally underestimate the true fraction of the US public who support the statement.
Estimates by US congressional staffers of national agreement that the US should regulate carbon dioxide (the primary greenhouse gas) as a pollutant Note: The true national average, from Howe et al. (Reference Howe, Mildenberger, Marlon and Leiserowitz2015), is displayed as a dashed horizontal line. Error bars give the 95% confidence intervals.
Shifting Second-Order Beliefs
In this section, we take our analysis a step further by investigating results from an experimental effort aimed at directly evaluating the effect of second-order beliefs on support for collective action. As described above, in the March 2015 SSI survey of the US public, we provided a random subset of respondents with the true Chinese distribution of climate beliefs. These respondents read: ‘According to recent nationally representative polling in CHINA, 98 per cent of the CHINESE population believes that global warming is happening’. In this way, we randomly treated our sample with the true distribution of climate beliefs in China, as measured by our February 2015 SSI Chinese survey data. On average, exposing individuals to this information increased support for the treaty by 0.35 on our 0–10 compliance scale which, while relatively small, was significantly different from zero.Footnote 84
While this effect is interesting in its own right, we were particularly interested in understanding whether shifting second-order climate beliefs would (a) have an impact on expectations about Chinese government compliance with the US–China Climate Accord and (b) if these beliefs influenced support for the US signing the agreement. This sets up a mediation analysis.Footnote 85 Does the effect of our treatment on support for the climate agreement operate through changes in second-order beliefs about Chinese compliance? Our mediator was measured by asking: ‘To the best of your knowledge, what percentage (from 0 to 100) of Chinese citizens would agree with the following statement? China will meet its carbon pollution reduction and clean energy goals from the November 2014 agreement.’
We estimated the mediation effect using the medeff routine described in Hicks and Tingley, with linear models for both the mediator and outcome variables.Footnote 86 Results show an average causal mediation effect of 0.09 (with a 95 per cent confidence interval of 0.06 to 0.14). Nearly 40 per cent of the average treatment effect can be attributed to changes in second-order beliefs about Chinese compliance expectations. We thus find that there is a very strong mediation effect on the support for the climate accord as a function of treating the respondent’s second-order beliefs.
Measuring the Content of Second-Order Climate Beliefs
Thus far, we have reported results that explore individuals’ perceptions of what views are held by others. This section considers the why. That is, we want to know what people think the reasons are that other individuals – perhaps ones that do not share their views – would give for their views. To do this, we asked our respondents to respond in an open-ended manner and write as if they were an individual who took a specific view on a climate change topic.Footnote 87 Then, we performed textual analysis on those open-ended responses in order to see if the topics people wrote about differ depending on the survey respondent’s own beliefs.
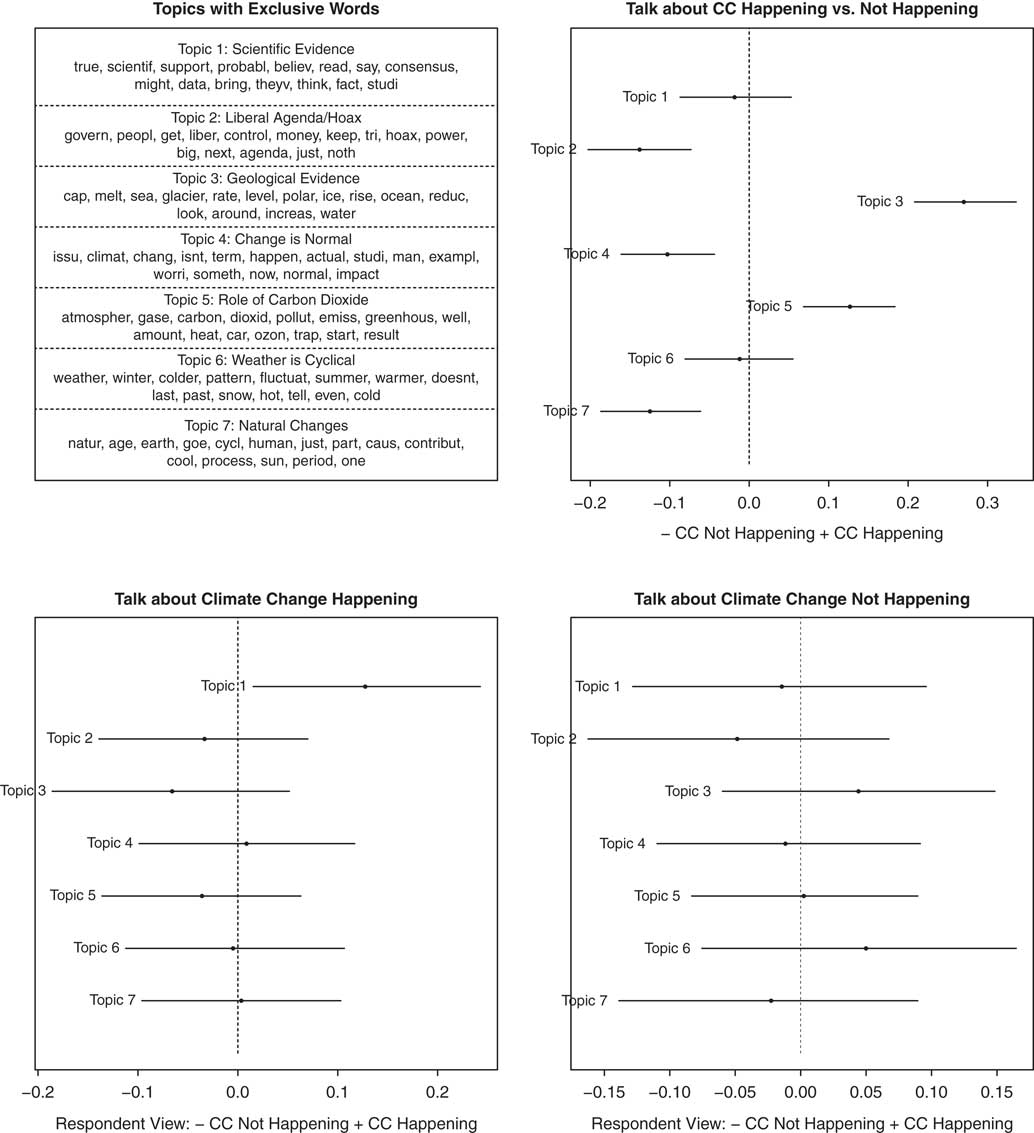
To analyze this open-ended data we utilize the Structural Topic Model (STM),Footnote 88 which has recently shown great promise in analyzing open-ended survey data. The STM is a type of ‘topic model’ that discovers common co-occurrences of words and groups them into topics. An advantage of the STM over earlier topic models is that it investigates whether a covariate related to each document explains a propensity to talk about particular topics. In our case, we are interested in knowing whether individuals in our survey who differ in their climate beliefs also differ in the rationales they expect others would give to explain their climate change beliefs. For example, in responding to a prompt to explain why another person holds the view that climate change is happening, would an individual who thinks that climate change is not happening give the same response as someone who thinks climate change is happening?
To answer this question, we estimated a seven-topic STM with three topic prevalence parameters: whether the respondent thinks climate change is happening or not, whether the respondent got the prompt about others’ rationales for their climate change beliefs, and an interaction between these two variables. Figure 8 plots the results. The top left of the plot provides a list of words for each topic that are highly exclusive with the topic.Footnote 89 These words help to discern differences between the topics and can be used to label the topic. For example, Topic 2 (Liberal Agenda/Hoax) deals with the influence of the liberal agenda on government. Topic 7 (Natural Changes) is about how climate change is a naturally occurring pattern that has happened before and can happen again. Topic 1 (Scientific Evidence) deals with generic scientific claims.
Structural Topic Model on beliefs on climate change Note: Top left of figure lists words highly exclusive to each topic which is labeled based on its semantic content. Top right gives the topic contrast between those who were asked to provide rationales for why others think climate change is happening and those asked to explain why others think climate change is not happening. Topics with effects further to the right e.g. were more likely to be discussed by those writing about climate change happening. Bottom half of figure plots the relationship between topics and respondent’s own views on whether climate change is happening. The left hand plot is for people who were asked to write about an individual who thinks climate change is happening, and the right plot for people who were asked to imagine someone who did not think climate change is happening. The lines in the plot represent 95% confidence intervals for the difference between respondents who themselves think climate change is versus is not happening. Effects that are further to the left are more likely to be mentioned by an individual who does not believe climate change is happening. Effects that are further to the right are more likely to be mentioned by an individual who does believe climate change is happening.
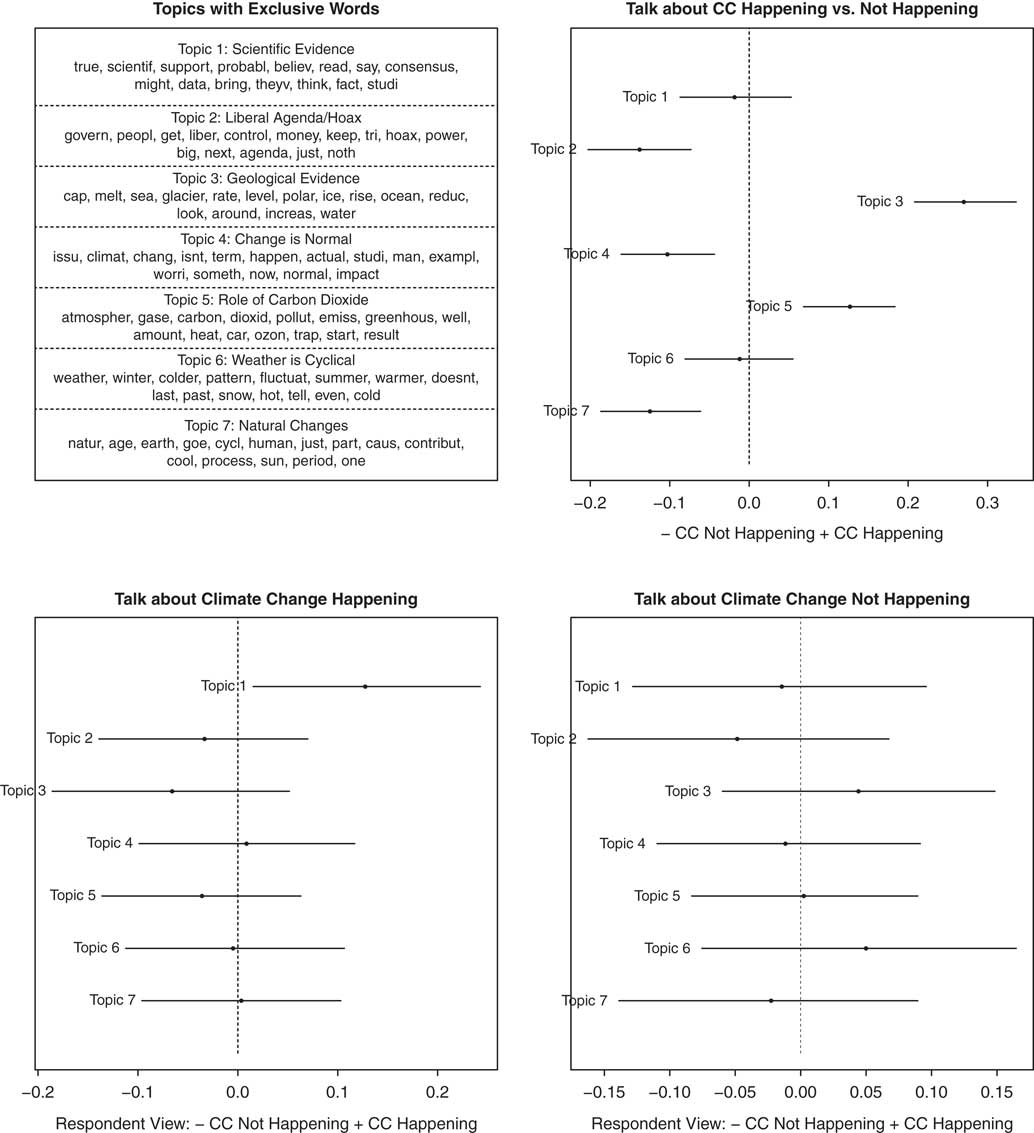
The top right gives the contrast between those who were asked to provide rationales for why others think climate change is happening and those asked to explain why others think climate change is not happening. Point estimates (with 95 per cent uncertainty intervals) give the expected shift in the proportion of a document belonging to a given topic as a function of a change in this covariate (whether rehearsing arguments about climate change happening or not).Footnote 90 For example, individuals rehearsing why climate change is happening were much more likely to point to geological evidence compared those rehearsing why climate change is not happening.
The bottom half of the figure, which is our core interest, plots the relationship between topics and respondents’ own views on whether climate change is happening. The bottom left, for example, focuses on the condition where individuals were talking about climate change happening. The covariate effect of interest is, in this case, shifting between an individual who believed climate change was happening to someone who does not. In other words, the effect estimate indicates the change in each topic’s proportion in a document that occurs due to this change in the covariate.
The differences in the rationales offered by those who believe climate change is happening and those who do not were substantively small and in every case except one statistically insignificant. While a larger sample would likely reduce our confidence intervals, the point estimates of the differences were also small.Footnote 91 This suggests that individuals on both sides of this issue have similar beliefs about the rationales that others might draw on when substantiating their views. We take this as evidence in support of there being common knowledge about rationales. In the SI, we present results for a political actor prompt that asked respondents to suggest the rationales that a politician might have for believing or disbelieving in climate change. Again, we see no substantial differences across individuals in our survey. Thus overall, we find that differences in climate beliefs do not translate into a tendency to believe that others would invoke one rationale over another to explain their position.Footnote 92 Hence while this article documents substantial differences in second-order beliefs about the distribution of climate beliefs, there are less differences when it comes to the content of these beliefs. For those wishing to promote an agenda to take action on climate change, it is possible that this shared understanding of rationales could facilitate political consensus-building efforts, despite the pronounced polarization that defines the distribution of climate beliefs today.
DISCUSSION
Our empirical results emphasize five key features of the distribution and content of second-order climate beliefs. First, we find evidence of systematic egocentric bias in second-order climate beliefs. Individuals who hold anti-climate beliefs or policy preferences estimate that a smaller fraction of a given target population holds pro-climate positions. This evidence emphasizes how second-order climate beliefs are conditioned by respondents’ personal beliefs. While previous work has demonstrated similar results for the Australian public, we find the first evidence for systematic egocentric biases in the United States and China, the planet’s two largest carbon polluters.
Second, we find related evidence that members of the public globally underestimate the true fraction of the US or Chinese population who hold pro-climate views. We make this assessment by comparing the average second-order beliefs of different political actors with nationally representative survey estimates. Our results also extend to cross-national second-order beliefs, since we find that the US public systematically underestimates the fraction of the Chinese public with pro-climate beliefs and preferences, and vice versa. Broadly, individuals in both China and the US believe that foreign publics are more supportive of policy actions than those foreign publics perceive themselves to be. Individuals also showed less evidence of egocentric bias when estimating the distribution of beliefs among foreign publics.
Third, we might expect, a priori, that these biased second-order beliefs are most acute among mass publics. Other class of political and intellectual elites may have more opportunity or incentive to estimate the true distribution of public opinion. However, we replicate our findings of egocentric bias in original surveys of political elites (via a survey of high-level US Congressional staffers) and intellectual elites (through a survey of international relations scholars). These surveys corroborate the persistent presence of egocentric bias and global underestimation among a set of political actors who might be least likely to be subject to these biases. Among IR scholars, the underestimation of Chinese views seems linked to a belief that the US, in turn, will not (or should not) comply with its commitments under the US–China climate accord.
Fourth, despite finding egocentric biases in climate opinion estimates, we find evidence of common knowledge in the domain of rationales for climate beliefs. In other words, the American public appears to hold shared beliefs about why climate change believers and skeptics believe what they do. Differences in policy preferences did not translate into a differential tendency to believe that others would invoke one rationale over another for their position. Moreover, the type of rationales that the public ascribes to believers vs. disbelievers are distinct. These results emphasize the weakness of ‘information deficit’ models of climate policy inaction, since they suggest a broadly shared understanding of climate science and policy by both proponents and opponents. Differences in perceptions about the distribution of climate beliefs do not appear linked to mischaracterizations of the reasons that people agree or disagree about climate change. These results thus corroborate recent work that has emphasized the gap between public understanding of climate science and both personal climate beliefsFootnote 93 and concerns about climate risks.Footnote 94 Public climate change debates have been ongoing for at least a decade, and the general public may be sufficiently exposed to different perspectives on the issue, even as they are unable or unwilling to adjust their individual beliefs and second-order beliefs.
Fifth, these descriptive findings suggest that, by inducing updated second-order beliefs, individual’s preferences to engage in or support climate policy action, may shift. In an experimental test, we find exactly this result. On average, exposing US individuals to information about the true distribution of Chinese beliefs increased support for a global climate treaty by 0.35 on our compliance scale which, while relatively small, was significantly different from zero. Nearly 40 per cent of the average treatment effect can be attributed to changes in second-order beliefs about Chinese compliance expectations. We thus find that there is a very strong mediation effect on the support for the climate accord as a function of treating a respondent’s second-order beliefs.
An extensive literature has documented the role of carbon-intensive actors in casting doubt on climate change scientific consensus and disseminating climate misinformation.Footnote 95 These efforts directly undermined belief in climate change and beliefs about the scientific consensus, reducing political incentives for climate policy action. However, our results suggest that they may also indirectly undermine support for action to the degree they shape public beliefs about the distribution of climate beliefs. The result of extant distributions of second-order climate beliefs is a reinforcement of existing political barriers to climate policy action. Thus, Geiger and Swim find that comfort in discussing climate change is a function of beliefs about the distribution of climate opinions; they find that individuals who underestimate the distribution of beliefs self-silence for fear of social sanctions.Footnote 96 Our findings would similarly suggest that the national publics in both the United States and China may under-engage with the issue of climate change relative to their true preference levels.
At the same time, when individuals hold beliefs about the general population that reinforce their personal views, this may lead them to ‘dig in’ to their positions by believing that many more people agree with them than is actually the case. Simultaneously, systematic underestimation of the fraction of the population holding pro-climate views may create obstacles to mobilization around the climate issue, since individuals don’t believe that others share their support for policy action. By depressing levels of support for climate policy action, biases in second-order climate beliefs thus stand as an underappreciated barrier to climate policy action. These beliefs may contribute to an erosion of any ‘community of fate’ that Keohane has argued is necessary to promote climate policy action.Footnote 97 Conversely, shifting second-order climate beliefs can increase public support for collective climate actions.
This research deepens our understanding of the political constraints on climate policy action by focusing on ‘second-order’ beliefs: beliefs that individuals have about the climate beliefs of others. However, our study also has implications for broader political behavior scholarship. Our findings extend an emerging literature that has highlighted pluralistic ignorance and biased second-order beliefs across a range of political science topics. Breaking from previous work that investigates second-order beliefs only amongst mass publics, we study the distribution of second-order climate beliefs across a full range of relevant political actors – including mass publics in China and the United States as well as political and intellectual elites in the United States. We also offer an examination for the first time of the content of second-order beliefs at a population level. Finally, our experimental demonstration of the effect of shifting second-order beliefs on willingness to engage collective climate action contrasts with previously unsuccessful efforts to experimentally investigate shifts in second-order beliefs.Footnote 98
Our findings are consistent with a growing literature in social and cognitive psychology that examines the processes through which individuals impute the beliefs of others. Scholars have variously found that individuals overestimate the degree to which broader populations agree with their own personal beliefsFootnote 99 ; assume that people who disagree with them have biased beliefsFootnote 100 ; believe there is more polarization between their own beliefs and the beliefs of others than is true in practiceFootnote 101 ; perceive greater polarization in the beliefs of others when they personally hold more extreme beliefsFootnote 102 ; assume that supporters and opponents on either side of a conflict are balanced in sizeFootnote 103 ; and use their own beliefs as a heuristic to estimate the beliefs of others.Footnote 104 Having shown in this article that the distribution of second-order climate beliefs are biased in ways that parallel this psychology scholarship, future research might examine the precise psychological mechanisms that shape second-order beliefs among a full range of political actors.
Future efforts to study second-order climate beliefs could benefit from even more sophisticated survey instruments that transcend some of our study’s limitations. Importantly, we ask survey respondents across all parts of this study to estimate agreement within a framework that treats agreement as a binary. In reality, we should expect that the certainty with which members of the public agree with particular policies or beliefs varies across target populations. It is unclear whether individuals actually make second-order belief judgments in this type of sophisticated fashion (particularly if they use the sort of anchor and adjust heuristic that such psychologists as NickersonFootnote 105 argue characterizes imputation process with respect to others’ belief states). Nonetheless, this is an empirical question that deserves further investigation. A related limitation acknowledges that there is also a distribution across the population in strength of agreement. Again, we still don’t know whether or how an individual incorporates judgments about strength of agreement into their second-order belief estimates and how these estimates of belief strength may shape the behavioral implications of second-order beliefs. A related opportunity for future research would be further experimental efforts to unpack how national publics react to information about the distribution of public opinion in foreign countries. While we show that such a treatment can shape willingness to support a climate policy, can it shape mass political behavior more broadly and/or strategic decision-making by political and intellectual elites?
We also think that our efforts to describe the content of second-order beliefs suggests new avenues for further research. In particular, common knowledge in the domain of rationales may be a promising starting point for future research on group political behaviors across issue domains. If the public does have a shared understanding of the arguments underlying different policy positions, scholars may be able to identify strategies to leverage this understanding into common support for policy action. In the climate case specifically, while recent research has focused on promoting knowledge about the existence of a scientific consensus on climate change,Footnote 106 efforts to facilitate greater awareness of the distribution of climate beliefs in the general public may also be a promising strategy to generate climate policy momentum.Footnote 107
Given the enormous literature investigating the distribution of first-order beliefs across global mass publics, we urge scholars to renew their efforts to also evaluate the distribution of content of second-order beliefs. Here, we succeed in documenting the distribution of second-order beliefs across a diverse range of political actors in a single issue domain. It is our hope that one contribution of this current article will be to facilitate efforts by political science scholars to more systematically collect data on, and evaluate, these critical links between second-order beliefs and political support across all policy domains where we see efforts to co-ordinate costly individual behaviors in the face of group-contingent benefits.