Implications
Quantifying the nutrient use efficiency in urban livestock enterprises is key for balancing nutrients supplied in feeds to animals’ requirements, leading to improved livestock productivity and consequently economic profitability of such enterprises. Our results provide strong evidence for inefficient nutrient use due to poor feeding strategies and inappropriate dung management in typical West African urban livestock systems. Since such wasting of nitrogen (N), phosphorus (P) and potassium (K) will lead to N volatilisation and groundwater pollution by nutrient leaching, environmental safety and human health might be at risk, which should be studied in more detail.
Introduction
In the past 40 years, the urban population of sub-Saharan West Africa has dramatically risen (Tiffen, Reference Tiffen2004), reaching an average urbanization rate of 36% in 2005 (UN-Habitat, 2007). This has spurred urban demand for food, mainly for cereals, pulses and livestock products (Tiffen, Reference Tiffen2004; Pistocchini et al., Reference Pistocchini, Stella, Belli, Cantafora, Turini, Zecchini and Crimella2009). In the region, urban livestock husbandry has become increasingly widespread as a source of food, income and employment, savings and as an insurance system (Fernández-Rivera et al., Reference Fernández-Rivera, Hiernaux, Williams, Turner, Schlecht, Salla, Ayantunde and Sangaré2005; Thys et al., Reference Thys, Oueadraogo, Speybroeck and Geerts2005; Ayantunde et al., Reference Ayantunde, Delfose, Fernández-Rivera, Gerard and Dan-Gomma2007). In Bamako, Mali, reportedly over 20 000 households keep livestock under urban conditions (Schiere and van der Hoek, Reference Schiere and van der Hoek2001), while in Ouagadougou, Burkina-Faso, 26% of the 1979 households interviewed by Thys et al. (Reference Thys, Oueadraogo, Speybroeck and Geerts2005) were livestock keepers; poultry were the most prevalent (59%), followed by sheep and goats (20%), pigs (8%) and cattle (7%). Similarly, in Niamey, Niger, 82% of 130 interviewed households kept animals, while 42% were involved in gardening and 58% cultivated millet fields (Graefe et al., Reference Graefe, Schlecht and Buerkert2008). Of the 106 households involved in animal husbandry, 51% kept cattle, 46% kept sheep, 31% kept goats and 15% kept donkeys (Graefe et al., Reference Graefe, Schlecht and Buerkert2008). Sheep and goats were mainly kept in the city centre, while cattle husbandry dominated at the outskirts. A recent livestock census estimated that Niamey’s livestock population comprises 36 577 head of cattle, 138 762 sheep and 75 300 goats (Ministère des Ressources Animales, 2005). These high livestock numbers translate into an important demand for livestock feeds that can not be supplied from the urban area alone but also relies on the rural surroundings (Guendel, Reference Guendel2002; Graefe et al., Reference Graefe, Schlecht and Buerkert2008); Araya et al. (Reference Araya, Ayalew, Werqu and HaileMariam2007) state that livestock keepers in larger towns recurrently face problems in obtaining sufficient feed and water for their animals. With an increased consumption of livestock products of Niamey’s rapidly growing population (Pistocchini et al., Reference Pistocchini, Stella, Belli, Cantafora, Turini, Zecchini and Crimella2009) and the hope to benefit from this demand, intensive supplementation systems have evolved among the urban and peri-urban livestock (ULP) farmers (Tiffen, Reference Tiffen2004). Animals are kept in small sheltered enclosures at the homestead and are fed crop residues and other available waste products (Fernández-Rivera et al., Reference Fernández-Rivera, Hiernaux, Williams, Turner, Schlecht, Salla, Ayantunde and Sangaré2005). Because of the limited availability of feeds especially in the dry season and its high cost (Urassa and Raphael, Reference Urassa and Raphael2004; Thys et al., Reference Thys, Oueadraogo, Speybroeck and Geerts2005) an efficient utilization of this resource is important (Sumberg, Reference Sumberg2002; Nkya et al., Reference Nkya, Kessy, Lyimo, Msangi, Turuka and Mtenga2007). Optimization of animal feeding strategies has been described as key factor governing the economic performance of animal husbandry (Oenema and Pietrzak, Reference Oenema and Pietrzak2002). Since intensive animal husbandry systems in the midst of an urban setting might lead to negative environmental externalities (Petersen et al., Reference Petersen, Sommer, Béline, Burton, Dach, Dourmad, Leip, Misselbrook, Nicholson, Poulsen, Provolo, Sørensen, Vinneras, Weiske, Bernal, Böhm, Juhász and Mihelic2007), manure management is also a major challenge (Thys et al., Reference Thys, Oueadraogo, Speybroeck and Geerts2005; Powell et al., Reference Powell, Li, Wu, Broderick and Holmes2008). Against this background, this study aimed at (i) investigating inflows and outflows of nitrogen (N), phosphorus (P) and potassium (K) through feeds offered and dung produced in differently managed livestock enterprises; (ii) assessing the effects of seasonal variations in nutrient offer on sheep/goat and cattle performances; and (iii) quantifying use efficiencies of offered nutrients in differently managed ULP enterprises in Niamey, the capital of Niger.
Material and methods
Study site and household selection
The study was carried out in Niamey, Niger, where the semi-arid Sahelian climate is characterized by three distinct seasons. The rainy season lasts from June to October, and the annual rainfall averages 577 mm (L’Hôte et al., Reference L’Hôte, Mahé, Somé and Triboulet2002). In the cool dry season (November to February), average daily temperatures range from 16°C to 32°C, while in the hot dry season (March to May) they vary from 27°C to 41°C. Urban and peri-urban agricultural activities are expanding within and around Niamey due to increasing urban demand for plant and livestock products (Belli et al., Reference Belli, Turini, Harouna, Garba, Pistocchini and Zecchini2008; Graefe et al., Reference Graefe, Schlecht and Buerkert2008).
Comprehensive nutrient management monitoring was conducted in 13 representative and differently managed livestock keeping households selected from 130 households characterised in a preceding study (Graefe et al., Reference Graefe, Schlecht and Buerkert2008). These households were surveyed during a period of 28 months (November 2005 to January 2008) to collect data on the different inputs and outputs in their livestock units. To determine the impact of management on nutrient use efficiency, households were classified as high- and low-input farms (HI and LI, respectively) based on the amount of total feed dry matter offered (TDMO) daily to the animals at the homestead. The average stock number per household varied from 1 to 10 in Zebu cattle and from 4 to 37 in sheep/goats, whereby more ruminant livestock were kept in LI than in HI enterprises (Table 1). Four out of the thirteen households combined indoor HI sheep/goat rearing (plus very sporadic grazing) with grazing plus stall feeding of LI cattle; four households managed LI cattle as well as LI sheep/goats; one and two households only kept cattle and sheep/goats, respectively, combining HI stall feeding with grazing, and another two households combined HI cattle rearing (stall feeding plus grazing) with LI sheep/goat management.
Characteristics of the investigated 13Footnote † urban livestock enterprises in Niamey, Niger

TLU = tropical livestock unit; TDMO = total dry matter offered.
† Several households combined sheep/goat and cattle units. Please refer to the text for detailed explanation of the repartition of units across the 13 households.
# One sheep/goat = 0.1 TLU, one cattle = 0.8 TLU.
* Twenty-eight months average.
** Strategy: ++ = grazing plus stall-feeding; −+ = little or no grazing, mainly or solely stall-feeding.
Forage supply and quality assessment
Every 4 to 6 weeks, the origin, type and quantity of feeds supplied at the homestead and the frequency of feeding (sometimes feeds were only offered every second day) were assessed in each of the 13 households by semi-structured interviews, accompanied by quantitative weighing of the daily feed offered using an electronic weighing scale (0 to 50 kg, accuracy 0.02 kg). The feeds supplied comprised roughages (R; crop residues and collected grasses) and some non-roughage supplements (NRSs), including brans or grains of millet, sorghum, maize, rice and wheat, as well as cottonseed cake. Feed samples (two per type of feed) were collected in each household every 6 weeks and were pooled per season and type of feed. Samples were analysed for their concentrations of dry matter (DM), organic matter (OM), N, P and K, digestible OM (DOM) and metabolizable energy (ME) using standard procedures (see below). The feed intake occurring during pasturing was not measured and thus not accounted for in the calculations of seasonal nutrient flows and nutrient balances (NBs).
Weight development and body condition scoring
All cattle, sheep and goats of each household were identified by a permanent number. Their live weight (LW) was determined every 6 weeks using a suspended weighing scale (0 to 100 kg, accuracy 0.5 kg) for small ruminants and calves up to 100 kg. For adult cattle, the body condition was scored according to Nicholson and Butterworth (Reference Nicholson and Butterworth1986) based on a 9-score scale. To convert the body condition scores (BCSs) into LW, a change of one point on the 9-score scale was assumed to equal a change of 24 kg (Nicholson and Sayers, Reference Nicholson and Sayers1987).
Quantification of dung produced
As far as dung (faeces plus urine plus organic material such as feed residues, straw bedding, etc.) is concerned, the amount produced in the 13 livestock rearing households was quantified by a complete weighing of the newly accumulated dung heap every month. Two representative fresh dung samples were collected per assessment date in each household and were pooled per season and type (dung from small ruminants and from cattle, respectively) to determine their concentration of DM, OM, N, P and K using standard procedures (see below).
Calculation of horizontal NBs and nutrient use efficiencies
To assess the resource use efficiency in the livestock sector, horizontal NBs, based on the measured offer of feed and dung, were calculated per metabolic body mass (LW, kg0.75) and day using equation
(1). Since only two out of the eleven cattle-keeping households occasionally milked their lactating cows, data on milk offtake were not included in the NB calculation.

We considered NB to be equilibrated if values were close to zero, while any major deviation of NB from zero indicated inefficiencies. To assess the efficiency of conversion of offered forage DM into LW gain (LWG) by small ruminants and cattle, the offered feed conversion ratio (OFCR; kg TDMO/kg LWG) was calculated.
Qualitative analyses of feed and manure samples
For chemical analyses all feed and dung samples were dried to constant weight at 65°C and ground to pass a 1-mm screen. DM concentration was determined by drying 5 g of air-dried sample material at 105°C for 5 h, and OM concentration was derived by subsequent ashing of the sample at 550°C for 4 h (Naumann et al., Reference Naumann, Bassler, Seibold and Barth2004). Total P was determined colorimetrically (Hitachi U-2000 spectrophotometer, Schwäbisch Gmünd, Germany) according to the vanadomolybdate method (Gericke and Kurmies, Reference Gericke and Kurmies1952) and total K was determined by flame emission photometry (Auto Cal 743, Diamond Diagnostics, Holliston, MA, USA). Total N was determined with an N-analyzer (Leco FP-328, Leco Corp. St Joseph, MI, USA) based on the thermal conductivity cell measurement. In vitro digestibility was derived from the gas production of the sample material incubated with rumen liquor for 24 h (Menke et al., Reference Menke, Raab, Salewski, Steingass, Fritz and Schneider1979). The concentration of DOM and of ME was calculated according to Close and Menke (Reference Close and Menke1986) and Menke and Steingass (Reference Menke and Steingass1987), respectively.
Statistical analysis
Residuals of all data were tested for normal distribution and homogeneity of variances before F-tests were performed using the general linear models (GLM) procedure of SAS 9.1 (Statistical Analysis Systems Institute, 2003). Independent variables were feeding intensity, season and year, while dependent variables comprised inputs and outputs of DM, N, P and K, as well as LW changes of animals. Correlation between herd size and amount of feed offered was tested using Spearman’s rank correlation coefficient. Means were separated by t-tests (LSD) at P = 0.05.
Results
Quality of feeds in urban livestock production
The four types of husbandry units differed in their practice of grazing; while stall-feeding was mostly combined with grazing in LI sheep/goats and in LI and HI cattle, it was prevailing in HI sheep/goats (Table 1).
During the cool dry season, the offered NRSs were dominated by millet, maize and wheat brans and pods from Faidherbia albida (Del.) A. Chev., while hay from cowpea (Vigna unguiculata Walp.) and the wild-growing legume Zornia glochidiata Reichb., groundnut (Arachis hypogea L.) haulm, millet stover and rice straw were the major offered R feeds. In the hot dry season, millet stover and collected grasses such as Schizachyrium exile Hochst. and Ctenium elegans Kunth. dominated the R fraction. During the rainy season, collected grasses (Aristida adscensionis L., Brachiaria deflexa Schumach. Launert, C. elegans Kunth.), as well as hay from cowpea and Z. glochidiata comprised the major R, whereas seed cake from cotton (Gossypium hirsutum L.), brans of wheat, sorghum and millet represented the major NRSs.
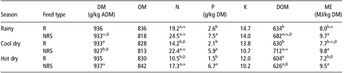
As there were no significant differences in the proximate composition of feeds between the two feeding intensities and the two species groups, respectively, further statistical analyses evaluated average values across the four distinguished livestock units. Due to the mentioned seasonal differences in the composition of R and NRS feeds, quality varied significantly between seasons and the two categories of feed. During the rainy season, N concentrations of R were significantly higher than those of R supplied during the cool dry and the hot dry season (P < 0.05). In contrast, N concentrations of NRS were similar across all seasons. In the cool dry season, the offered rations were dominated by supplements of highly DOM and high ME contents (Table 2). Concentrations of ME varied between 7.0 to 9.6 MJ ME/kg DM for R and 8.1 to 10.6 MJ ME/kg DM for NRS during the rainy season; between 6.0 to 9.8 MJ ME/kg DM for R and 7.7 to 10.7 for NRS during the cool dry season and between 6.4 to 8.1 MJ ME/kg DM for R and 8.7 to 10.3 MJ ME/kg DM NRS during the hot dry season. For a given feed category, the concentrations of P and K (Table 2) were similar across seasons (P > 0.05).
Proximate composition of feeds offered to sheep/goats and cattle raised in high- and low-input systems in Niamey, Niger, during the rainy, cool dry and hot dry seasons (2005 to 2008)

DM = dry matter; ADM = air dry matter; OM = organic matter; DOM = digestible organic matter; ME = metabolizable energy; R = roughages; NRS = non-roughage supplements.
Within seasons, different Roman letters indicate significant differences (P < 0.05) between different types of feeds; within one type of feed, different Greek letters indicate significant differences between seasons. Where no Roman or Greek letters are given, the respective differences are insignificant.
Feed offer and growth rate in small ruminants
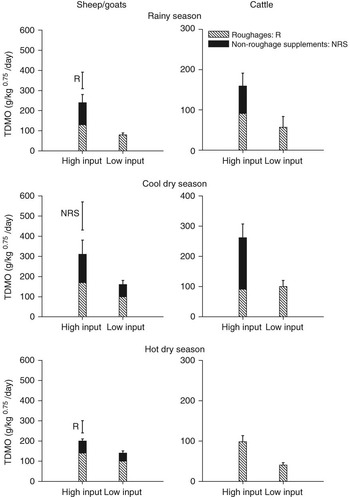
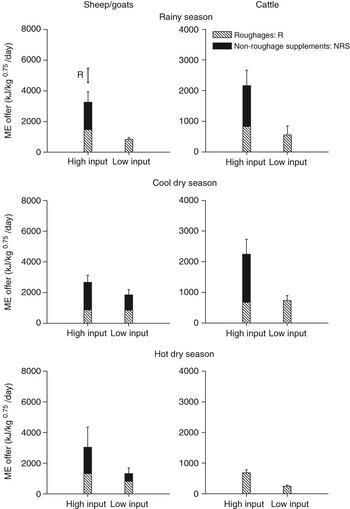
In all seasons, the amount of feed offered to sheep/goats differed significantly between HI and LI enterprises. During the rainy season, daily TDMO (all feed types included) in the HI sheep/goat system averaged 240 g/kg0.75 compared to 80 g/kg0.75 (P < 0.05, Figure 1) in the LI system with NRS contributing 46% to TDMO. In the HI system, Rs were offered at daily amounts providing 1470 kJ ME/kg0.75, which was about 1.8-fold higher than the value in the LI system (P < 0.05; Figure 2). The total daily offer of ME to HI sheep/goats amounted to 3261 kJ/kg0.75 compared to 837 kJ/kg0.75 in the LI system.
Mean (+1 s.e.) daily total feed dry matter offered (TDMO) to small ruminants and cattle during the rainy, cool dry and hot dry seasons in high- and low-input livestock management units in Niamey, Niger, during November 2005 to January 2008. The isolated vertical lines in the charts indicate the least significant difference (LSD0.05) of means for the two management systems. Please note the different scaling of y axes for sheep/goats v. cattle.

Mean (+1 s.e.) daily metabolizable energy (ME) offered to small ruminants and cattle during the rainy, cool dry and hot dry seasons in high- and low-input livestock management systems in Niamey, Niger, during November 2005 to January 2008. The isolated vertical lines in the charts indicate the least significant difference (LSD0.05) of means for the two management systems. Please note the different scaling of y axes for sheep/goats v. cattle.

During the cool dry season, daily TDMO offered to HI animals averaged 310 g/kg0.75 and was 50% higher than the values recorded in the rainy and the hot dry seasons. This trend was also observed in the LI units, where NRS accounted for 38% of the daily TDMO compared to that of 45% (P < 0.05) in the HI units (Figure 1). ME offer from NRS amounted to 1802 kJ ME/kg0.75 in HI compared to that of 984 kJ ME/kg0.75 (P > 0.05) in LI animals (Figure 2), and total daily energy offer averaged 2666 kJ ME/kg0.75 in the HI compared to that of 1839 kJ ME/kg0.75 in the LI units. In the hot dry season, daily TDMO to HI animals was similar to the rainy season values and the contribution of R significantly affected the daily offer of ME (Figure 2), which at 1318 kJ ME/kg0.75 was about 1.6-fold higher for HI than for LI sheep/goats.
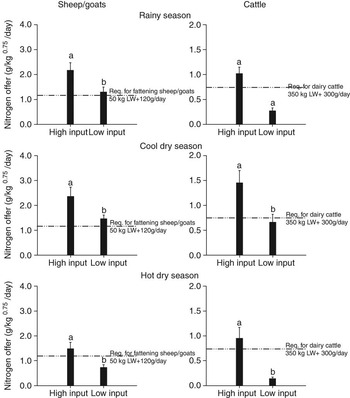
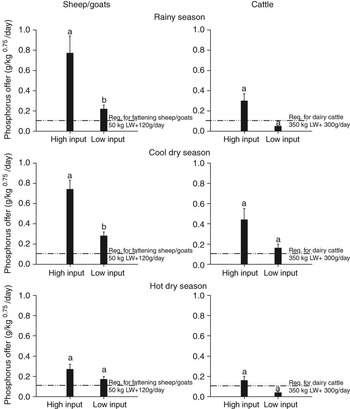
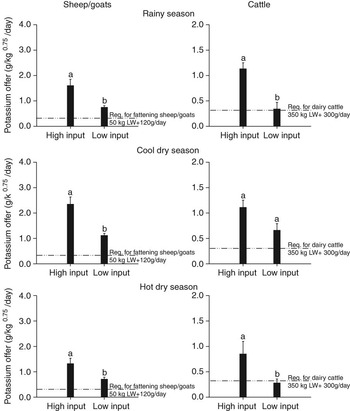
The daily offer of N in the cool dry season amounted to 2.4 g/kg0.75 in HI sheep/goats and was similar to the amounts offered in the rainy and the hot dry season (P > 0.05); these values were all significantly higher than the amounts of N offered to LI sheep/goats in the respective seasons (P < 0.05, Figure 3), and also exceeded the requirements for maintenance plus 120 g of daily LW gain of a 50 kg LW sheep (Table 3). Similar observations were made with respect to offers of P and K in the rainy and the cool dry season. In the hot dry season, however, differences in the amounts of K offered were significant between HI and LI sheep/goats (Figures 4 and 5).
Mean (+1 s.e.) daily N offered to small ruminants and cattle during the rainy, cool dry and hot dry seasons in high- and low-input livestock management systems in Niamey, Niger, during November 2005 to January 2008. Within the same season, different letters in charts indicate significant differences (P < 0.05) between the two management systems. Please note the different scaling of the y axes for sheep/goats v. cattle.

Daily dry matter (DM), metabolizable energy (ME) and nutrient requirements of fattening sheep/goats and dairy cattle

LW = live weight; NRC = National Research Council.
Mean (+1 s.e.) daily P offer to small ruminants and cattle during the rainy, cool dry and hot dry seasons in high- and low-input livestock management systems in Niamey, Niger, during November 2005 to January 2008. Within the same season, different letters in charts indicate significant differences (P < 0.05) between the two management systems.

Mean (+1 s.e.) daily K offered to small ruminants and cattle during the rainy, cool dry and hot dry seasons in high- and low-input livestock management systems in Niamey, Niger, during November 2005 to January 2008. Within the same season, different letters in charts indicate significant differences (P < 0.05) between the two management systems. Please note the different scaling of y axes for sheep/goats v. cattle.

At 104 g/day, the growth rate of HI sheep/goats in the cool dry season was higher than the 48 g/day (P < 0.05) of LI animals in the same season. During the hot dry and the rainy seasons, weight gains in HI animals were 86 and 53 g/day and exceeded those of LI animals by a factor of 1.2 and 2.4 (P > 0.05, Table 4), respectively.
Growth rate (g/day; means ± 1 s.e.) of sheep/goats and cattle kept under two different management systems in Niamey, Niger, during November 2005 to January 2008

CDS = cool dry season; HDS = hot dry season; RS = rainy season.
Within season and animal species, values with different letters differ at P < 0.05 between the two systems.
Feed offer and growth rate in cattle
During the rainy season, daily TDMO averaged 159 g/kg0.75 in HI cattle compared to 57 g/kg0.75 in the LI units (P > 0.05; Figure 1). The HI rations comprised 57% v. 100% R (P > 0.05) in the LI rations. During the cool dry season, daily TDMO averaged 261 g/kg0.75 in HI cattle and exceeded the offer recorded in the hot dry season (98 g/kg0.75); a similar trend was found in LI cattle. Regarding the offer of ME, differences between the two management systems were not significant, although higher amounts of NRS were offered to HI cattle (Figure 2). In the latter units, the supply of ME from NRS accounted for more than 50% of the total ME offer during the cool dry season and for 43% during the rainy season. Daily quantities of N offered to HI cattle averaged 1.5 g/kg0.75 in the cool dry, 1.0 g/kg0.75 in the rainy season and 0.9 g/kg0.75 in the hot dry season (P > 0.05); these amounts were greater (P < 0.05) than the amounts of N offered to LI cattle in the respective seasons (Figure 3). Similar trends were found with respect to the daily offer of P and K (Figures 4 and 5). Overall, TDMO, ME, N, P and K offered to HI cattle exceeded the animals’ respective requirements (Table 3) in the cool dry, the rainy and the hot dry seasons.
In HI cattle, the highest LWG was obtained during the cool dry season (121 g/day), while animals lost 79 g/day in the rainy season and gained 92 g/day in the hot dry season. Cattle raised under LI conditions, in contrast, showed positive weight gains in the cool dry (97 g/day; P > 0.05) and the rainy seasons (36 g/day; P > 0.05), but during the hot dry season average weight losses of 68 g/day were determined (P > 0.05; Table 4).
Feed conversion efficiencies and NBs
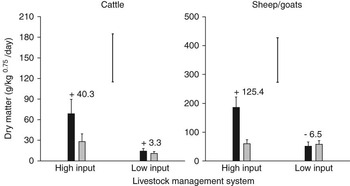
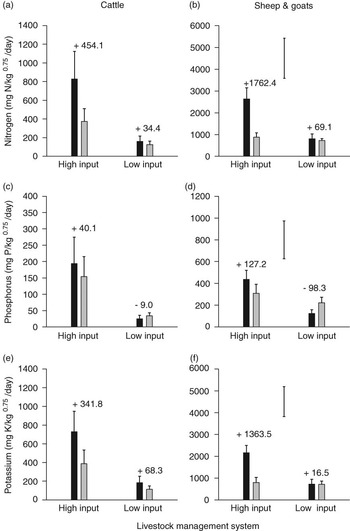
The efficiency with which offered forage DM was converted into LW differed between feeding intensities and seasons and between cattle and small ruminants. For farms where complete data records for 28 months were obtained (HI cattle: 5, LI cattle: 5, HI sheep/goats: 4, LI sheep/goats: 7), average OFCR ranged from 5.6 to 13.5 kg TDMO/kg LWG in cattle and from 3.5 to 16.4 kg TDMO/kg LWG in small ruminants (Table 5). Extreme individual values exceeded 32 kg TDMO/kg LWG in cattle and in sheep/goats and were independent of feeding intensity. For cattle, the calculated DM balances were positive irrespective of feeding intensity; for small ruminants DM balances were positive in the HI and negative in the LI units (Figure 6). For sheep/goats, daily balances of N, P and K were significantly higher in the HI than in the LI units (Figure 7b, d, f). In cattle no significant differences in the calculated NBs were observed between the two feeding intensities, although the surpluses in the HI units exceeded those of the LI units for all nutrients (Figure 7a, c, e). Overall, nutrient surpluses were higher in small ruminant holdings than in the cattle units.
Conversion of feed dry matter feed offered into live weight gain (kg TDMO/kg LWG; means ± 1 s.e.) by sheep/goats and cattle raised under two different management systems in Niamey, Niger, during November 2005 to January 2008

CDS = cool dry season; HDS = hot dry season; RS = rainy season.
No significant differences were found between seasons and management intensities for both species. Only farms with a complete 28-months data set were included. Sample sizes were for sheep/goats: n = 4 in high input and n = 7 in low input; for cattle: n = 5 in high input and n = 5 in low input.
Average daily dry matter balances (numbers) in high- and low-input cattle and sheep/goat systems in Niamey, Niger, during November 2005 to January 2008. Data show average daily offer of feed (black) and manure output (excreta plus litter, grey) plus 1 s.e. The isolated vertical lines in the charts indicate the least significant difference (LSD0.05) of means for the two management systems. Please note the different scaling of y axes for sheep/goats v. cattle.

Average daily input (black) and output (grey) of N (a and b), P (c and d) and K (e and f) through feed and manure in high- and low-input cattle and sheep/goat systems in Niamey, Niger, during November 2005 to January 2008. Bars show means + 1 s.e., numbers signify the balances. The isolated vertical lines in the charts indicate the least significant difference (LSD0.05) of means for the two management systems. Please note the different scaling of y axes.

Discussion
Feed and nutrient inputs
The analysis of current feeding practices in Niamey’s ULP indicates that considerable wastage of DM, N, P and K occurs in all livestock holdings and in all seasons, the only exception being LI cattle during the hot dry season. Resource wasting might be partly due to the small herd sizes, an assumption that is supported by weak, negative linear correlations obtained between the number of tropical livestock units (animal of 250 kg LW) per holding (X variable) and the amounts of DM, N, P and K offered (individual Y variables), with R2 ranging from 0.111 to 0.147 (P < 0.0001 for all correlations). Further variables explaining feed wasting might be the cheaper price of feed mainly during the cool dry season (on a per kg basis, collected grass hays: 3.1 to 21.8 euro cents; cowpea hay: 10.9 to 42.0 cents; maize bran: 9.2 to 15.3 cents; millet bran: 9.5 to 31.8 cents; Zornia hay: 3.8 to 32.7 cents). Although livestock feeds were expensive, especially during the hot dry and the rainy seasons (on per kg basis, collected grass hays: 2.9 to 41.8 euro cents; cowpea hay: 24.6 to 191.1 cents; maize bran: 9.2 to 22.3 cents; millet bran: 9.2 to 47.1 cents; Zornia hay: 12.2 to 76.2 cents) farmers seemed to have sufficient financial resources to buy even excessive amounts of feeds, since they were also engaged in urban vegetable gardening and trading, which are generating additional income (Graefe et al., Reference Graefe, Schlecht and Buerkert2008). Feed supply in excess of the animals’ requirements might also be due to suboptimal management conditions since large amounts of R feeds were mostly offered to groups of animals in narrow troughs, leading to high spillage through tearing feed out of the trough and trampling it onto the ground, from where it was shifted to the dung heap. Farmers’ lack of knowledge on the quality of offered feeds may in part explain the observed oversupply of nutrients. The high N and ME concentrations in the R fraction of the diet during the rainy season (Table 2) may be ascribed to high contents of protein and soluble carbohydrates of the then tillering grasses and herbaceous legumes. The high DOM concentration of NRS offered in the cool dry season is due to the abundance of freshly harvested millet grains that dominated the NRS fraction in the early months of the cool dry season.
The amounts of TDMO (Figure 1) exceeded values of DM intake reported in other studies: from an on-station experiment in Niger, Ayantunde et al. (Reference Ayantunde, Delfose, Fernández-Rivera, Gerard and Dan-Gomma2007) reported a daily DM intake of 62 g/kg0.75 for sheep fed groundnut haulms, while a daily intake of 93 to 98 g DM/kg0.75 was obtained for West African Dwarf goats fed different forage leaves plus concentrates (Ajayi et al., Reference Ajayi, Adeneye and Ajayi2005). From Mali, Sangaré and Pandey (Reference Sangaré and Pandey2000) reported a voluntary intake of 64 to 93 g DM/kg0.75 for Sahelian ‘Peul’ goats on dry season rangeland, and for lactating Alpine does the highest daily DM intake obtained was 181 g/kg0.75 (Sauvant et al., Reference Sauvant, Morand-Fehr and Giger-Riverdin1991). For cattle, an ad libitum DM intake of 120 to 150 g/kg0.75 per day was reported for unsupplemented animals grazing rainy season pasture in semi-arid Mali (Dicko et al., Reference Dicko, Lamboune, de Leeuw and de Haan1983; Sangaré, Reference Sangaré1985); in the same region Zebu cattle ingested 85 to 143 g/kg0.75 of OM per day in the dry season (Mahler, Reference Mahler1991; Schlecht et al., Reference Schlecht, Sangaré and Becker1999a; Rath, Reference Rath1999). Even during the hot dry season when grazing resources are scarce and expensive for urban farmers (Val-Arreola et al., Reference Val-Arreola, Kebreab, Mills, Wiggins and France2004; Heredia-Navan et al., Reference Heredia-Navan, Espinoza-Ortega, González-Esquivel and Arriaga-Jordán2007), the daily offer of ME (Figure 2) was high and exceeded the requirements of fattening sheep/goats (Table 3) at both feeding intensities; this was also observed in the other two seasons. Similarly, in HI cattle, the daily offer of energy exceeded the requirements (Table 3) of a 350 kg LW dairy cow gaining 300 g LW/day in all seasons (Figure 2). The same observation was made for LI cattle during the cool dry and the rainy seasons; here oversupply might have been due to then available high-quality supplement feeds. Graefe et al. (Reference Graefe, Schlecht and Buerkert2008) estimated an average energy intake of sheep and goats in Niamey’s ULP systems of 900 kJ ME/kg0.75 per day, which is much lower than the values obtained in this study. However, similar to our study, Graefe et al. (Reference Graefe, Schlecht and Buerkert2008) only assessed the amount of feed offered and not the animals’ actual intake; since their values are based on a 3-months survey only, they might not be extrapolated to an yearly time scale.
Growth performances
Despite the oversupply of DM, energy and nutrients in all seasons, the maximum growth rate (LWG) in sheep/goats was achieved during the cool dry season and averaged 104 g/day in HI animals. This performance is lower than the 120 g/day which, according to National Research Council (2006) data, should have been obtained under the observed feeding regimes, pointing again to inefficiencies in terms of nutrient management by the farmers and utilization by the animals. Feed conversion efficiency could be increased by adjusting the total amount of feed offered to the animals’ true needs of protein and energy. On the other hand, year-round growth rates of HI sheep/goats were higher than the 40 g/day reported for sheep fed groundnut haulms elsewhere in Niger (Ayantunde et al., Reference Ayantunde, Delfose, Fernández-Rivera, Gerard and Dan-Gomma2007), the 56 g/day obtained for Sahelian goats fed pods of Acacia senegal Willd in Northern Burkina Faso (Sanon et al., Reference Sanon, Kaboré-Zoungrana and Ledin2008) and the 63 g/day obtained in goats grazing dry season rangeland in semi-arid Mali (Sangaré and Pandey, Reference Sangaré and Pandey2000).
Concerning cattle, although amounts of DM, energy and nutrients offered in the HI units exceeded the requirements of dairy cattle in all seasons, daily weight gains were low in the rainy and the cool dry seasons, while cattle lost weight in the hot dry season. These results may indicate a poor health status – diarrhoea and coughing were observed in several cattle units – and, as already mentioned above, feed wasting. In LI cattle, TDMO and ME offers in the cool dry and the rainy seasons exceeded the requirements of a 350 kg dairy cow gaining 300 g of LW daily (Table 3), while N, P and K offers were below the respective requirements in the hot dry season only. In contrast to this, but in line with the observations in the HI cattle units, the growth rates of LI cattle determined during the cool dry and the rainy seasons were rather low and far below the 300 g/day that could have been obtained with the amounts of feeds offered at the farm. HI and LI cattle growth rates were thus lower than the 400 to 500 g/day reported for three Sahelian village cattle herds during the same seasons (Ayantunde et al., Reference Ayantunde, Fernández-Rivera, Hiernaux, van Keulen, Udo and Chanono2001; Fernández-Rivera et al., Reference Fernández-Rivera, Hiernaux, Williams, Turner, Schlecht, Salla, Ayantunde and Sangaré2005) and the 350 g/day obtained for grazing Mpwapwa Zebu cattle in Central Tanzania (Jung et al., Reference Jung, Yngvesson and Jensen2002). However, the daily weight losses of −68 to −79 g/day observed during the hot dry season in HI and LI cattle units were largely below the −300 to −400 g/day reported by Fernández-Rivera et al. (Reference Fernández-Rivera, Hiernaux, Williams, Turner, Schlecht, Salla, Ayantunde and Sangaré2005) from Niger. Weight losses in grazing animals are common in rural Sahelian cattle husbandry systems, mainly during the dry season and the transition period from the dry to the rainy season (Fernández-Rivera et al., Reference Fernández-Rivera, Hiernaux, Williams, Turner, Schlecht, Salla, Ayantunde and Sangaré2005), and Schlecht et al. (Reference Schlecht, Sangaré, Susenbeth and Becker1999b) reported body weight losses of up to 22% in non-supplemented cattle during the dry season. While the situation of urban LI cattle might have been quite similar to the situation of village cattle herds, given their large reliance on feed intake during pasturing, the weight loss of HI cattle especially during the hot dry season remains peculiar and might in part be due to inaccuracies in the conversion of BCSs to LW; this inconsistency might be linked to variations in the magnitude of LW change associated with each unit of BCS change as discussed by Jaurena et al. (Reference Jaurena, Moorby, Fisher and Cantet2005) and Berry et al. (Reference Berry, Macdonald, Penno and Roche2006).
Nutrient use efficiency
Efficient utilization of resources is an important economic component in livestock production systems whereby the efficiency of feed conversion is greatly influenced by DM intake, digestibility of feeds as well as production performance (Linn et al., Reference Linn, Raeth-Knight, Fredin and Bach2007). The rainy season OFCR of 9.5 kg TDMO/kg LWG obtained in HI sheep/goats compares well to the 7 to 8 kg DM/kg LWG reported by Bourzat et al. (Reference Bourzat, Bonkoungou, Richard and Sanfo1987) for intensively fed Mossi sheep in Burkina Faso. Likewise, in HI and LI cattle, the obtained cool dry and hot dry season values of 5.6 to 13.5 kg TDMO/kg LWG agree with the 9.8 to 14.9 kg DM/kg LWG reported for suckler cows in intensive stall-feeding system in Germany (Schellberg et al., Reference Schellberg, Lellmann and Kühbauch2006). Furthermore, they compare well to the 8.9 to 12.7 kg DM/kg LWG obtained in stall-fed Malawi Zebu (Munthali, Reference Munthali1986). Apart from these specific cases, the predominantly poor OFCR obtained across feeding intensities and species in our study point to large inefficiencies within the systems, corroborated by the predominantly low growth rates. At feeding, animals of different physiological stages and age groups are served together. This may lead to strong competition among animals and could affect the DM intake of younger or lighter individuals. The physiological reasons for the observed poor OFCR at high ME input are not fully understood, but might reflect the combined effect of large refusal rates and antinutritional properties of some feeds. The results of the current study corroborate previous findings of Diogo et al. (Reference Diogo, Buerkert and Schlecht2008), which indicate that the currently practiced fattening of sheep is inefficient beyond a LW of 40 kg and emphasize that ULP farmers need to reconsider fattening rations if sheep of higher LW should be produced for specific marketing occasions.
Today, appropriate nutrient management is of major concern in the highly professional production systems of Europe and America, due to high N surpluses originating from an oversupply of high-quality feeds (Kyllingsbæk and Hansen, Reference Kyllingsbæk and Hansen2007; Arriaga et al., Reference Arriaga, Pinto, Calsamiglia and Merino2009). In the case of Niamey’s ULP systems, the slightly to strongly positive NBs also point to considerable surpluses of inputs at both feeding intensities, whereby more nutrients were wasted in small ruminant than in cattle units. This is explained by the high amounts of protein and energy feeds offered to fattening small ruminants. The N balance obtained in HI cattle (+454.1 mg N/kg0.75/day) is much lower than that obtained for sheep/goats (+1762.4 mg N/kg0.75/day), but is higher than the 270.4 mg N/kg0.75/day calculated for Friesian–Ayrshire steers in smallholder farming systems in the central highlands of Kenya (Delve et al., Reference Delve, Cadisch, Tanner, Thorpe, Thorne and Giller2001). These nutrient surpluses could be reduced through a better feeding strategy: by partitioning the total amount of feed offered into two to three portions per day to reduce spillage (Jonker et al., Reference Jonker, Kohn and High2002; Rotz, Reference Rotz2004), by grouping animals according to age/weight and physiological status (St-Pierre and Thraen, Reference St-Pierre and Thraen1999) and by adjusting the daily supply of protein and energy to the animals’ requirements. Adjusting the offer of crude protein to animals’ requirements was reported to substantially improve N utilization efficiency of lactating dairy cattle in the Basque Country, Spain (Arriaga et al., Reference Arriaga, Pinto, Calsamiglia and Merino2009). Furthermore, feeding diets with high amounts of protein-binding tannins to minimize N excretion via urine and thus NH3 volatilization can effectively reduce N losses (Satter et al., Reference Satter, Klopfenstein and Erickson2002). In Niamey’s ULP, the poor feeding management is further aggravated by the poor management of nutrients that are diverted into the dung heap. Since many of the livestock keepers appeared to be also vegetable producers, the apparent oversupply of nutrients to livestock could benefit the vegetable production if the dung was managed in such a way that nutrient losses were avoided. However, dung is usually piling up in the courtyard without any cover and exposed to high temperatures during the hot dry season and to rainfall during the wet season. This management practice leads to substantial N losses through denitrification and NH3 volatilization (Predotova et al., Reference Predotova, Schlecht and Buerkert2009) especially if the manure was to be utilized in farmers’ home gardens and/or millet fields. Improved manure handling and storage by covering the dung heap with branches or plastic sheets could reduce nutrient losses (Rufino et al., Reference Rufino, Tittonell, van Wijk, Castellanos-Navarrete, Delve, De Ridder and Giller2007) in urban livestock production systems and thus reduce negative environmental externalities of such enterprises. Given that our study only determined the amount and quality of dung piling up uncovered in the courtyard, the monthly measuring interval has certainly lead to an underestimation of the nutrient excretion by livestock due to gaseous and eventual leaching losses occurring between excreta deposit and dung measurement. From a dung storage experiment in urban gardens of Niamey, Predotova et al. (Reference Predotova, Schlecht and Buerkert2009) reported gaseous N-losses to be highest during the hot dry season, which amounted to 1.1 mg/kg/day DM manure and leaching of 0.5 mg N/kg DM/day, 0.7 mg P/kg DM/day DM and 17.1 mg K/kg DM/day during the rainy season when the manure is uncovered. Since the livestock farmers did not agree to use marker substances or faecal collection bags to determine feed intake and faecal excretion during grazing and at the homestead, nutrient inflow to the animal units through feed intake at pasture could not be accounted for in the calculation of NBs, although it might have been important. Likewise, the amount of nutrients excreted in faeces and urine during grazing was also unknown; however, at a digestibility of the bush hay and millet stover of 46.1% and 43.3%, these losses should not have exceeded 2.8% of the respective intake from pasture.
The high N and P surpluses in livestock units determined in Niamey might potentially affect air quality through NH3, N2O and NOx emissions and pollute ground and surface waters through NO3−, NH4+ and PO43− leaching losses; such threats may also occur in other Sahelian cities where similar systems are found (Thys et al., Reference Thys, Oueadraogo, Speybroeck and Geerts2005). In contrast to this, small ruminant production has a reportedly low impact on air quality in Central Java, Indonesia, due to low-protein diets on offer in this region (Budisatria et al., Reference Budisatria, Udo, van der Zijpp, Murti and Baliarti2007). However, the latter authors reported severe groundwater contamination with manganese, faecal and coliform bacteria, which might also deserve attention in Niamey’s ULP, since environmental problems are normally aggravating as the number of animals kept and the level of concentrate inputs increase.
Conclusions
The present results indicated that urban livestock enterprises in Niamey are characterised by an oversupply of nutrients to cattle and sheep/goats, which is due to poor feeding management and results in inefficient nutrient use. This might be financially disadvantageous for the farmers, especially in periods of feed scarcity (rainy and hot dry seasons). The low growth performance of small ruminants and cattle and the quasi-absent milk extraction underline the need for improved feeding management in West Africa’s urban livestock husbandry systems, which must be based on the nutrient requirements of specific age/weight and production groups. For animals that are grazing at the city fringes during daytime, a reduction of the amount of feed offered at the homestead, especially during periods of high feed availability on pastures (cool dry season) is recommended. By doing so, more feed nutrients should be converted into LWG and milk, and fewer nutrients will be diverted to the dung heap, be it by excretion or by feed spillage and conversion into litter. Since most of the presently observed oversupply of feed N, P and K ends up in the dung heap, there is substantial risk for environmental pollution, and livestock farmers should therefore also improve manure handling and storage.
Acknowledgements
We are indebted to Niamey’s ULP farmers for their patience and collaboration, and to Dr A Ayantunde and Mr M Diolombi (ICRISAT Sahelian Centre, Niamey, Niger) for scientific advice and logistic support. We also thank the staff of the International Livestock Research Institute (ILRI, Sahelian Centre) for their valuable support and Deutsche Forschungsgemeinschaft (DFG) for funding (BU 1308).