When dealing with regurgitant atrioventricular and arterial valves due to rheumatic disease, the optimal timing for surgical intervention remains problematic. The criterions for intervention are not established, although various parameters have traditionally been used. These include the presence of symptoms, exercise intolerance, echocardiographic parameters such as ejection fraction, left ventricular end-diastolic, end-systolic dimensions, myocardial fibre shortening velocity,1–9 and indexes of myocardial tissue Doppler velocities.3 The problem with the majority of these criterions is that they are dependent on preload. Thus, the effect of volume overload on myocardial contractility cannot adequately be determined. In fact, the reason for selecting these parameters is that various studies have reported data on surgical outcomes, such as rate of mortality or reduction of dimensions of the left ventricle after surgical interventions. Furthermore, these studies are not based on myocardial factors or the pathophysiology of chronic volume overload of the left ventricle. Some recent studies have highlighted the shortcomings of adhering to the recommended criterions of left ventricular dimensions when contemplating surgical intervention.8, 10 It should also be noted that, because of the variability in the body size, indexes of echocardiographic dimensions are not directly applicable in children.9
Chronic volume overloading of the left ventricle is common in the setting of mitral and aortic regurgitation. Mitral regurgitation frequently occurs as a result of chronic rheumatic carditis, and is common in developing countries, whilst non-rheumatic valvar regurgitation is common in developed countries, in which rheumatic fever has virtually disappeared. In the developing countries, nonetheless, chronic rheumatic carditis continues to be one of the commonest causes of cardiac morbidity in adolescents. Patients with mild to moderate valvar regurgitation may remain asymptomatic for many years, whilst those patients with moderate to severe regurgitation will eventually require surgical intervention.
Parameters have previously been suggested with which to evaluate the appropriateness of using the thickness of the left ventricular wall as an indicator of chronic volume overload of the left ventricle. These include the ratio of left ventricular mass to diastolic volume, and the ratio of end-diastolic left ventricular wall thickness to diastolic left ventricular radius.11–15 Grossman et al.13 postulated that volume overload of the left ventricle, resulting in dilation of the left ventricle, increases the stress in the left ventricular wall, which in turn initiates left ventricular hypertrophy, with subsequent normalisation of the mural stress. In the setting of a decompensated left ventricle with chronic volume overload, several investigators11, 12, 14, 15 have shown that an inadequate ratio of left ventricular wall thickness to ventricular radius is a marker. Amongst these investigators, some11, 12 have postulated that, if the variability of the ratio of the left ventricular wall thickness to radius was in a narrow range, then the appropriateness of left ventricular hypertrophy could be defined in terms of relationship between the ratio of the wall thickness to radius and the peak left ventricular or systemic blood pressure. They suggested that hypertrophy of the left ventricle would be considered appropriate or normal if the ratio was within the expected limits assessed relative to systolic blood pressure or left ventricular pressure, inadequate when the ratio was below the lower limits of normality, and inappropriate when the ratio was beyond the upper limits.
The appropriateness of left ventricular hypertrophy in response to overloads such as physiologic growth, exercise, pathologically increased pressure or volume overload, however, can only be determined if the normal limits are known for the ratio of wall thickness to radius measured as half of the diastolic dimension ratio, together with its relationships to systolic blood pressure or peak left ventricular pressure. By using the mean of the diastolic thickness of the septum and the diastolic thickness of the posterior wall of the left ventricle, and dividing this value with the left ventricular diastolic radius as measured by M-mode echocardiography, we have previously defined and reported these relationships in normal neonates, normal children, and those children with compensated aortic stenosis. We found this relationship to be linear over a wide range of left ventricular pressures, with narrow limits around the regression.16–18
I now hypothesise that decompensation of the left ventricle in the setting of chronic volume overload may be defined in terms of the relationship of the ratio of left ventricular wall thickness to left ventricular radius to left ventricular or systolic blood pressures, and that the onset of decompensation may be detected when this ratio, the normalized mural thickness, is inadequate, falling below the limits of normality. The purpose of this study, therefore, was to determine the relationships between the ratio of left ventricular wall thickness to left ventricular radius to systolic blood pressure or peak left ventricular pressure in normal children and in children with compensated aortic stenosis. By using these limits of normality, I hoped to determine those values of the ratio of left ventricular wall thickness to left ventricular radius which were associated with an asymptomatic state, those associated with left ventricular compensation, and those in which a symptomatic state with cardiac failure reflected decompensation of chronically volume overloaded left ventricle.
Population and methods
I determined the ratio of the left ventricular wall thickness to left ventricular radius, and its relationship to either systolic blood pressure or peak left ventricular pressure, by using the data obtained from 89 normal school children aged from 5 to 17 years with normal hearts, and with systolic blood pressures ranging from 90 to 130, with a mean of 104.5 plus or minus 8.94 millimetres of mercury. I compared these values with the previously reported data from 36 children, aged 11.5 plus or minus 4.2 years, with compensated aortic stenosis and left ventricular pressures ranging from 80 to 230 millimetres of mercury as recorded at cardiac catheterization.18 The data for the normal school children was collected prospectively from schools in Karachi, Pakistan. In these children, two readings of blood pressure were taken simultaneously as M-mode echocardiography was performed. At least three cycles of M-mode left ventricular echocardiograms were studied, and an average of the readings was used. A detailed echocardiographic and colour-flow Doppler study was performed to exclude cardiac disease in the normal children.
The population used to test whether the limits of the ratio of left ventricular wall thickness as related to the appropriate systolic blood pressure can be used to determine its adequacy as an index of decompensation included 40 children, 30 with acute myocarditis and congestive heart failure having an ejection fraction of 28.5 plus or minus 10.3 percent, the children having normal blood pressures of less than 120, with a mean of 94.5 plus or minus 9.5 millimetres of mercury. I also studied 10 children with aortic valvar stenosis and elevated left ventricular peak pressures. The mean age of the children with myocarditis was 4.6 plus or minus 2.8 years, and those with aortic stenosis was 7.5 plus or minus 3.4 years. The echocardiograms and systolic blood pressure of these children were either obtained prospectively, or for the children with aortic stenosis, within 24 hours before or after cardiac catheterization.
Population with left ventricular volume overload
For this population, I included 111 children, 38 studied prospectively, and 73 collected retrospectively. Of these, 93 children, 30 studied prospectively and 73 retrospectively, had mitral regurgitation and systolic blood pressures of 104 plus or minus 8.57 millimetres of mercury. An additional 18 children, 8 studied prospectively and 10 retrospectively, had aortic regurgitation with systolic blood pressures of 107 plus or minus 14.1 millimetres of mercury. Valvar regurgitation in all was assessed clinically and by echocardiography, being graded as mild in 18, moderate in 39, and severe in 54.
The mean age of the 93 patients with mitral regurgitation was 11.3 plus or minus 3.4 years, and the mean weight was 25.9 plus or minus 9.3 kilograms, and of 18 children with aortic regurgitation was 11.4 plus or minus 2.3 years and weight of 30.1 plus or minus 9.8 kilograms, respectively.
The clinical state, including systolic blood pressure and echocardiograms, were assessed simultaneously in all patients studied prospectively, while data for echocardiographic studies and assessment of blood pressure was taken for the same admission, and at the previous and last outpatient visits when reviewing charts.
Follow-up data was available in 39 children, accounting for 28.9 percent of those prospectively studied, and 38.4 percent of those studied retrospectively. Of these children, 28 had mitral and 11 had aortic regurgitation. The echocardiograms used to determine the ratio of left ventricular wall thickness to radius, and the data relating to systolic blood pressure, were collected retrospectively from the hospital charts from all previous outpatient visits
Technique for measurement
The same operator used similar methodology for the prospective echocardiographic studies as for those previously performed. Left ventricular M-mode echocardiograms were obtained at the tips of the leaflets of the mitral valve, all measurements being made at this site in the left ventricle.16, 18 The left ventricular end-diastolic dimension was measured between the leading edges of the septal endocardium and the endocardium of the posterior wall, using the top of the QRS complex on the echocardiogram. The end-systolic dimension was taken as the shortest distance between the endocardial borders. The thicknesses of the posterior wall and the septum were measured in diastole, using an average of three measurements. The thickness of the posterior wall was taken from the leading edge of the endocardium to the interphase of the myocardial to epicardial transition, excluding the thick pericardial echo from the measurement. The septal thickness was measured between the leading edges of the left and right ventricular endocardial surfaces. By using the average of end-diastolic septal and posterior wall thicknesses, and half of the left ventricular end-diastolic dimension to provide the radius, it was possible to calculate the ratio between the diastolic thickness of the left ventricular wall and the left ventricular radius, previously referred to as “h/r ratio”, and relative wall thickness (Fig. 1).

Figure 1. M-mode left ventricular (LV) echocardiogram obtained at the tip of the leaflets of the mitral valve. Diastolic septal (S) and posterior wall (PW) thicknesses and dimensions (DD) were measured at the time of top of R wave of the ECG. Systolic dimension (DS) is the minimum distance between the walls. RV: right ventricle.
Statistical methodology
Linear regression analysis was performed, taking correlation coefficients, standard errors of the regression, and drawing 95th percentile confidence limits as well as 95th percentile confidence bands around the regression line for future predictions. Mean and standard deviations were calculated for the various collections of data. Comparison of the means was done by using the two-tail Student's t-test, using a probability value of less than 0.05 as statistically significant. The Statistica 5.0 computer software was used for statistical analysis.
Results
The regression analysis of the ratio of the left ventricular wall thickness to left ventricular radius, and its relationship to the left ventricular systolic pressure or systolic blood pressure relationship, proved to be linear, both in the 89 normal school children, and in the 36 children with compensated aortic valvar stenosis. The correlation coefficient was calculated at 0.86, and a standard error was found of 0.049, so that the ratio of the wall thickness to radius was equal to 0.10105 plus 0.0025 multiplied by systolic blood pressure or left ventricular pressure. Using this data, it was possible to draw the 95th confidence limits and 95th percentile confidence bands for future predictions (Fig. 2). Using the same data, it was also possible to calculate the mean and standard deviations of the ratio for various ranges of systolic blood pressures or peak left ventricular pressures (Table 1).

Figure 2. Regression plot and 95th percentile limits and 95th percentile bands, solid lines, of the ratio of left ventricular wall thickness to radius (h/r ratio) and the systolic blood pressure of peak left ventricular pressure in millimetre mercury (mmHg).
Table 1. Appropriate ratios of left ventricular wall thickness to radius (h/r ratio) for ranges of systolic blood pressure (SBP) or left ventricular peak pressure in normal school children and children with compensated aortic stenosis and elevated left ventricular pressure.

The validity of the developed limits of normality for the ratio was tested in 30 children with myocarditis by using the ratio of 0.356 plus or minus 0.0316, this being appropriate for systolic blood pressure of less than 120, with a mean of 95.5 plus or minus 9.5 millimetres of mercury, as the normal cut off limit (Table 1). When using this value, all but one of the 30 children with decompensated left ventricles had inadequate ratios below minus 0.3, which is below minus two standard deviations of the normal limits used. When analysing 31 sets of follow-up data from these children, the relationship between the ratio of left ventricular wall thickness to radius and ejection fraction was found to be linear, with a correlation coefficient of 0.649, suggesting that the ratio of left ventricular wall thickness to left ventricular radius did indeed reflect the systolic function of the left ventricle. This finding also suggested that improvement in function was associated with improved clinical state.
The data from 10 children with elevated left ventricular peak pressures was then plotted on the regression plot of normality for the relationship between the ratio and blood pressures or left ventricular pressures. This showed that 7 asymptomatic children, with ejection fractions of 81 plus or minus 6.7 percent, had adequate ratios within the 95th percentile limits, but that 3 children with left ventricular decompensation, and ejection fractions of 25 percent plus or minus 11 percent had inadequate ratios, below the 95th percentile limits (Fig. 3).

Figure 3. The ratio of left ventricular wall thickness to radius (h/r) plotted against left ventricular peak pressure, in millimetres of mercury, in 10 children with aortic valvar stenosis. Solid lines represent 95th percentile confidence limits. In 3 children with left ventricular decompensation, the ratios were below the lower 95th percentile limits, and in 7 asymptomatic children the ratios were within the 95th percentile limits.
Evaluation of the appropriateness of the ratio, the normalized wall thickness, as a means of assessing the effects of chronic volume overload due to isolated aortic and mitral valvar regurgitation.
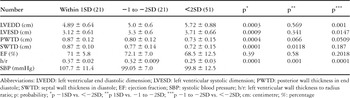
Since the 93 children with chronic volume overload due to mitral regurgitation had mean systolic pressures of 101 plus or minus 11.6 millimetres of mercury, which was not statistically significant from 104 plus or minus 8.6 (p equal to 0.09), I used limits of 0.356 plus or minus 0.0316, appropriate for the systolic blood pressure, as the cut-off (Table 1). Within the limits, of the 93 children with mitral regurgitation, 21 (22.5 percent) had an adequate ratio, within one standard deviation of normal limits, and all were asymptomatic. An additional 51 (54.8 percent) of the children were found to have inadequate ratios falling below minus two standard deviations, and all were symptomatic with congestive cardiac failure. A further quantum of 21 (22.5 percent) children had ratios between minus 1 and minus 2 standard deviations from the cut-off. Of these, 12 (57.1 percent) were asymptomatic, 8 (38.1 percent) had symptoms consistent with the second and third classes of the system devised by the New York Heart Association, while 1 patient (4.8 percent) had congestive cardiac failure (Table 2).
Table 2. Echocardiographic parameters in 93 children with mitral regurgitation.

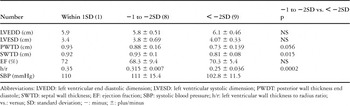
The systolic blood pressure in 18 children with aortic regurgitation was 107 plus or minus 14.1 millimetre of mercury, not significantly different from 104 plus or minus 8.57 millimetre of mercury, so that the normal ratio for these blood pressures of 0.356 plus or minus 0.0316 was used as the cut-off limit (Table 1). Of these 18 children, 8 evaluated prospectively and 10 retrospectively, only one (5.6 percent) had a ratio of wall thickness to radius falling within the range of 1 standard deviation, and hence considered adequate. This patient was asymptomatic. Of the others, 8 (44.4 percent) had the ratio between minus 1 and minus 2 standard deviations, and 5 (62.5) of these had congestive cardiac failure, 2 (25 percent) were symptomatic in the second and third classes of the system of the New York Heart Association, and the other was asymptomatic. The remaining 9 (50 percent) all had ratios of more than minus 2 standard deviations, hence deemed inadequate, and all were symptomatic (Table 3).
Table 3. Echocardiographic parameters in 18 children with aortic regurgitation (AR).

Comparisons of variables in the patients with mitral regurgitation having ratios within 1 standard deviation as opposed to less than minus 2 standard deviations showed that the both the end-systolic and end-diastolic left ventricular were larger (p less than 0.0003, 0.0004), and diastolic and systolic thicknesses of the posterior wall were thinner (p less than 0.0004, 0.0001). In addition, the ratio of left ventricular wall thickness to radius was significantly lower (p less than 0.0001), whilst the ejection fraction was not significantly different. Comparing the patients within one standard deviation with those falling between minus 1 and minus 2 standard deviations, the left ventricular end diastolic dimension was not significantly different, but the diastolic systolic wall thickness was significantly lower in those further from the norm (p equal to 0.011), as was the ratio of left ventricular wall thickness to radius, but the ejection fraction was not significantly different (Table 2). When comparing values for children with aortic regurgitation and a ratio of wall thickness to radius within minus 1 to minus 2 standard deviations with those having a ratio of less than 2 standard deviations, those with the intermediate values showed significantly lower thicknesses for the posterior wall and the septum, as well as a lower ratio.
Follow-up data from review of charts was available in 39 of the 111 children, 28 of these having mitral regurgitation and 11 with aortic regurgitation. The follow-up showed that 16 of the children had had ratios deemed adequate at the initial evaluation, being within one standard deviation of the mural thickness considered appropriate for normal systolic blood pressures (Table 1). In 7 of these, the initially adequate ratio, of 0.37 plus or minus 0.032, decreased to less than minus 2 standard deviations to 0.27 plus or minus 0.02 after a follow-up period of 30.3 plus or minus 29 months. In 8, the ratio of 0.37 plus or minus 0.02 remained within 1 standard deviation, at a value of 0.37 plus or minus 0.04, after a mean follow-up of 15.1 plus or minus 9.1 months. In 1 child, the ratio of 0.35 decreased to between minus 1 and minus 2 standard deviations, reaching a value of 0.31 during the follow-up. Of the 9 children with initial ratios falling between minus 1 and minus 2 standard deviations, in 6 (66.6 percent), the ratio then decreased from 0.31 plus or minus 0.005 to less than minus 2 standard deviations, reaching a value of 0.27 plus or minus 0.02 over a follow-up of 30.2 plus or minus 35.7 months. These patients became symptomatic. In 3 (33.3 percent) patients, the ratio remained unchanged after 7.7 plus or minus 4.86 months of follow-up. In 14 children, the initial ratio of less than minus 2 standard deviations, with a mean value of 0.24 plus or minus 0.04, remained unchanged after a period of 19.7 plus or minus 14.4 months.
The review showed that 16 children, 4 studied prospectively and 12 retrospectively, had undergone replacement of the aortic or mitral valves. The ratio in all of these was less than minus 2 standard deviations from the cut-off value, at a mean of 0.25 plus or minus 0.03, and at the time of valvar replacement, all the children were in left ventricular failure.
Discussion
I suggest that my study is of clinical value because it has permitted me to define the 95th percentile confidence limits for the ratio of left ventricular wall thickness to left ventricular radius and its relation to systolic blood pressures and left ventricular pressures by using the prospective data of normal school children having a normal range of blood pressure and our previously published data from asymptomatic children with aortic stenosis and elevated left ventricular systolic pressures. The data used previously for similar regression analyses may have been biased it included children with mild pulmonary valvar stenosis or small atrial septal defects in the so-called “normal group”.18 Furthermore, I also calculated the mean ratio of wall thickness for various ranges of systolic blood pressure and left ventricular pressure ranging from 80 to 223 millimetres of mercury, permitting me to use either set of values to evaluate adequacy of a given ratio depending upon the demands of accuracy.
The regression analysis showed that the ratio of wall thickness to radius, the normalized wall thickness, increased in a predictable manner with increasing left ventricular pressure. Thus, for any given left ventricular pressure, there is an appropriate range of the ratio for wall thickness, and the limits of this range are sufficiently narrow, I suggest, to be clinically useful. Interestingly, comparison of previously published regression equations18 with my own reveals no significant difference. Reichek et al.,19 using a model similar to mine, have shown that these relationships between the ratio of wall thickness to radius and systolic blood pressure are valid for normal adults, as well as those with aortic stenosis, and that the ratio could be used for predicting the hypertensive levels of blood pressure. This ratio is referred to as relative wall thickness in studies in adults. The reported ratios in normal adults are not different from the ones we reported for similar systolic blood pressures in children, because the ratio is independent of age, instead being dependent upon the left ventricular or systolic blood pressures.19, 20
The law of Laplace explains how the heart is constructed and grows. In life, the ratio of wall thickness to radius and its relationship to the left ventricular pressure, is maintained, keeping mural stress within a constant range. Since this relationship is valid for all ages, and over a wide range of left ventricular pressures, with a narrow scatter around the regression, the thickness of the left ventricular muscle can be defined in the terms of the ratio of the thickness to the radius to its appropriate left ventricular or systolic blood pressure. The hypertrophy is considered appropriate when the ratio, the normalized wall thickness, is itself appropriate for the left ventricular or systolic blood pressure. It is inappropriate or excessive when the ratio is greater than appropriate for the corresponding left ventricular or systolic blood pressure, and inadequate when the ratio is less than required for the corresponding left ventricular or systolic blood pressure. I have tested the validity of the limits for normality derived from my regression analysis, and I was able to detect ratios deemed inadequate by my calculations in children with myocarditis, and in those with aortic stenosis who had left ventricular decompensation. My study has shown that, in the setting of chronic left ventricular volume overload, the ratio was less than minus 2 standard deviations, in other words less than 0.3, in those patients who had decompensation of the left ventricle associated with congestive cardiac failure, but was within one standard deviation, in other words greater than minus 0.33, in those who had no symptoms and were compensated. In children with mitral regurgitation, when the ratio was within minus 1 to minus 2 standard deviations of normal, almost three-fifths were asymptomatic, while only almost two-fifths were symptomatic, falling in the second and third functional classes of the system devised by the New York Heart Association, and not in left ventricular failure. Only one patient had left ventricular failure. In the children with aortic regurgitation and with ratios between minus 1 and minus 2 standard deviations from the normal, only one-eighth were without symptoms. Thus when the ratio decreases to less than one standard deviation from the normal, there is a need for careful assessment of the symptoms. Repeated measurement of the ratio is warranted, because all children with a ratio less than minus two standard deviations from the norm had left ventricular failure.
The follow-up studies showed that decompensation and development of symptoms could be detected by following the decreasing nature of normalized wall thickness over time, thus permitting one potentially to select the optimal time for intervention. My interpretation of the findings is that asymptomatic children with a ratio within one standard deviation should have the test repeated every 6 months. Should the ratio decrease consistently, intervention should not be delayed even if the child is asymptomatic. The ratio should not be permitted to fall below 0.3, because falls below this level lead to decompensation, and irreversible changes in the left ventricular myocardium. A comparable study of adults with aortic insufficiency suggested that an inadequate ratio is an indicator of such irreversible changes in the left ventricular myocardium.21
This concept of using normalized wall thickness, calculated as the ratio of left ventricular wall thickness to ventricular radius, as a measure of left ventricular compensation following volume overloading of the ventricle, therefore, is based on physical laws and known knowledge of left ventricular myocardial physiology. It has the advantage that the ratio can be measured readily and repeatedly. Precise measurements, however, are crucial, but will be facilitated by new computer-generated digital imaging and techniques for endocardial enhancement.
In conclusion, I would suggest that the limits for normality of the relationship between left ventricular wall thickness and radius ratio and either the systolic blood pressure or left ventricular pressure are narrow, and can be used in clinical setting to define adequate, inadequate, and inappropriate thicknesses of the ventricular wall. Thus, in children with aortic or mitral regurgitation and chronic left ventricle volume overload, the index of normalized wall thickness, defined as the ratio of wall thickness to its radius, can be used as a new criterion with which to determine the optimal time of surgical intervention.
Acknowledgements
I acknowledge the contribution of Dr. Nasreen Fatima Zaidi, who obtained the demographic, echocardiographic, and blood pressure data for the normal school children.