1. Introduction
Narratives are higher-level forms of language production that constitute connected sets of utterances, beyond the sentence level. We use narratives to communicate with other people about ourselves and to understand other people's points of view and actions (Beals & Snow, Reference Beals and Snow2002; Howard, Mayeux & Naigles, Reference Howard, Mayeux and Naigles2008; Peterson & McCabe, Reference Peterson and McCabe1983). Narrative development involves an extended time period from pre-school to later childhood and into adolescence (e.g., Nippold, Frantz-Kaspar, Cramond, Kirk, Hayward-Mayhew & Mackinnon, Reference Nippold, Frantz-Kaspar, Cramond, Kirk, Hayward-Mayhew and Mackinnon2013). The reason for this long period of development is that mature narrative ability requires the integration of linguistic, cognitive and social capacities (Norbury, Gemmell & Paul, Reference Norbury, Gemmell and Paul2014). This integration allows children to not only fully develop all the required linguistic forms of their language, but also a variety of discourse functions within these forms. Narrative ability is crucial for developing social skills (Miller, Reference Miller1994) and has been shown to predict later literacy skills (Griffin, Hemphill, Camp & Wolf, Reference Griffin, Hemphill, Camp and Wolf2004; Roth, Speece & Cooper, Reference Roth, Speece and Cooper2002); as such, it is important to understand the full developmental pathway of narrative within its specific language acquisition context. While narrative development has been extensively described for English (Beals & Snow, Reference Beals and Snow2002; Karmiloff-Smith, Reference Karmiloff-Smith, Fletcher and Garman1986; Labov & Waletzky, Reference Labov, Waletzky and Helm1967; Pearson & de Villiers, Reference Pearson and de Villiers2006; Peterson & McCabe, Reference Peterson and McCabe1983; Trabasso & Stein, Reference Trabasso, Stein, Haith and Benson1994) and some other languages (e.g., the cross-linguistic comparisons carried out by Berman & Slobin, Reference Berman and Slobin1994) there has been no previous study documenting narrative development in children acquiring Catalan.
Catalan is a Romance language derived from Latin and named after the medieval Principality of Catalonia, in north-eastern modern Spain. The language area stretches across Andorra, Catalonia, the Balearic Islands, the Valencia region, the western part of Aragon, as well as into parts of south-west France, and the city of Alghero in Sardinia, Italy. Catalan is spoken in different dialects but, in total, has about 7.3 million speakers although it is estimated 9.8 million people understand the language (Institut d’Estudis Catalans, 2017). While there is a body of research describing language development in Catalan, it is of much interest to complete this description by including the domain of narrative and cover its acquisition across a wide age-range of children. A study of narrative development in Catalan will have two benefits: first, the work will provide language researchers with patterns of development of an understudied language which can be compared with previous research on other more documented languages, thus shedding light on common and language-specific developmental patterns. Secondly, there are potential clinical implications, as researchers and professionals will be able to compare what is typical and atypical narrative development for children in schools and clinics in Catalonia using a newly adapted test.
1.1 Narrative development
A large proportion of English speaking children's everyday talk includes personal narratives (Beals & Snow, Reference Beals and Snow2002; Liles, Duffy, Merritt & Purcell, Reference Liles, Duffy, Merritt and Purcell1995). Pre-schoolers recount sequences of previously experienced events, but it is only later in development that they become able to deal with the discourse-pragmatic requirements that underpin longer more decontextualized narrative (Peterson & McCabe, Reference Peterson and McCabe1983). Much research on narrative development divides up the organisation of information and forms into macro and microstructure and the current study also used this division of elements for Catalan.
The macrostructural level focuses on two aspects: story structure and specific information content (Pankratz, Plante, Vance & Insalaco, Reference Pankratz, Plante, Vance and Insalaco2007). Story structure refers to the ability to construct a hierarchical representation of the story's main elements, including the sequencing of events, introduction of the characters, setting of the scene, mention of complicating actions, the story climax and a resolution (Norbury & Bishop, Reference Norbury and Bishop2003). Children across several languages seem to master the macrostructure elements before they master microstructural devices (Berman & Slobin, Reference Berman and Slobin1994). One explanation for this developmental sequence relates to the domain general aspects of the macrostructure of narrative compared to the more language-specific skills within the micro level (e.g., use of reference devices for cohesion). In contrast, the macrostructural components of narrative rely to a great extent on general information processing skills like working memory, attention, organisation and planning linked with executive functions (e.g., Friend & Bates, Reference Friend and Bates2014). These aspects of development are more universal across languages in comparison with the cross-linguistic diversity seen in the reference and grammatical systems. Another possibility is that microstructure relies more on the discourse-pragmatic abilities connected to evaluating the listeners’ prior knowledge. This aspect of language development might have a longer developmental trajectory because it is linked to both a greater exposure to narrative, as well as written language (Nippold et al., Reference Nippold, Frantz-Kaspar, Cramond, Kirk, Hayward-Mayhew and Mackinnon2013).
Previous research across different languages also reports that there is a similar developmental timescale for the development of macrostructure. By 4 years, children begin to include the main parts of narrative with help from adults. These are the orientation (the mention of a place and time), and complicating actions (the behaviour of characters, a climax and its resolution; Trabasso & Stein, Reference Trabasso, Stein, Haith and Benson1994). By 7 years of age, children are more able to structure a story with multiple events, and by 9–10 years of age children can tell complete stories with substantial detail (Crais & Lorch, Reference Crais and Lorch1994). In many languages, 9–10 year old children have an adult-like command of narrative structure, although this has not yet been attested for children acquiring Catalan and is an aim of the current investigation.
Related to content is the notion of mentioning plot advancing events and inclusion of more complete sequences of information. Narrators are required to simultaneously plan the description of events locally, as well as decide what aspect of the plot to recount next. Children acquiring English between 3–4 years of age are able to express minimal narrative sequences by narrating two to three events in a temporal chain, but at this age they are unable to include a thematic motivation (Karmiloff-Smith, Reference Karmiloff-Smith, Kreiman and Ojedo1980). This early type of narrative production is mostly a description of a sequence of events, where characters and actions are recounted without temporal or causal explanations (Westby, Reference Westby, Kamhi and Catts2012). After around 3–4 years, children describe action sequences with simple connectives such as ‘and’ and ‘then’, and by age 5 years children start producing reaction sequences where there is causal information included, but these narratives still often lack a description of characters’ goals (Stern & Albro, 1997).
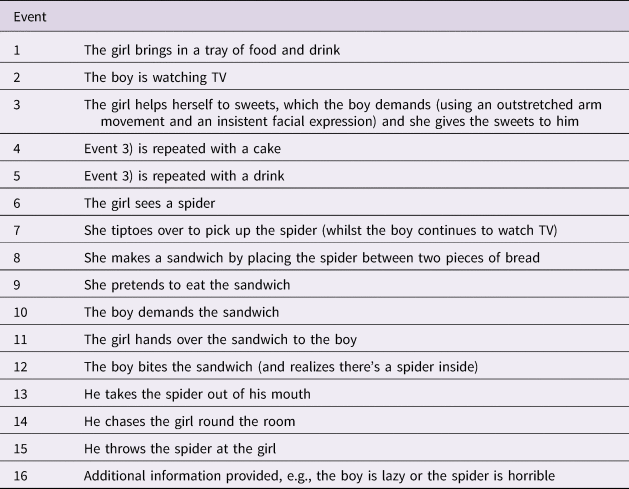
By 6 years, children demonstrate improvements in the sequencing of events, but it is not until considerably later that English speaking children are able to package all of these elements together to produce complete narrative sequences with events that include a goal, attempt and outcome (Trabasso & Stein, Reference Trabasso, Stein, Haith and Benson1994). In the current study, we were also interested in how Catalan speaking children developed the skill to manage sequences of events across development. The elicitation material contains 16 events and we ask which events in the narratives were mentioned the most often across the age groups. We wanted to check that, with age, children were not just adding supplementary details without mentioning crucial plot advancing information. We ask if this general pattern of development of plot advancing information and event sequencing (description – action – reaction – completion) will be observed for children acquiring Catalan and this formed a second aim of the current study.
We next turn to the microstructural components of narrative. These elements are used at the word and clausal level and include devices for the control of reference forms, plot cohesion, use of grammatical devices for sentence-level cohesion and evaluative comments. In contrast to the more universal macrostructure, the micro level exhibits more diverse developmental patterns cross-linguistically (Liles et al., Reference Liles, Duffy, Merritt and Purcell1995). Children's mastery of plot cohesion is attested by the eventual unambiguous use of reference to specify and distinguish characters in the narrative. In English this is both at first mention by means of an indefinite noun phrase (NP), through the use of anaphoric pronouns (he, she, his, her) or lexical definite NPs to refer back to the named character. In the case of Catalan and other pro-drop languages there is a somewhat different system of reference types available. In order to refer back to an already mentioned character, speakers must choose between strong and clitic pronouns, zero anaphora or a lexical definite NP, and this is done on the basis of discourse constraints. The main cohesive devices in English are not mastered in narrative production until 9 years and some not until 12 years, e.g., control of reference forms and connectivity devices (Berman & Slobin, Reference Berman and Slobin1994; Karmiloff-Smith, Reference Karmiloff-Smith, Fletcher and Garman1986). There is little research on what the development of the microstructure of narrative looks like across the 4–11 year age range for children acquiring Catalan. However, linked work in Cantonese, which is also a pro-drop language, suggests this particular aspect of the microstructural organisation is complex and follows a protracted development in child speakers (To, Stokes, Cheung & T'Sou, Reference To, Stokes, Cheung and T'sou2010). This implies that the late development of microstructure observed in English and Cantonese will also be the case for children acquiring Catalan. A more complete description of this aspect of reference cohesion is an aim of the current research.
The second set of microstructural devices descried in the language development literature focus on inter-clausal connectivity devices, such as coordination (and, but, or) and subordination (because, when, that, if), as well as conjunctions, and discourse markers (however, then). These devices provide connections from one event to another and facilitate a clearly understood sequence. While there is no description of this aspect of narratives in child language in Catalan, there are descriptions carried out on other romance languages, such as Italian and Spanish (Roch, Florit & Levorato, Reference Roch, Florit and Levorato2016; Sebastián & Slobin, Reference Sebastián, Slobin, Berman and Slobin1994; Verhoeven, Aparici, Cahana-Amitay, van Hell, Kriz & Viguié, Reference Verhoeven, Aparici, Cahana-Amitay, van Hell, Kriz and Viguié2002). In Spanish, 3-year-old children quickly master the use of coordination (y, pero ‘and, but’) but it is not until between 4–6 years that Spanish children use subordinate clauses (e.g., cuando and porque ‘when, because’). From 5 to 9 years of age, the use of the coordinating conjunction (y ‘and’) in Spanish decreases (from 55% of the clauses at 5 years, to 41% at 9, to only 24% in adults) as the use of semantically more specific connectives (subordination conjunctions) increases (Sebastián & Slobin, Reference Sebastián, Slobin, Berman and Slobin1994).
The third aspect of microstructure is the set of grammatical devices used for achieving sentence-level cohesion e.g., verb forms for agreement (the boy keeps asking the girl for food). In Catalan there is a rich system of agreement for gender and number that interacts with tense and aspect; indeed across languages there is high diversity of these forms. A feature of Catalan and other romance languages is the rapid development of grammatical forms in sentence level language (Pizzuto & Caselli, Reference Pizzuto and Caselli1992). However this contrasts with a much more prolonged development of the use of these forms in narratives.
A final aspect of microstructure is the use of plot evaluations. In studies of Spanish development, there are occasional uses of these at 5 years old, e.g., con cuidado ‘carefully’, but this does not appear as a major part of the narrative until considerably later. At around 9-years-old children refer to the emotional/mental states of characters, e.g., niño goloso ‘greedy boy’. But further developments occur up to 16 years old, when evaluative material becomes the bulk of the narrative by adding explanations of circumstances and characters’ motivations (Tolchinsky, Reference Tolchinsky and Barriga2014). It is unclear how reference, connectivity, grammatical cohesion and evaluation are used in narrative contexts in Catalan and this description will be an aim of the current research.
1.2 Evaluating narrative development
The studies reported in the previous section are based on the elicitation of data based on some form of stimulus material i.e., from pictures, videos or an oral story retell. However, few studies have used a standardised way of scoring these stories for comparison across age groups (Botting, Reference Botting2002; Jones, Marshall, Botting, Atkinson, Toscana, Denmark, Herman & Morgan, Reference Jones, Marshall, Botting, Atkinson, Toscana, Denmark, Herman and Morgan2016). Standardised tests are used by professionals working with children who might have difficulties in their language development to both monitor progress and the extent of any delays, as well as to focus interventions on specific aspects that the child might have difficulties with (e.g., the use of connectivity or evaluative devices). In this area of research, it is first necessary to collect scores on a standard task in children with typical language development in order to establish what aspects are less difficult or more complex at different ages. It is also important to understand what standard variability exists in typical development.
In summary, most research to date posits a universal earlier development of macrostructure of narrative information across children learning different languages compared to microstructure. The present study was designed to provide a complete description of how the macro and microstructure of narrative develops in children whose maternal language is Catalan and how this enhances our insight into narrative development. Catalan has several differences in the referential devices at the microstructure level compared to the system available in English and so we were interested if this has implications for the learning and use of cohesive devices in narratives. Previous studies of Catalan have focused either on a specific part of the system, e.g., reference mechanisms (e.g., López-Orós & Teberosky, Reference López-Orós and Teberosky1998) or on a narrow age range of children, e.g., those older than 9 years (Bel, Perera & Salas, Reference Bel, Perera and Salas2010) or children with a developmental language disorder (Andreu, Sanz-Torrent, Guàrdia Olmos & MacWhinney, Reference Andreu, Sanz-Torrent, Guàrdia Olmos and MacWhinney2011). The current study looks at a wide range of narrative areas in a large age range of typically developing Catalan speakers.
The research questions that guided this study are:
1. What is the developmental sequence of macro and microstructure in Catalan speaking children across ages 4–11 years?
Prediction: In line with the previous literature (Berman & Slobin, Reference Berman and Slobin1994), Catalan speaking children will master macro before microstructure.
2. Within the macrostructure, will an increase of plot advancing information and event sequencing be observed in the narratives across age groups for children acquiring Catalan?
Prediction: Based on previous research (Trabasso & Stein, Reference Trabasso, Stein, Haith and Benson1994; Westby, Reference Westby, Kamhi and Catts2012), Catalan speaking children will increase plot advancing information, as well as event sequencing with age.
3. Will the microstructural components of reference cohesion, connectivity markers, grammatical cohesion and evaluative comments be mastered at the same age or at different ages?
Prediction: All micro organisation forms will be mastered at the same age – after 9 years, in line with previous studies (Berman & Slobin, Reference Berman and Slobin1994; To et al, Reference To, Stokes, Cheung and T'sou2010).
2. Method
2.1 Participants
118 children (62 boys) were recruited based upon the following inclusion criteria: dominant in Catalan and no history of learning disabilities or concomitant disorders such as attention deficit or autism. The children's ages ranged from 4;0 to 10;11 (M = 7;03, SD = 2;01) and were recruited in Barcelona, Catalonia. It is important to note Catalonia is a fully bilingual community, where Spanish and Catalan coexist as official languages, with Catalan being the language of schooling throughout compulsory education. Therefore, we recruited children whose home language and language of instruction in the school was Catalan.
The sample consisted of 4 age groups (Group 1: 4 years-old, N = 21; Group 2: 5;00–6;11 years-old, N = 36; Group 3: 7;00–8;11 years-old, N = 30; Group 4: 9;00–10;11 years-old, N = 31). The age groups were based on the following rationale: the first age group are in control of their core language skills in grammar but much less so using these forms for narrative production; from group 2 onwards, based on Spanish data, when we would typically expect the onset of discourse level language development. This would continue across age groups 3 and 4, as children are typically found to master the structural story elements by age 9 years, but some aspects of cohesion are continuing to develop beyond this age, through 9–10;11 years (group 4).
2.2 Procedure
The UCL Research Ethics Committee gave ethical approval for the study. Children were recruited by their teachers and school directors. Informed written consent was obtained from parents/guardians prior to testing. Children gave verbal consent at the start of the testing session and were informed they could opt out at any time. A test known as ‘The Spider story’ was used in the assessment as it is suitable for a wide age range and quick and simple to administer. This is a silent video used for the assessment of various languages including English (Jones et al., Reference Jones, Marshall, Botting, Atkinson, Toscana, Denmark, Herman and Morgan2016). The test was adapted for Catalan for the purposes of the current study. In carrying out the evaluation, first the child watches a short (2 minutes), silent story on a laptop. In the story, the two children in the video act out a series of events without the use of language (see Table 1 for a description of the story). Participants are instructed to watch the story carefully and to remember it so they can retell it immediately after viewing. To encourage the child to tell the whole story, the experimenter leaves the room and returns once the video has finished. The child is able to watch the film a second time if he/she wishes. When the experimenter returns, the child is asked to tell the story and the experimenter listens to the child's response without prompting. After completion, they are given the chance to add some information. After telling, there are three questions to assess comprehension. The answers are also scored. The children's narratives were audio recorded and then transcribed for analysis. All transcripts were checked against the recordings by a second examiner. See section 2.2.2 for information on inter-coder reliability.
Story Events

2.2.1 Scoring Narratives
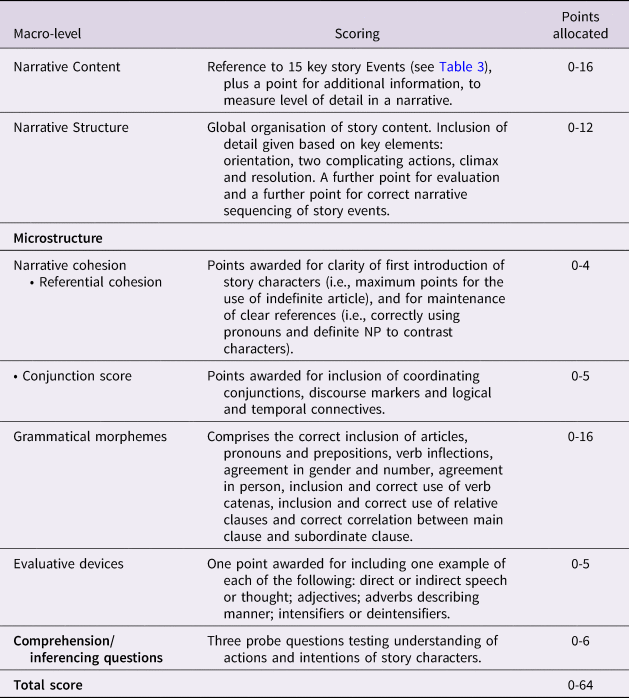
Table 2 provides an overview of the method used to score the children's narratives. The areas assessed in the test are content, story structure (macro elements) and cohesion and grammar (micro elements) following the original system in Jones et al. (Reference Jones, Marshall, Botting, Atkinson, Toscana, Denmark, Herman and Morgan2016). After extensive piloting it was observed that it was not necessary to adapt the narrative content and structure measures originally developed on the English sample. These two parts of the test focus on information content and sequencing of this information in the story. Both adult and child Catalan speakers in the pilot produced narratives with the same content and structure as was observed in the English sample. However, it was necessary to develop a section on Catalan microstructure.
Summary of narrative scoring system

At the macro-level, the narratives were evaluated for content and structure following the scoring guidelines of Jones et al. (Reference Jones, Marshall, Botting, Atkinson, Toscana, Denmark, Herman and Morgan2016). Narrative content (i.e., the level of detailed information in the narrative) was scored by awarding one point for each mention of 16 specific story events (see Table 1), plus a further point for mentioning any “additional information” in the story (e.g., the spider was horrible), giving a maximum of 16 points. We also wanted to know which events in the narratives were mentioned the most often across the age groups. We therefore focused our attention on 5 plot advancing events which adult speakers always mentioned in the pilot phase:
• The girl brings in a tray of food and drink,
• The boy makes at least one demand,
• The girl makes the spider sandwich,
• The boy bites the sandwich
• The boy realizes there is a spider in the sandwich
Each mention of a core event carried 2 points (total 10).
Narrative structure, the global organization of story content, was scored using a high-point analysis (Labov & Waletzky, Reference Labov, Waletzky and Helm1967) and scoring was based on six key elements following guidelines of Jones et al. (Reference Jones, Marshall, Botting, Atkinson, Toscana, Denmark, Herman and Morgan2016): (1) orientation (see following example 1) (2) two complicating actions (examples 2 and 3, respectively), (3) climax (example 4) and (4) resolution (example 5). Each section is awarded 1 or 2 points depending on the amount of detail given (complicating actions can be awarded 4 points, since there are two of them). A further point is awarded for (5) evaluation (i.e., the child presents their own perspective on the characters’ feelings or expresses their own views; example 6), and for (6) narrative sequence (i.e., correct order of story events). A maximum of 12 points was thus awarded for narrative structure.
Orientation
(1) “Doncs és un nen que estava veient la tele, llavors ve una nena (…) i porta una safata amb menjar, la deixa a una taula i es posa també a veure la tele…” (So there is a boy watching the telly, then a girl comes (…) and carries a tray with food, leaves it on the table and sits down watching the T.V…) (Girl, 10;6)
Complication
(2) “I… ah si! també agafava un suc, volia i llavors després li tenia que donar” (and…ah, yes! She also gets a juice then wanted it, after gave him it) (Boy, 7;0)
Complication
(3) “…I després troba una aranya, la posa en un plat, obre el bocata del pa, posa l'aranya, el tanca i se'n va amb el bocata al sofà, llavorens el nen diu que li doni i la nena dissimula i diu que no i llavorens li torna a dir que li doni i li don…”. (and after she finds a spider and she puts it on a plate, she opens the sandwich, puts in the spider and covers it and she goes with the sandwich to the sofa. Then the boy asks her for it and the girl is pretending she doesn't want to give it to him and he keeps saying give it to me and she gives it to him) (Girl, 9;0)
Climax
(4) “…i el nen s'ho està apunt de menjar i veu l'aranya, la treu…”. (and the boy is just going to eat it and sees the spider, spits it out) (Boy, 9;7)
Resolution/evaluations
(5) “…Llavors s'ha enfadat amb la nena i es veu que la nena corre i el nen la persegueix.” (then he's angry with the girl and we see that the girl runs off and the boy chases her) (Girl, 10;6)
Sequencing
(6) “… l'agafa i va a la taula on hi ha el brenar i agafa un bocata i com que sap que el seu company li demanarà, doncs hi posa… perquè està com una mica enrabiada, i posa l'aranya dins el bocata…” (he takes it and goes to the table where she has her snack and she gets a sandwich and as she knows that her friend is going to ask her for it, she puts it…because she is a bit angry, and she puts the spider in the sandwich. (Girl, 9)
After extensive piloting and comparison of Catalan developmental descriptions from other research, a scoring scheme adapted from Jones et al. (Reference Jones, Marshall, Botting, Atkinson, Toscana, Denmark, Herman and Morgan2016) was created to assess microstructural narrative skills in Catalan: a score for grammatical markers and narrative devices was generated by considering narrative cohesion, grammatical morphemes, and evaluative devices (Maximum 30 points). Narrative cohesion included the use of referents to specify a character, and the use of conjunctions and discourse markers. A referential cohesion score (maximum 4 points) was based upon the first introduction of the story character(s) and whether references were consistently clear throughout.
A maximum of 2 points for first introduction was scored in the following way:
• 0 points for no first mention (null form, e.g., mira la televisió (watches television) or for a presupposing introduction, using a pronoun, e.g., ella (she), or a definite article and noun, e.g., la nena (the girl)
• 2 points for non-presupposing introduction using indefinite article(s) and noun, e.g., una nena (a girl)
Reference maintenance points (maximum 2) were assigned based on the following:
• 0 points for unclear referencing
• 1 point for some ambiguity in references
• 2 points for clear references throughout (i.e., uses pronouns and contrasts characters effectively).
A conjunction score (maximum 5 points) comprised the use of basic coordinating conjunctions, the use of temporal markers and the use of temporal and logical connectives (examples of each appear below). Points were awarded for each based on the following scale:
Coordinating conjunctions: e.g., i, però, o… (and, but, or…)
• 0 points for no inclusion or one conjunction
• 1 point for two or more different conjunctions
Discourse markers: e.g., després, mentre, de sobte… (after, meanwhile, suddenly…)
• 0 points for no inclusion to two discourse markers
• 1 point for more than three different discourse markers
Logical and temporal connectives: e.g., perquè, ja que, si, quan… (because, since, if, when…)
• 0 points for no inclusion
• 1 point for 1–2 different logical and temporal connectives
• 2 points for 3+
• 3 points for non-frequent forms, e.g., cada vegada que… (every time that…)
A maximum of 4 points was awarded for the inclusion of evaluative devices. One point was awarded for the inclusion of one or more examples of each of the following:
• Direct, e.g., la nena va dir: no! (the girl said: no!), or indirect speech, e.g., la nena va pensar que… (the girl thought that…)
• Adjectives, e.g., mandrós, avorrit (lazy, bored)
• Adverbs describing manner, e.g., lentament, astutament (slowly, cleverly)
• Intensifiers, e.g., molt, realment (very, really); or de-intensifiers e.g., bastant, gairebé (quite, almost).
Nine types of Catalan grammatical morphemes were analysed: articles, prepositions, pronouns, verb forms, agreement in grammatical gender and number, agreement in grammatical person, use of verb chains or catenas, e.g., continua mirant, segueix posant (keeps looking, keeps putting), the inclusion of relative clauses and verbal correlation between main clause and subordinate clause (maximum 16 points). Most of these forms need to be mastered in order to be able to use them as cohesive devices (e.g., for reference introduction or maintenance and for the discourse connectivity function).
A maximum of 3 points were awarded for inclusion of articles, pronouns and prepositions:
• 1 point was awarded for inclusion and correct use of articles throughout the narrative: e.g., la nena, el nen, l'aranya, els dos (the girl, the boy, the spider, the two of them).
• 1 point was awarded for inclusion and correct use of pronouns: e.g., ella, ell ho veu, se'l menja (she, he sees it, (he/she) eats it).
Note that here only correctness of the forms (articles and pronouns) used is evaluated; the use of these forms to achieve the discourse functions of introducing and maintaining reference to characters is evaluated by the referential cohesion score described above.
• 1 point was awarded for inclusion and correct use of prepositions: e.g., sobre la taula, dins l'entrepà (on the table, in the sandwich)
A maximum of 2 points each was rewarded for verb inflections (e.g., camina, caminava, caminant / she walks, walked, walking), agreement in grammatical gender and number (e.g., fa que no amb el cap / she shook the (her) head) and agreement in grammatical person (e.g., eren germans / they were brother and sister) using the following scoring method:
• 0 points when errors were made most of the time (>50%)
• 1 point when errors were made some of the time (10–50%)
• 2 points when errors were rarely made (<10%)
Errors included: commissions, e.g., la nena agafen (the girl took-3rd person plural), and omissions, e.g., la nena __ entrar; el nen __ enfadat / the girl walk__ in; the boy __ angry).
A maximum of 2 points were awarded for inclusion and correct use of catenas (verb chains) using the following scoring method:
• 0 points for no correct inclusion
• 1 point for 1–2 correct inclusions
• 2 points for 3+ correct inclusions
A maximum of 2 points were awarded for verbal correlation between main clause and subordinate clause, e.g., quan va entrar, ell estava mirant la tele (when she walked in, he was watching tv), using the following scoring method:
• 0 points for non-correct correlation
• 1 point for 1 correct correlation
• 2 points for 2+ correct correlation
A maximum of 3 points were awarded for inclusion of subordinate relative clauses, e.g., el nen, que estava mirant la tele, li va dir… (the boy, who was watching the TV, said to her…), using the following scoring method:
• 0 points for no inclusion
• 1 point for 1 relative clause
• 2 points for 2 relative clauses
• 3 points for 3 or more relative clauses
2.2.2. Reliability of the Narrative Production Test
Intra-rater reliability of the test was assessed by two independent coders. All narratives were scored by both coders for structure and content. High inter-rater reliability was found for each score on each sub-scale of the test (Content: r (128) =.98, p <.001; Structure: r (128) =.95, p < .001). The second experimenter also scored 100 randomly selected narratives (86%) for grammatical markers and cohesive devices, and inter-rater reliability was also excellent (r (110) = .96, p < .001). Twelve of the narratives (10%) were randomly selected and scored a second time by the same coder. An overall total score was calculated and a strong correlation between scores at both time points was found (r (13) = .98, p < .001).
3. Results
The first research question concerned the developmental sequence of macro and microstructure in Catalan speaking children across ages 4–11 years.
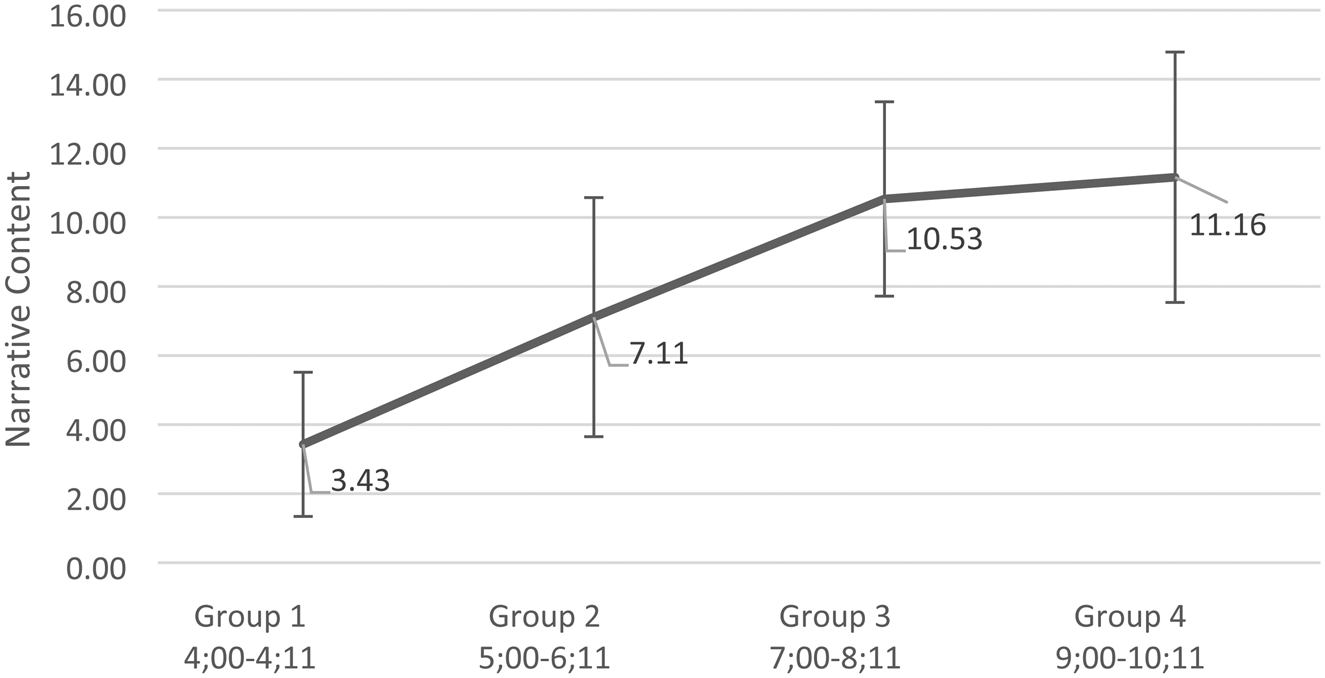
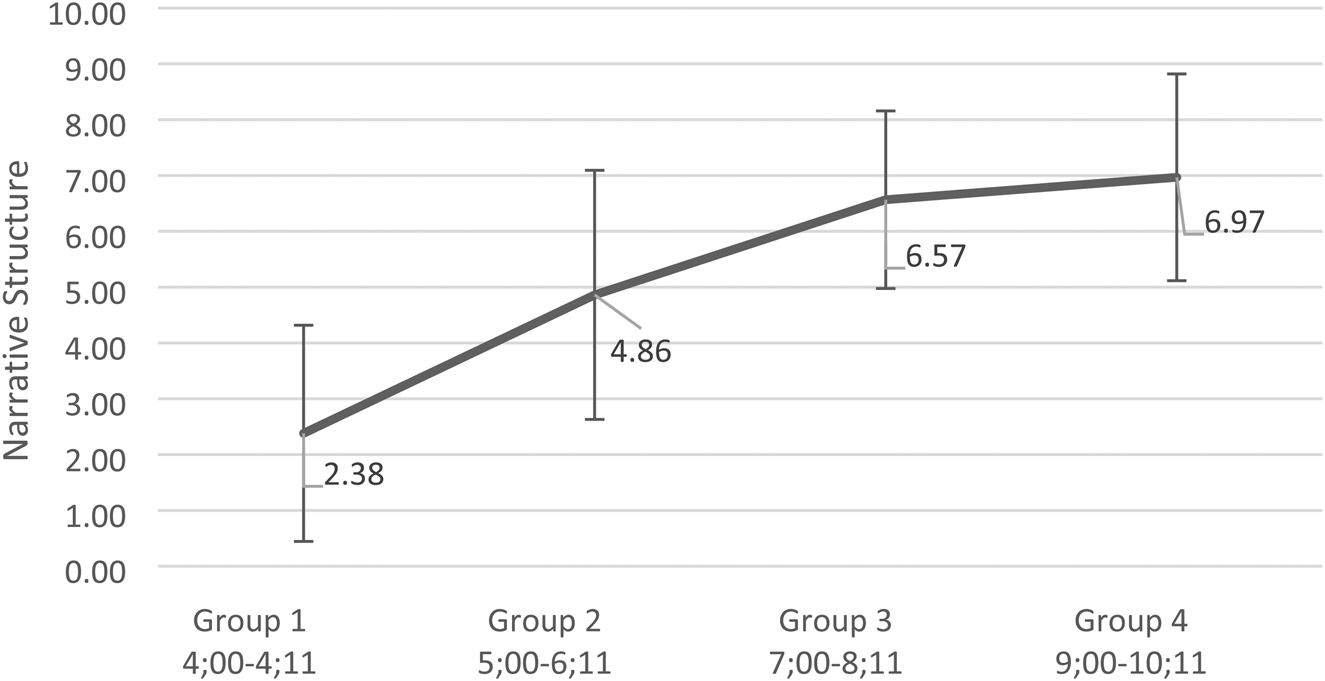
Across figures 1–2, we see that scores for the macrostrucural components of content and structure increased significantly between groups 1 and 2 and between 2 and 3 but no differences were observed between group 3 and 4, indicating that by 8;11 these aspects had become established.
Content scores by age group

Structure scores by age group

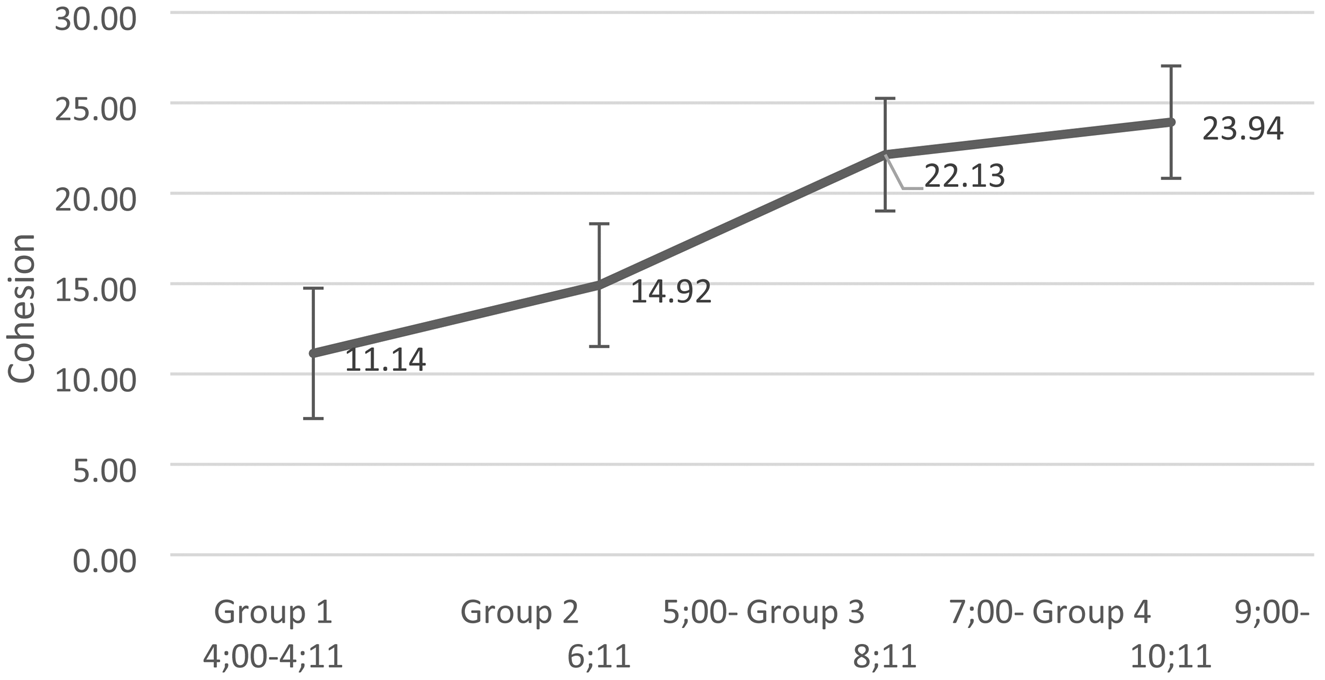
For the microstructural components we continued to see a developmental trend between group 3 and 4 (9–10;11 years); see figure 3.
Microstructure scores by age group

Because parametric assumptions were not met (the data was not normally distributed) Kruskal-Wallis and Mann-Whitney tests were used to compare performance across age-groups. The Kruskal-Wallis test showed that there was a statistically significant difference in Microstructure, H(3) = 82.370, p <.001; Narrative Content, H(3) = 54.011, p <.001 and Narrative Structure, H(3) = 47.876, p <.001. Mann-Whitney tests revealed similar results for the three statistical models, indicating a significant difference between groups 1 and 2 (p < .001 in all tests), between groups 2 and 3 (p < .05 in all tests), between groups 3 vs 4 for Microstructure (U = 305.500, z=−2.314, p =.021) but not for Narrative Content (U = 530.500, z=−0.500 p = .617 and for Narrative Structure U = 412.500, z=−0.773, p = .439).
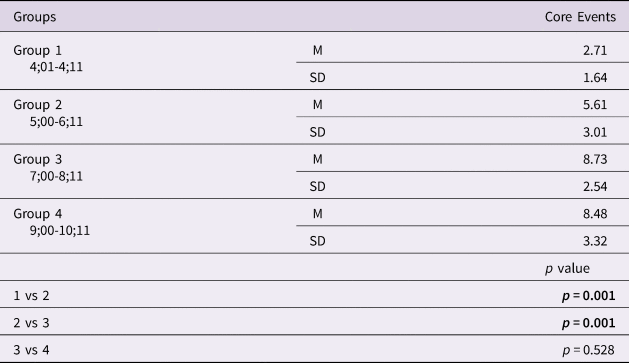
The second research question asked if an increase of plot advancing information and event sequencing will be observed across age groups for children acquiring Catalan? We conducted a Mann-Whitney test to determine if there was a difference between age groups in Core Episode. Tests indicated differences between the first age groups (groups 1 and 2, U = 163.500, z=−3.577 p <.001) and between groups 2 and 3, U = 242.000, z=−3.856 p <.001), but not between groups 3 and 4 (U = 421.500, z=−0.631 p = .528). The older children therefore did not carry on increasing story length. The oldest age groups are instead choosing to focus the information more and increase the richness of the narration through more elaborate grammatical devices (See Table 3).
Plot advancing events. Statistically significant differences in bold.

The second analysis for this question focused on story event sequencing. In this section, we describe more qualitative details about the changes across age groups. Group 1 narratives (4 years old) are characterized by a description only. Children recounted a summary of the events and tended to focus on what they consider the most important information. Generally, this was the main message of the story without temporal information. For instance, in example (7) a child summed up the whole story in a single sentence:
Description
(7) “El nen s'ha menjat una aranya” (The boy ate a spider) (Girl, 4;10)
At 4 years of age some children began to report actions and event sequences with simple connectives (example 8).
Action
(8) “Un nen i una nena i hi havia una aranya i… eee… i hi havia un nen que se l'havia menjat l'aranya.”
(A boy and a girl and there was a spider and…. hum…and there was a boy who ate it, the spider) (Girl, 4;4)
In Group 2 (5–6 years), children began to make reference to a larger number of events and expressed more information in order for the story to be better understood but as with English-speaking children at this age, narratives lacked information about goals and additional evaluative information (examples 9 and 10).
Reaction
(9)“… i la nena es vol menjar caramels i li dóna al nen i també es vol menjar un suc i dóna al nen i també es va menjar un Sandwich…”
(and the girl wants to eat sweets and gives it to the boy, and also wants to eat a juice and gives it to the boy, and also ate a sandwich) (Boy, 6;8)
(10) “… i al final li dóna es menja una aranya i el comença a perseguir però no se la menja al final”.
(and finally gives to him, eats a spider and starts chasing him but does not eat it at the end) (Boy, 6;3)
Children in Group 3 (7–8 years) incorporated both more event information, as well as additional evaluative information (examples 11 ‘lazy’ and 12 ‘plastic’).
(11) “És un nen que està veient la tele que és molt vago,…”
(It's a boy who is watching TV who is very lazy…) (Boy, 7;6)
(12) “I després veu una aranya de mentida, de plàstic…”
(And then saw a fake spider, a plastic one…) (Girl, 8;2)
In the oldest age group, Group 4 (9–10;11), children made reference to the majority of the events in the narrative and were increasingly adding extra content within the episodes by expressing complete sequences with mentions of goals, attempts and outcomes (example 13).
Completion
(13)“… fica una aranya i el nen s'ho està apunt de menjar i veu l'aranya, la treu i persegueix la nena”.
(puts a spider, and the boy is just about to eat it and sees the spider, spits it out and runs after the girl) (Boy, 9;7)
In summary, the main macrostructural components of content and story structure develop gradually for Catalan children, and by 8;11 this element of the narrative production is complete. We turn to the microstructure of the narrative next.
The research question for this aspect of the study asked if, across the microstructure of narrative, reference cohesion, connectivity markers, grammatical cohesion and evaluative comments will be mastered at the same or different ages? As we reported for the first research question, a global score for micro components indicated continuing changes in the oldest children but when we looked at sub-parts of the microstructure a more variable pattern appeared.
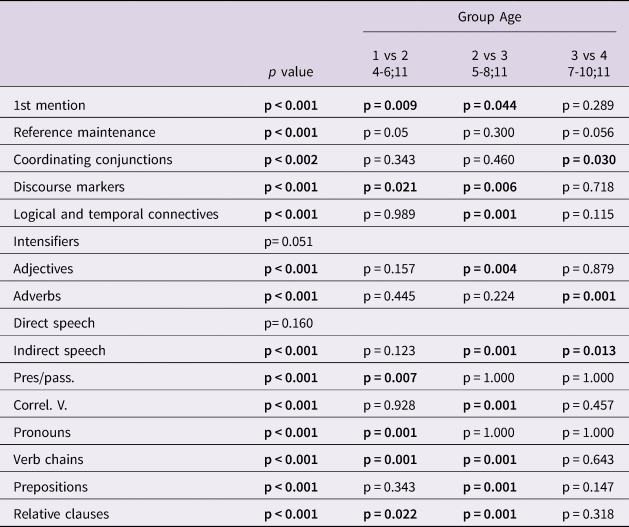
Because microstructure was the most extensive area of evaluation we decided to sub-divide the elements into devices listed in Table 4. We observed variability when different microstructural components were mastered across the age groups. This suggests some, rather than all, microstructure is acquired late. Kruskal-Wallis H test (used for non-normal distributions) showed that there was a statistically significant difference across elements, and Mann–Whitney U test shows the differences between the age groups for these sub-parts (see Table 4).
Comparison of scores for microstructure elements across 4 age groups. Statistically significant differences in bold.

The narrative data indicate that use of some microstructure elements does not change beyond age 5;0 years e.g., pronouns. However other elements continue to develop up to 7;0 e.g. the correlation between main and subordinate clause (coded as Correl. V in table 4). For reference maintenance, the differences in scores between the two oldest groups fell just short of significance (3 vs 4 p = .056). However, there continued to be several ambiguous examples of reference maintenance in the 9–11 year olds suggesting that this was far from adult-like at this age. We now look in more detail across 4 areas of microstructure: reference cohesion, connectivity, grammatical cohesion and evaluative devices.
Referential cohesion was assessed through the correct introduction and maintenance of story characters and we observed development throughout the age groups. The first appropriate reference forms to be used were for the introduction of characters by means of an indefinite NP, but also several examples of non-appropriate forms such as zero anaphora, pronouns and definite NPs. From table 4 we see statistically significant differences in the use of appropriate forms for the function of 1st mention (introducing characters) between 4–6 year-olds and between 5–8 year-olds; from the age of 8;11 onwards, scores remain stable.
The other grammatical forms available for referential cohesion were pronouns, definite NPs and zero anaphors for reference maintenance and reference switching. Children younger than 8 years in the first two groups used ambiguous referencing because of an omission of pronouns where the verb inflection could signal both male and female character maintenance (zero anaphors) and object clitic pronouns that were not marked for gender. An example of both these ambiguities is seen in 14. The zero anaphor ‘es va trobar’ is ambiguous between the girl and boy character. The object clitic without gender marking ‘li va donar’ again fails to clarify who is the giver or receiver of the sandwich.
(14) “… i va posar una aranya, una aranya que es va trobar dins de l'entrepà i li va donar i se la va menjar” (… and puts a spider, a spider that found inside the sandwich and gave it to him/her and ate it) (Boy, 7;10)
In example 15 we see a child from the oldest age group providing this necessary information and achieving clear reference maintenance.
(15) “Pues que una nena petita, bueno la germana del noi, el noi estava mirant la tele llavors la noia porta com el seu brenar, agafa un carmel i llavors el germà gran li demana, li demana li demana i la nena li diu “que no que no” i al final la nena accepta…” (So a young girl, well, the boy's sister, the boy was watching the TV, then the girl brings over a kind of snack, takes a sweet and then the older brother asks her, asks her, asks her, and the girl says to him “no, no” and finally the girl gives in…” (Girl, 9;9)
However, even in the oldest age group reference maintenance does not always appear adult-like. Some children continued to use ambiguous references for people and objects (e.g., cosa – thing; ho - it) which decreases understanding as in example 16.
(16) “Que una nena va portar com un brenar i agafava una cosa, s'ho volia menjar i li deia que no…”
(So a girl brought over a kind of snack and got something, wanted to eat it and said no to him…) (Boy, 10;0)
Another pattern that made following reference more difficult was redundancy, as in example 17, from one of the oldest children in the sample.
(17) “Un nen estava veient la tele i llavors ha vingut la seva germana, bueno no sé si era la seva germana però com que vivien a la mateixa casa… Bueno, ha vingut la nena i… amb una safata amb menjar”.
(A boy was watching TV and then his sister came in, well, I dont know if it was his sister, but as lived in the same house…Fine, the girl came in and… with a tray of food) (Girl, 10;11).
Thus, while microstructure is established in the older age group there are some aspects that require further refinement, especially clearer reference and delineation of the main plot without over-description. Reference maintenance with a rich system of clitic and overt pronouns develops over a long period. There is variable development also within the connectivity markers of coordinating conjunctions, discourse markers and subordinating (adverbial) conjunctions. The earliest discourse markers were temporal ones ‘llavors’ (then) or ‘de sobte’ (suddenly). There were no uses of discourse markers in the 4 year-olds’ narratives and they first appear sporadically in 5–6 year-olds and steadily increase until they reach maximum performance in 7–8 year-olds’ narratives. There is a similar developmental pattern for the use of adverbial subordination i.e., temporal and logical connectives in example 18.
(18) “…i quan va anar al sofà el nen li va dir també me'l tens que donar i ella no li volia donar…”
(…and when went to the sofa the boy said to her “you also have to give it to me”, and she did not want to give it to him…) (Boy, 10;11)
In contrast, the use of coordinating conjunctions remains stable throughout the first three age groups with an increase in the oldest group (see example 19).
(19) “…Després torna i agafa el cupcake, el desembolica, arriba a sentar-se, se l'està apunt de ficar a la boca i l'altre li torna a demanar, ella diu que no…” (…Then comes back and takes the cupcake, unwraps it, is going to sit down, is about to put it in her mouth, and the other one asks again for it, she says no…) (Boy, 10;11)
The use of grammatical forms to achieve cohesion follows an interesting development. The current data indicate that the correct use of Catalan present and past verb tenses and pronouns is acquired by 6 years of age, but the use of verb chains or catenas is a much later with differences in scores between groups up to 8 years. The same pattern was also observed for the use of relative clauses. Relative clauses are infrequent in the younger age group and they significantly increase between 4–8 years old. The final aspect of cohesion to be studied follows the same pattern: correct correlation in verb tense/aspect/mood between main clause and subordinate clause in subordinate constructions also does not change in use after 8 years old. Thus with the connectivity markers there are diverse patterns of development.
The last area of micro-structure was the inclusion of evaluative devices. Again, different developmental patterns are found for each device. Adjectives such as mandrós (lazy) appear from the earliest ages and do not change throughout the age range of the sample. The same pattern was observed for the inclusion of intensifiers, e.g., gairebé (almost). In contrast, the use of manner adverbs e.g., astutament (cleverly) is a later development with changes in the data up to the oldest age-group. There is also a very low appearance of manner adverbs before age 9 years. Finally, the use of direct and indirect speech appears early in the sample but indirect speech continues to develop until 9–10;11 (see example 20).
(20) “…es senta al sofà se'l va a menjar i el noi li diu que li doni…” (…sits down on the sofa, is going to eat it, and the boy says that should give it to him) (Boy, 10)
4. Discussion
This study analysed narrative productions for a large number of macro and micro-structural components across a wide age-range of children acquiring Catalan. The study provides novel information about general processes of language development, as well as the acquisition of specific linguistic devices used in Catalan for narrative. Our first question concerned the developmental sequence of macro and microstructure. We predicted that Catalan would follow the previous cross-linguistic studies, which report macrostructure development as following a universal i.e., non language-specific pattern (Berman & Slobin, Reference Berman and Slobin1994; Bohnacker, Reference Bohnacker2016; Trabasso et al, 1992). These studies report that children have command of the content and structure of narratives around 8-9 years and this happens before micro-structural components are fully mastered. Our second area of enquiry concerned the quality of the information content in the narratives provided by different age groups across the Catalan sample. We predicted an increase in plot advancing information, as well as richer event sequencing across age groups. This prediction again followed a rationale that content organisation is not a language-specific feature of narrative and would be acquired in similar ways in Catalan, as in other languages. Data collected from a large number of children supported both these predictions.
Macrostructure in Catalan develops steadily from 4 years of age, with performance differences observed up to the 8;11 age group. A detailed analysis of narrative content revealed similar patterns as described for English (Trabasso et al., 1992; Westby, Reference Westby, Kamhi and Catts2012). By 8;11 children learning Catalan express all parts of the story in the correct order, with multiple events and following a canonical structure. As seen in the analysis of plot advancing events, the number of complete events with introductions, causes and consequences increases up to 8;11. Changes after this age are less to do with increasing the amount of vocabulary used or improving structure and more related to adding qualitative details to the narrative and enriching the events through micro-structural components.
In accounting for the observed results, we see that the development of narrative macrostructure is consistent across cultures and languages. It has been proposed children across languages develop the use of a narrative schema or template based on this organisation which holds together causal and temporal relationships (e.g., Mandler & Johnson, Reference Mandler and Johnson1977; Stein & Glenn, Reference Stein, Glenn and Freedle1979). Development of the macrostructure components of narrative following a template therefore relies on the growth of general information processing skills linked to improvements in working memory and other executive functions (e.g., Friend & Bates, Reference Friend and Bates2014). We observe that Catalan children from 4–8;11 are also constrained by these cognitive underpinnings, as they produce narratives with similar content and structure as children developing English across the same age-ranges (Crais & Lorch, Reference Crais and Lorch1994) and to children tested on the same story stimuli in English (Jones et al., Reference Jones, Marshall, Botting, Atkinson, Toscana, Denmark, Herman and Morgan2016). From the literature we know that children as young as 4–5 years have already mastered several aspects of grammatical morphology in languages such as Italian (Pizzuto & Caselli, Reference Pizzuto and Caselli1992) and Spanish (Sebastián & Slobin, Reference Sebastián, Slobin, Berman and Slobin1994). In narrative contexts however there are other grammatical features that are now recruited as cohesive devices (i.e., for reference management and discourse connectivity) and to express the temporal texture of a narrative. These new functions make increased demands on the cognitive system.
Regarding the third research question, which asked if all areas of microstructure are acquired in later ages, contrary to our prediction, several of the micro-structural components studied were mastered before 9 years of age in Catalan. There is considerable growth up to 8;11 – for example, in the use of present and past verb tenses, prepositions, verb catenas, correct correlation between verbs in main and subordinate clauses and the use of relative clauses. In each of these areas Catalan children do not improve scores in the oldest age group. However, the use of particular forms within Catalan for coordination, reference cohesion, manner adverbials and indirect speech are only mastered later in our sample. For one area in particular: the selection of devices for reference maintenance there is continued development in the oldest age range. We reported differences that fell just short of significance between the age group of 7–8 and 9–11 years but as seen in examples 15–17 there are qualitative differences between these age groups and indeed between the oldest children and adults. The development of English reference maintenance is also protracted (Liles et al., Reference Liles, Duffy, Merritt and Purcell1995) and depends on the ability to integrate syntactic and pragmatic information (Hemphill, Picardi & Tager-Flusberg, Reference Hemphill, Picardi and Tager-Flusberg1991). In previous research on other pro-drop languages, such as Cantonese, referential clarity plays a crucial role in listeners’ understanding of children's narratives (To, et al, Reference To, Stokes, Cheung and T'sou2010). Children acquiring Catalan, similarly to Cantonese speaking children, must also develop an awareness of the pro-drop property and in which discourse contexts the full forms can be replaced with zero anaphors for reference maintenance and reference switching. Reference control is part of the interface between discourse pragmatics and morpho-syntax (Sorace & Filiaci, Reference Sorace and Filiaci2006). We see in Catalan this aspect of narrative is complex, as evidenced by the protracted development of control of this area in child speakers.
Catalan children have to focus on which grammatical markers of person on the verb, in pro-drop contexts, are most useful for identifying reference in each discourse and syntactic situation. This is somewhat different to how children acquiring English learn that they should use personal pronouns for reference maintenance. For example, in the narrative stimuli material used in the current study, children needed to distinguish between a boy and a girl. In Catalan, if the narrator wants to drop pronouns to maintain reference, the verb inflection can mark person but not gender. Catalan object clitic pronouns cannot serve this function because they are not marked for gender either. Therefore in Catalan, the default strategy children must learn is that once a character is mentioned, in subsequent clauses it is the verb inflection with the pro-drop option that should be used if the speaker is referring to the last character mentioned. If a pronoun is used it implies a change of referent. Mastering this balance between reference forms and functions continues to cause problems and presumably carries a heavy load on the child's linguistic system. Therefore, although our sample ends at age 10;11 it is probable that parts of the micro-structure of narrative connected to the discourse-pragmatic control of reference will continue to be refined throughout adolescence. This is in line with a study of the acquisition of later aspects of reference in written and oral Catalan (López-Orós & Teberosky, Reference López-Orós and Teberosky1998) and similar to other aspects of pragmatics e.g., the use of subordinate clauses in English (Nippold et al., Reference Nippold, Frantz-Kaspar, Cramond, Kirk, Hayward-Mayhew and Mackinnon2013).
Clinical implications
Children showing weak narrative skills in the preschool years often exhibited persistent language problems during the school years (e.g., Botting, Reference Botting2002). The current research offers an assessment tool for professionals working with children developing Catalan to carry out systematic evaluations of narrative development for the first time. Rather than a single narrative score, researchers and professionals can compare development in several areas simultaneously because the test is fine-grained. The advantages of being able to study both information recall, organisation, cohesion and pragmatics in the same test will reveal how each element develops in the same child simultaneously. This is useful for the typically developing population but more so for the population of Catalan children being identified with language delay and impairments (e.g., Andreu et al., Reference Andreu, Sanz-Torrent, Guàrdia Olmos and MacWhinney2011). The original test in English was designed with speech and language therapists and educational evaluators in mind and is relatively quick and easy to administer. We will be interested to see how this usability translates for language impairment professionals working in Catalonia.
Limitations
There are some limitations of the study worth mentioning here. First, any assessment with set criterion of evaluation only gives you what it is designed to assess. There are areas of Catalan grammar that this assessment test did not include. While the children find the video stimulus engaging and enjoy recounting the events portrayed it does not have an overly complex plot structure that might prompt the use of higher level syntactic and discourse structures. This might be a reason for us only finding marginally significant differences for reference maintenance between the last two age groups. There is also the possibility that the post-hoc tests we used had insufficient power due to participant numbers. This is coupled with the fact that a structured assessment for some children is not the most appropriate way of eliciting their language. Thus, any comprehensive description of Catalan development needs to combine data from naturalistic, experimental, as well as narrative production methods.
Conclusions
Narrative abilities become very relevant during the primary school years and interact with the social-emotional skills necessary to understand other children's points of view. This study gives us a first description of the macrostructure and microstructure development of narrative in Catalan. We report both universal patterns for macrostructure, as well as a diverse set of trajectories for microstructure, in particular around reference control, thus increasing the knowledge base of this aspect of language development cross-linguistically.
Acknowledgements
Many thanks to the schools involved in this research. AJ and GM's work was funded by the ESRC Grant RES 620-28-0002