1 Introduction
Below the consolute temperature, a symmetric binary mixture with a spatially homogeneous composition spontaneously phase separates forming domains of individual phases via the process of spinodal decomposition, see e.g. the books Chaikin & Lubensky (Reference Chaikin and Lubensky1998) and Goldenfeld (Reference Goldenfeld2005). During the dynamics, individual domains merge and coarsen to form even larger domains until a final configuration is reached wherein two single-component domains separated by an interface are formed. The exact mechanism of domain growth depends on the interplay of viscous, inertial and surface tension forces (Lifshitz & Slyozov Reference Lifshitz and Slyozov1961; Siggia Reference Siggia1979; Furukawa Reference Furukawa1985; Bray Reference Bray1994; Kendon Reference Kendon2000; Kendon et al. Reference Kendon, Cates, Paganobarraga, Desplat and Bladon2001; Puri Reference Puri, Puri and Wadhawan2009; Datt, Thampi & Govindarajan Reference Datt, Thampi and Govindarajan2015; Cates & Tjhung Reference Cates and Tjhung2018).
The presence of external stirring such as shear or turbulent mixing counteracts the phase separation by breaking the coarsening domains to form a statistically stationary emulsion. In the presence of an external shear (with rate
 $\dot{\unicode[STIX]{x1D6FE}}$
), the size of a typical domain
 $D$
in an emulsion state can be estimated by the balance of shear stress
 $\unicode[STIX]{x1D70C}\unicode[STIX]{x1D708}\dot{\unicode[STIX]{x1D6FE}}$
with the capillary force density
 $\unicode[STIX]{x1D70E}/D$
which gives
 $D\sim \unicode[STIX]{x1D70E}/\unicode[STIX]{x1D70C}\unicode[STIX]{x1D708}\dot{\unicode[STIX]{x1D6FE}}$
(Hashimoto et al.
Reference Hashimoto, Matsuzaka, Moses and Onuki1995). Here
 $\unicode[STIX]{x1D70C}$
is the density,
 $\unicode[STIX]{x1D708}$
is the kinematic viscosity and
 $\unicode[STIX]{x1D70E}$
is the surface tension of the emulsion. Although both experiments (Onuki Reference Onuki2002) and numerical simulations (Stansell et al.
Reference Stansell, Stratford, Desplat, Adhikari and Cates2006; Stratford et al.
Reference Stratford, Desplat, Stansell and Cates2007; Cates & Tjhung Reference Cates and Tjhung2018) confirm the formation of an emulsion state, the domain size shows different scaling with shear rate in the directions perpendicular and parallel to the shear (Stansell et al.
Reference Stansell, Stratford, Desplat, Adhikari and Cates2006; Stratford et al.
Reference Stratford, Desplat, Stansell and Cates2007; Cates & Tjhung Reference Cates and Tjhung2018).
The situation is much more tractable when the binary-fluid mixture emulsion is formed by external stirring that generates homogeneous isotropic turbulence (HIT). Because of the isotropy of the flow, a single length scale characterises the domain size. The average domain size
 $D$
of such an emulsion can be estimated by a balance of inertial stress (
 $\unicode[STIX]{x1D70C}(\unicode[STIX]{x1D6FF}_{D}U)^{2}$
) with the capillary force density (
 $\unicode[STIX]{x1D70E}/D$
) (Hinze Reference Hinze1955), where
 $\unicode[STIX]{x1D6FF}_{D}U$
is the typical velocity difference across the domain. Using
 $\unicode[STIX]{x1D6FF}_{D}U\sim D^{1/3}\unicode[STIX]{x1D716}_{inj}^{1/3}$
(Kolmogorov Reference Kolmogorov1941; Frisch Reference Frisch1996; Pandit, Perlekar & Ray Reference Pandit, Perlekar and Ray2009), where
 $\unicode[STIX]{x1D716}_{inj}$
is the energy dissipation rate, provides an estimate for the average domain size as
 $D\sim (\unicode[STIX]{x1D70C}/\unicode[STIX]{x1D70E})^{-3/5}\unicode[STIX]{x1D716}_{inj}^{-2/5}$
. Early experiments (Pine et al.
Reference Pine, Easwar, Maher and Goldburg1984; Easwar Reference Easwar1992) indicated an arrest of the phase-separation process in the presence of HIT. This was theoretically understood using eddy diffusivity arguments by Aronovitz & Nelson (Reference Aronovitz and Nelson1984). However, only recent numerical investigations using a multicomponent lattice–Boltzmann method in three dimensions (Perlekar et al.
Reference Perlekar, Benzi, Clercx, Nelson and Toschi2014) and direct numerical simulations (DNS) of Cahn–Hilliard–Navier–Stokes equations in two dimensions (Berti et al.
Reference Berti, Boffetta, Cencini and Vulpiani2005; Fan et al.
Reference Fan, Diamond, Cahcon and Hui2016; Perlekar, Pal & Pandit Reference Perlekar, Pal and Pandit2017; Fan, Diamond & Chacon Reference Fan, Diamond and Chacon2018) have been able to study emulsification by turbulence in symmetric binary-fluid mixtures. Surprisingly, unlike shear flows, here the numerically calculated domain size is in excellent agreement with Hinze’s prediction in both two and three dimensions.
In two dimensions, Perlekar et al. (Reference Perlekar, Pal and Pandit2017) show that the inverse energy cascade and the corresponding energy flux are blocked at a wavenumber corresponding to the domain size
 $D$
. In three dimensions, numerical investigations (Kendon et al.
Reference Kendon, Cates, Paganobarraga, Desplat and Bladon2001; Perlekar et al.
Reference Perlekar, Benzi, Clercx, Nelson and Toschi2014) show that for a binary-fluid mixture the energy content in the inertial range is suppressed in comparison to a single-component fluid at the same Reynolds number. However, an understanding of the underlying energy transfer mechanisms in three dimensions remains unclear.
In this paper, we conduct DNS to investigate the energy transfer mechanisms and the statistical properties of the velocity fluctuations in a stirred three-dimensional symmetric binary-fluid mixture. Our main findings are: (i) external stirring arrests phase separation (coarsening); (ii) our scale-by-scale analysis reveals that interfaces provide an alternative route for energy transfer and dissipation; (iii) for identical Reynolds number, a single-component fluid and a binary-fluid mixture have the same small-scale statistics.
The rest of the paper is organised as follows. We present the equations and the numerical method that we use in § 2. In §§ 3.1–3.3 we derive the equations for the total energy and the scale-by-scale kinetic energy budget, and present our numerical findings. In § 4 we investigate the small-scale statistics of the vorticity magnitude and the energy dissipation rate. We conclude in § 5.
2 Equations and direct numerical simulation (DNS)
We model a phase-separating symmetric binary-fluid mixture by using the Cahn–Hilliard–Navier–Stokes (CHNS) or Model-H equations (Cahn Reference Cahn1968; Hohenburg & Halperin Reference Hohenburg and Halperin1977; Celani et al. Reference Celani, Mazzino, Muratore-Ginanneschi and Vozella2009; Yue, Zhou & Feng Reference Yue, Zhou and Feng2010; Magaletti et al. Reference Magaletti, Picano, Chinappi, Marino and Casciola2013; Fan et al. Reference Fan, Diamond, Cahcon and Hui2016; Pandit et al. Reference Pandit, Banerjee, Bhatnagar, Brachet, Gupta, Mitra, Pal, Perlekar, Ray and Shukla2017; Perlekar et al. Reference Perlekar, Pal and Pandit2017):
 $$\begin{eqnarray}\displaystyle & \displaystyle (\unicode[STIX]{x2202}_{t}+\boldsymbol{u}\boldsymbol{\cdot }\unicode[STIX]{x1D735})\boldsymbol{u}=\unicode[STIX]{x1D708}\unicode[STIX]{x1D6FB}^{2}\boldsymbol{u}-\unicode[STIX]{x1D735}P+\unicode[STIX]{x1D6EC}\unicode[STIX]{x1D719}\unicode[STIX]{x1D735}\unicode[STIX]{x1D6FB}^{2}\unicode[STIX]{x1D719}+\boldsymbol{f}, & \displaystyle\end{eqnarray}$$
 $$\begin{eqnarray}\displaystyle & \displaystyle (\unicode[STIX]{x2202}_{t}+\boldsymbol{u}\boldsymbol{\cdot }\unicode[STIX]{x1D735})\unicode[STIX]{x1D719}=M\unicode[STIX]{x1D6FB}^{2}\unicode[STIX]{x1D707}, & \displaystyle\end{eqnarray}$$
 $$\begin{eqnarray}\displaystyle & \displaystyle \unicode[STIX]{x1D707}\equiv \unicode[STIX]{x1D6EC}\left(\frac{-\unicode[STIX]{x1D719}+\unicode[STIX]{x1D719}^{3}}{\unicode[STIX]{x1D709}^{2}}-\unicode[STIX]{x1D6FB}^{2}\unicode[STIX]{x1D719}\right), & \displaystyle\end{eqnarray}$$
 $$\begin{eqnarray}\displaystyle & \displaystyle \unicode[STIX]{x1D735}\boldsymbol{\cdot }\boldsymbol{u}=0. & \displaystyle\end{eqnarray}$$
Here
 $\unicode[STIX]{x1D719},\boldsymbol{u}$
and
 $P$
are the Cahn–Hilliard order parameter, the velocity and the pressure field at position
 $\boldsymbol{x}$
and time
 $t$
,
 $\unicode[STIX]{x1D708}$
is the kinematic viscosity,
 $M$
is the mobility,
 $\unicode[STIX]{x1D709}$
controls the width of the interface between the two phases,
 $\unicode[STIX]{x1D6EC}$
is the mixing energy density, the order-parameter diffusivity
 $\unicode[STIX]{x1D705}\equiv M\unicode[STIX]{x1D6EC}/\unicode[STIX]{x1D709}^{2}$
, the surface tension
 $\unicode[STIX]{x1D70E}\equiv 2\sqrt{2}/3(\unicode[STIX]{x1D6EC}/\unicode[STIX]{x1D709})$
and
 $\boldsymbol{f}$
is the external forcing that generates turbulence. The order parameter takes positive values in one phase and negative in the other. For simplicity, we assume the density (
 $\unicode[STIX]{x1D70C}=1$
), the viscosity
 $\unicode[STIX]{x1D702}$
and the mobility
 $M$
to be independent of
 $\unicode[STIX]{x1D719}$
and the same for the two phases (in the lattice–Boltzmann simulations of Perlekar et al. (Reference Perlekar, Benzi, Clercx, Nelson and Toschi2014), mobility depends on
 $\unicode[STIX]{x1D719}$
). The local vorticity
 $\unicode[STIX]{x1D74E}\equiv \unicode[STIX]{x1D735}\times \boldsymbol{u}$
. Note that the pressure
 $P$
also contains contributions due to the gradient terms in
 $\unicode[STIX]{x1D719}$
. We use a cubic domain with each side of length
 ${\mathcal{L}}=2\unicode[STIX]{x03C0}$
and discretise it with
 $N^{3}$
collocation points. We employ periodic boundary conditions. Equations (2.1) and (2.2) are numerically integrated using a pseudo-spectral method with
 $1/2$
-dealiasing and time marching is done using an exponential Adams–Bashforth scheme (Cox & Matthews Reference Cox and Matthews2002). A large-scale forcing
 $\hat{\boldsymbol{f}}_{\boldsymbol{k}}=f_{0}\hat{\boldsymbol{u}}_{k}/\sum _{k=1,2}|\hat{\boldsymbol{u}}_{k}|^{2}$
, where the caret indicates Fourier transform, with
 $|\boldsymbol{k}|\leqslant 2$
ensures a constant energy injection rate
 $\unicode[STIX]{x1D716}_{inj}=f_{0}$
.
2.1 Interface width
 $\unicode[STIX]{x1D709}$
and mobility
$M$


For an incompressible binary-fluid mixture such as
 $3$
-methylpentane-nitroethane (
 $3$
MP-NE),
 $\unicode[STIX]{x1D709}\approx 10^{-9}~\text{m}$
,
 $\unicode[STIX]{x1D70E}\approx 10^{-2}~\text{kg}~\text{s}^{-2}$
and the diffusivity
 $\unicode[STIX]{x1D705}$
is expected to be within an order of its value above the consolute temperature, i.e.
 $\unicode[STIX]{x1D705}\leqslant 10^{-12}~\text{m}^{2}~\text{s}^{-1}$
(Wims et al.
Reference Wims, Sengers, McIntyre and Shereshefsky1970; Aronovitz & Nelson Reference Aronovitz and Nelson1984; Pine et al.
Reference Pine, Easwar, Maher and Goldburg1984). Substituting these values in the definition of
 $\unicode[STIX]{x1D705}$
, we get an estimate for mobility
 $M=\unicode[STIX]{x1D705}\unicode[STIX]{x1D709}^{2}/\unicode[STIX]{x1D6EC}\sim 10^{-20}~\text{kg}^{-1}~\text{m}^{3}~\text{s}$
.
It is numerically prohibitive to use such vanishingly small
 $\unicode[STIX]{x1D709}$
and
 $M$
in CHNS equations. However, using an asymptotic analysis Magaletti et al. (Reference Magaletti, Picano, Chinappi, Marino and Casciola2013) found that for
 $\unicode[STIX]{x1D709}\ll {\mathcal{L}}$
and with
 $M\propto {\mathcal{L}}\unicode[STIX]{x1D709}^{3}/(\unicode[STIX]{x1D6EC}\unicode[STIX]{x1D70F}_{{\mathcal{L}}})$
(or equivalently
 $\unicode[STIX]{x1D705}\propto {\mathcal{L}}\unicode[STIX]{x1D709}/\unicode[STIX]{x1D70F}_{{\mathcal{L}}}$
), the solution of the CHNS equations is consistent with the ‘sharp-interface’ limit (
 $\unicode[STIX]{x1D709}\rightarrow 0$
and
 $M\rightarrow 0$
). Thus in all our numerical simulations we have used
 $\unicode[STIX]{x1D705}\approx 2.5({\mathcal{L}}/\unicode[STIX]{x1D70F}_{{\mathcal{L}}})\unicode[STIX]{x1D709}\approx 10^{-2}$
.
The flat-interface profile
 $\unicode[STIX]{x1D719}(\boldsymbol{x})=\tanh (x/\sqrt{2}\unicode[STIX]{x1D709})$
is an equilibrium solution of the CHNS equations. Following Jacqmin (Reference Jacqmin1999), we define the interface width
 $w=4.164\unicode[STIX]{x1D709}$
as the distance over which
 $\unicode[STIX]{x1D719}$
varies from
 $-0.9$
to
 $0.9$
. To have a fully resolved interface, in our direct numerical simulations we choose
 $\unicode[STIX]{x1D709}(\ll {\mathcal{L}})$
such that there are at least six grid points across the interface (Celani et al.
Reference Celani, Mazzino, Muratore-Ginanneschi and Vozella2009; Scarbolo et al.
Reference Scarbolo, Molin, Perlekar, Sbragaglia, Soldati and Toschi2013). Thus for a given grid spacing
 $\unicode[STIX]{x1D6FF}x\equiv {\mathcal{L}}/N$
, we set
 $\unicode[STIX]{x1D709}=6\unicode[STIX]{x1D6FF}x/4.164$
.
3 Results
The energy injection based Reynolds number
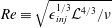 $Re\equiv \sqrt{\unicode[STIX]{x1D716}_{inj}^{1/3}{\mathcal{L}}^{4/3}/\unicode[STIX]{x1D708}}$
and Weber number
 $We\equiv \unicode[STIX]{x1D716}_{inj}^{2/3}{\mathcal{L}}^{5/3}/\unicode[STIX]{x1D70E}$
characterise the turbulence intensity of the flow. Table 1 summarises the parameters that we use. We present a grid convergence study for our high-
 $Re$
, high-
 $We$
run (SP24) in the Appendix. All the simulations were time integrated up to
 $t\approx 8T_{{\mathcal{L}}}$
(
 $T_{{\mathcal{L}}}\equiv \unicode[STIX]{x1D716}_{inj}^{-1/3}{\mathcal{L}}^{2/3}$
). We plot the time evolution of the viscous dissipation
 $\unicode[STIX]{x1D716}_{\unicode[STIX]{x1D708}}(t)=\unicode[STIX]{x1D708}\sum _{k}k^{2}|\hat{\boldsymbol{u}}_{\boldsymbol{k}}|^{2}$
in figure 1 and observe that a statistically steady state is attained for
 $t>2.5T_{{\mathcal{L}}}$
.
Time evolution of the viscous dissipation
 $\unicode[STIX]{x1D716}_{\unicode[STIX]{x1D708}}$
for a fixed
 $Re=96$
and different
 $We$
(runs
 $\mathtt{SP21},\mathtt{SP23}$
, and
 $\mathtt{SP24}$
).

Parameters
 $N,\unicode[STIX]{x1D708},\unicode[STIX]{x1D709},\unicode[STIX]{x1D705},\unicode[STIX]{x1D70E},Re,We,\unicode[STIX]{x1D716}_{inj},\unicode[STIX]{x1D716}_{\unicode[STIX]{x1D708}}$
, and
 $\unicode[STIX]{x1D716}_{\unicode[STIX]{x1D707}}$
for our binary-fluid DNS
 $\mathtt{SP11-13}$
and
 $\mathtt{SP21-24}$
. The
 $\mathtt{NS}$
runs are the DNS studies conducted for single-component Navier–Stokes fluid with the same
 $\unicode[STIX]{x1D708}$
and
 $\unicode[STIX]{x1D716}_{inj}$
as the binary fluid.

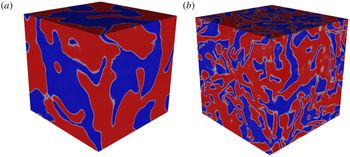
Pseudocolour plot of the order-parameter field
 $\unicode[STIX]{x1D719}$
for
 $Re=96$
,
 $We=26.9$
(a) and for
 $Re=96,We=107.9$
(b). Regions with
 $\unicode[STIX]{x1D719}=1(-1)$
are shown in red (blue). Average domain size decreases with increasing
 $We$
.

3.1 Domain size and energy balance
In figure 2 we plot representative snapshots of the steady-state order-parameter field
 $\unicode[STIX]{x1D719}$
for our runs
 $\mathtt{SP21}$
 $(Re=96,We=26.9)$
and
 $\mathtt{SP24}$
 $(Re=96,We=107.9)$
. We observe that the domain size in the emulsion decreases with increasing
 $We$
. From
 $\unicode[STIX]{x1D719}$
, we estimate the average domain size as
 $$\begin{eqnarray}\displaystyle L_{c}=2\unicode[STIX]{x03C0}\left\langle \frac{\displaystyle \mathop{\sum }_{\boldsymbol{k}}|\hat{\unicode[STIX]{x1D719}}_{\boldsymbol{k}}|^{2}}{\displaystyle \mathop{\sum }_{\boldsymbol{k}}k|\hat{\unicode[STIX]{x1D719}}_{\boldsymbol{k}}|^{2}}\right\rangle , & & \displaystyle\end{eqnarray}$$
where
 $k=\sqrt{\boldsymbol{k}\boldsymbol{\cdot }\boldsymbol{ k}}$
and angular brackets denote time averaging in the statistically steady state (Kendon et al.
Reference Kendon, Cates, Paganobarraga, Desplat and Bladon2001; Perlekar et al.
Reference Perlekar, Benzi, Clercx, Nelson and Toschi2014, Reference Perlekar, Pal and Pandit2017; Fan et al.
Reference Fan, Diamond, Cahcon and Hui2016). In figure 3(a) we present a plot of
 $L_{c}$
versus
 $\unicode[STIX]{x1D716}_{inj}^{2}/\unicode[STIX]{x1D70E}^{3}$
for different values of
 $Re$
and
 $We$
(see table 1). We find the data to be in good agreement with Hinze’s prediction for the average domain size in an emulsion
 $D\sim (\unicode[STIX]{x1D716}_{inj}^{2}/\unicode[STIX]{x1D70E}^{3})^{-1/5}$
.
(a) Semi-log plot of the domain scale
 $L_{c}$
versus
 $\unicode[STIX]{x1D716}_{inj}^{2}/\unicode[STIX]{x1D70E}^{3}$
(blue circle) and its comparison with the Hinze prediction for the domain scale (
 $D\sim (\unicode[STIX]{x1D716}_{inj}^{2}/\unicode[STIX]{x1D70E}^{3})^{-1/5}$
, black line). Inset: scatter plot of the domain scale
 $L_{c}$
versus
 ${\mathcal{L}}^{3}/{\mathcal{S}}$
(blue circle); black dashed line is the linear fit
 ${\mathcal{L}}^{3}/S=0.62L_{c}$
. (b,c)
 $\unicode[STIX]{x1D716}_{\unicode[STIX]{x1D708}}/\unicode[STIX]{x1D716}_{inj}$
(blue circle) and
 $\unicode[STIX]{x1D716}_{\unicode[STIX]{x1D707}}/\unicode[STIX]{x1D716}_{inj}$
(orange square) with varying Weber number
 $We$
for
 $Re=65$
(runs
 $\mathtt{SP11-13}$
) and
 $Re=96$
(runs
 $\mathtt{SP21-24}$
), respectively. Black line shows
 $\unicode[STIX]{x1D716}_{\unicode[STIX]{x1D707}}/\unicode[STIX]{x1D716}_{inj}\sim We^{1/5}$
scaling.

Geometrically the average domain size can be obtained by measuring the inverse of the interfacial area
 ${\mathcal{S}}$
per unit volume (Furukawa Reference Furukawa2000). We identify the interface as a region with
 $\unicode[STIX]{x1D719}=0$
and use the ‘GNU triangulation surface’ (GTS) library (Popinet & Jones Reference Popinet and Jones2004) to evaluate steady-state
 ${\mathcal{S}}$
. In the inset of figure 3(a) we show that
 $L_{c}\sim {\mathcal{L}}^{3}/{\mathcal{S}}$
. Thus a unique length scale describes the domain size.
We next investigate how much of the energy injected
 $\unicode[STIX]{x1D716}_{inj}$
is dissipated by the viscosity
 $\unicode[STIX]{x1D716}_{\unicode[STIX]{x1D708}}$
and how much is the contribution due to chemical potential
 $\unicode[STIX]{x1D716}_{\unicode[STIX]{x1D707}}$
. Using (2.1) and (2.2), we obtain the following energy balance equation:
 $$\begin{eqnarray}\displaystyle & \displaystyle \unicode[STIX]{x2202}_{t}\underbrace{\frac{1}{{\mathcal{L}}^{3}}\int \frac{|\boldsymbol{u}|^{2}}{2}\,\text{d}\boldsymbol{x}}_{{\mathcal{K}}}+\unicode[STIX]{x2202}_{t}\underbrace{\frac{1}{{\mathcal{L}}^{3}}\int \frac{\unicode[STIX]{x1D6EC}}{\unicode[STIX]{x1D709}^{2}}\left(-\frac{\unicode[STIX]{x1D719}^{2}}{2}+\frac{\unicode[STIX]{x1D719}^{4}}{4}+\frac{\unicode[STIX]{x1D709}^{2}}{2}|\unicode[STIX]{x1D735}\unicode[STIX]{x1D719}|^{2}\right)\text{d}\boldsymbol{x}}_{{\mathcal{G}}} & \displaystyle \nonumber\\ \displaystyle & \quad =-\underbrace{\frac{\unicode[STIX]{x1D708}}{{\mathcal{L}}^{3}}\int |\unicode[STIX]{x1D735}u|^{2}\,\text{d}\boldsymbol{x}}_{\unicode[STIX]{x1D716}_{\unicode[STIX]{x1D708}}}-\underbrace{\frac{M}{{\mathcal{L}}^{3}}\int |\unicode[STIX]{x1D735}\unicode[STIX]{x1D707}|^{2}\,\text{d}\boldsymbol{x}}_{\unicode[STIX]{x1D716}_{\unicode[STIX]{x1D707}}}+\underbrace{\frac{1}{{\mathcal{L}}^{3}}\int \boldsymbol{f}\boldsymbol{\cdot }\boldsymbol{u}\,\text{d}\boldsymbol{x}}_{\unicode[STIX]{x1D716}_{inj}}. & \displaystyle\end{eqnarray}$$
Here
 ${\mathcal{K}}$
is the kinetic energy,
 ${\mathcal{G}}$
is the free energy of mixing,
 $\unicode[STIX]{x1D716}_{\unicode[STIX]{x1D708}}$
is the viscous energy dissipation,
 $\unicode[STIX]{x1D716}_{\unicode[STIX]{x1D707}}$
is the dissipation because of the chemical potential (interfacial contribution due to breakup and merger of the domains) and
 $\unicode[STIX]{x1D716}_{inj}$
is the energy injected because of the external forcing. In the statistically steady state,
 $\langle \unicode[STIX]{x1D716}_{inj}\rangle \approx \langle \unicode[STIX]{x1D716}_{\unicode[STIX]{x1D708}}\rangle +\langle \unicode[STIX]{x1D716}_{\unicode[STIX]{x1D707}}\rangle$
. In figure 3(b,c) we show that for small
 $We$
, the viscosity is the primary dissipation mechanism,
 $\langle \unicode[STIX]{x1D716}_{\unicode[STIX]{x1D708}}\rangle \gg \langle \unicode[STIX]{x1D716}_{\unicode[STIX]{x1D707}}\rangle$
, whereas for large
 $We$
average domain size reduces and the merger and breakup events increase thereby making the interfacial contribution more dominant,
 $\langle \unicode[STIX]{x1D716}_{\unicode[STIX]{x1D707}}\rangle >\langle \unicode[STIX]{x1D716}_{\unicode[STIX]{x1D708}}\rangle$
. From (2.2), it is easy to show that in the steady state
 $\unicode[STIX]{x1D716}_{\unicode[STIX]{x1D707}}=\langle \int \boldsymbol{u}\boldsymbol{\cdot }\unicode[STIX]{x1D719}\unicode[STIX]{x1D735}\unicode[STIX]{x1D707}\,\text{d}\boldsymbol{x}/{\mathcal{L}}^{3}\rangle$
. Since
 $u\sim (\unicode[STIX]{x1D716}_{inj}{\mathcal{L}})^{1/3}$
and
 $\unicode[STIX]{x1D735}\unicode[STIX]{x1D707}\sim \unicode[STIX]{x1D70E}/D^{2}$
(Bray Reference Bray1994), we obtain the prediction
 $\unicode[STIX]{x1D716}_{\unicode[STIX]{x1D707}}/\unicode[STIX]{x1D716}_{inj}\sim We^{1/5}$
which is in reasonable agreement with the results obtained from our DNS.
3.2 Energy spectrum
The steady-state energy spectrum is defined as (Vincent & Meneguzzi Reference Vincent and Meneguzzi1991)
 $$\begin{eqnarray}\displaystyle E(k)=\frac{1}{2}\left\langle \mathop{\sum }_{k-1/2<k^{\prime }\leqslant k+1/2}|\hat{\boldsymbol{u}}_{\boldsymbol{k}^{\prime }}|^{2}\right\rangle . & & \displaystyle\end{eqnarray}$$
For high-Reynolds-number single-component turbulent flows, the energy spectrum shows Kolmogorov scaling
 $E(k)\sim k^{-5/3}$
in the inertial range (Kolmogorov Reference Kolmogorov1941; Frisch Reference Frisch1996). The energy spectrum obtained from our DNS runs
 $\mathtt{NS1}$
and
 $\mathtt{NS2}$
shows half a decade of scaling for
 $Re=65$
and nearly a decade of scaling for
 $Re=96$
(see figure 4).
We now investigate the energy spectrum for a turbulent binary-fluid mixture. It is important to note that our parameter choice ensures that the wavenumber corresponding to the interfacial width
 $k_{w}=2\unicode[STIX]{x03C0}/w$
(
 $k_{w}\unicode[STIX]{x1D702}>0.5$
) lies beyond the inertial range.
Energy spectrum for (a)
 $Re=65$
and (b)
 $Re=96$
for different values of
 $We$
. The horizontal dashed line indicates Kolmogorov scaling and the vertical dash-dot lines indicate the wavenumber corresponding to the average domain size
 $2\unicode[STIX]{x03C0}/L_{c}$
in the emulsion. Here,
 $\unicode[STIX]{x1D702}=(\unicode[STIX]{x1D708}^{3}/\unicode[STIX]{x1D716}_{\unicode[STIX]{x1D708}})^{1/4}$
is the viscous-dissipation scale.

For scales much larger and much smaller than the domain size
 $L_{c}$
, we expect the statistical properties of the binary fluid to be same as the single-component fluid. In particular, we expect Kolmogorov scaling for scales much larger than the domain size but smaller than the injection scale (
 $2\unicode[STIX]{x03C0}/\ell _{inj}\ll k\ll 2\unicode[STIX]{x03C0}/L_{c}$
). The energy spectrum should be modified for scales comparable to the domain size,
 $k\sim 2\unicode[STIX]{x03C0}/L_{c}$
, because of redistribution and dissipation of energy due to breakup and merger of domains. Finally, for scales much smaller than the domain size but larger than the dissipation scale (
 $2\unicode[STIX]{x03C0}/L_{c}\ll k\ll 2\unicode[STIX]{x03C0}/\unicode[STIX]{x1D702}$
) Kolmogorov scaling should be recovered. Unfortunately, because of the range of scales involved, it is computationally prohibitive to observe all these different regimes in a single DNS. We, therefore, vary the
 $We$
and
 $Re$
to access different regimes discussed above.
For low Weber number (
 $We=11.6,Re\approx 65$
and
 $We=26.9,Re\approx 96$
), the domain size
 $L_{c}\gg \unicode[STIX]{x1D702}$
and we observe that the energy spectrum follows its single-component counterpart and shows Kolmogorov scaling for
 $k>2\unicode[STIX]{x03C0}/L_{c}$
. For high Weber number (
 $We=116.2,Re\approx 65$
and
 $We=107.9,Re\approx 96$
), the domain size
 $L_{c}\ll \ell _{inj}$
. We find a reduction in the energy content around
 $k\approx 2\unicode[STIX]{x03C0}/L_{c}$
and it becomes comparable to the single-component spectrum for small
 $k$
. This indicates a possibility that the Kolmogorov scaling is recovered for
 $k\ll 2\unicode[STIX]{x03C0}/L_{c}$
. Clearly, numerical simulations with large scale separation and much higher spatial resolutions are required to investigate the recovery of Kolmogorov scaling for
 $2\unicode[STIX]{x03C0}/\ell _{inj}\ll k\ll 2\unicode[STIX]{x03C0}/L_{c}$
.
3.3 Scale-by-scale kinetic energy budget
To investigate how the kinetic energy is distributed up to a given length scale
 $\ell$
(or a corresponding wavenumber
 $k=2\unicode[STIX]{x03C0}/\ell$
), we now derive the scale-by-scale energy budget equation. By multiplying the Fourier-transformed (2.1) with
 $\hat{\boldsymbol{u}}_{-\boldsymbol{k}}$
, summing contributions up to wavenumber
 $k$
, and then averaging over statistically steady state we obtain
 $$\begin{eqnarray}\displaystyle \unicode[STIX]{x1D6F1}(k)=-{\mathcal{D}}(k)-\unicode[STIX]{x1D6F1}^{\unicode[STIX]{x1D719}}(k)+{\mathcal{F}}(k). & & \displaystyle\end{eqnarray}$$
Here
 $\unicode[STIX]{x1D6F1}(k)\equiv \langle \text{Re}[\sum _{|\boldsymbol{m}|\leqslant k}\hat{\boldsymbol{u}}_{\boldsymbol{m}}\boldsymbol{\cdot }\widehat{(\boldsymbol{u}\boldsymbol{\cdot }\unicode[STIX]{x1D735}\boldsymbol{u})}_{-\boldsymbol{m}}]\rangle$
is the energy flux,
 $\unicode[STIX]{x1D6F1}^{\unicode[STIX]{x1D719}}\equiv \unicode[STIX]{x1D6EC}\langle \text{Re}[\sum _{|\boldsymbol{m}|\leqslant k}\hat{\boldsymbol{u}}_{\boldsymbol{m}}\boldsymbol{\cdot }\widehat{(\unicode[STIX]{x1D719}\unicode[STIX]{x1D735}\unicode[STIX]{x1D6FB}^{2}\unicode[STIX]{x1D719})}_{-\boldsymbol{m}}]\rangle$
is the cumulative flux of
 $(\unicode[STIX]{x1D735}\unicode[STIX]{x1D719})^{2}$
,
 ${\mathcal{E}}(k)\equiv \sum _{m\leqslant k}E(m)$
is the cumulative energy up to wavenumber
 $k$
,
 ${\mathcal{D}}(k)\equiv \unicode[STIX]{x1D708}\sum _{m\leqslant k}m^{2}E(m)$
is the cumulative dissipation up to wavenumber
 $k$
and
 ${\mathcal{F}}(k)\equiv \langle \sum _{|\boldsymbol{m}|\leqslant k}\text{Re}[\hat{\boldsymbol{u}}_{-\boldsymbol{m}}\hat{\boldsymbol{f}}_{\boldsymbol{m}}]\rangle$
is the cumulative energy injected. Note that for the largest wavenumber
 $k_{max}=N/4$
, the scale-by-scale kinetic energy budget is the same as the kinetic energy balance because
 $\unicode[STIX]{x1D6F1}(k_{max})=0,{\mathcal{D}}(k_{max})=\unicode[STIX]{x1D716}_{\unicode[STIX]{x1D708}},\unicode[STIX]{x1D6F1}^{\unicode[STIX]{x1D719}}(k_{max})=\unicode[STIX]{x1D716}_{\unicode[STIX]{x1D707}}$
, and
 ${\mathcal{F}}(k_{max})=\unicode[STIX]{x1D716}_{inj}$
.
The plots in figure 5(a,b) show the scale-by-scale energy budget for
 $Re=65$
and
 $Re=96$
for a single-component fluid. The energy is injected at large scales by forcing
 ${\mathcal{F}}(k)$
and is dissipated by viscosity at small scales. The Navier–Stokes nonlinearity transfers the kinetic energy in the inertial range while keeping its flux
 $\unicode[STIX]{x1D6F1}(k)$
constant. For our high
 $Re=96$
run
 $\mathtt{NS2}$
, we observe a nearly constant
 $\unicode[STIX]{x1D6F1}(k)\sim \unicode[STIX]{x1D716}_{inj}$
for
 $2\leqslant k\leqslant 10$
which manifests as an extended inertial range in the energy spectrum (see figure 4
b).
We now show that for the binary-fluid case, the presence of emulsion domains dramatically alters the energy transfer mechanism. Firstly, for small
 $We$
we find that for large
 $k$
(
 $\gg 2\unicode[STIX]{x03C0}/L_{c}$
) the viscous dissipation
 ${\mathcal{D}}(k)$
is larger than the contribution due to interfacial flux
 $\unicode[STIX]{x1D6F1}^{\unicode[STIX]{x1D719}}(k)$
(figure 5
c,d) whereas it is the opposite for high
 $We$
(figure 5
e,f). Secondly, the interfacial flux
 $\unicode[STIX]{x1D6F1}^{\unicode[STIX]{x1D719}}(k)$
first increases up to a wavenumber corresponding to the arrest scale
 $k_{c}\approx 2\unicode[STIX]{x03C0}/L_{c}$
. Above
 $k>k_{c}$
,
 $\unicode[STIX]{x1D6F1}^{\unicode[STIX]{x1D719}}(k)$
decreases until large
 $k$
where it is equal to
 $\unicode[STIX]{x1D716}_{\unicode[STIX]{x1D707}}$
. This indicates that the interface undulations absorb kinetic energy
 ${\sim}\unicode[STIX]{x1D6F1}^{\unicode[STIX]{x1D719}}(k_{c})$
from large scales. However only part of it,
 $\unicode[STIX]{x1D716}_{\unicode[STIX]{x1D707}}$
, is dissipated and the excess energy
 ${\sim}\unicode[STIX]{x1D6F1}^{\unicode[STIX]{x1D719}}(k_{c})-\unicode[STIX]{x1D716}_{\unicode[STIX]{x1D707}}$
is redistributed among wavenumbers
 $k>k_{c}$
. Finally, the contribution because of the kinetic energy flux
 $\unicode[STIX]{x1D6F1}(k)$
is nearly halved in comparison to its single-component-fluid counterpart. Consistent with the discussion in the previous section, for
 $k>k_{c}$
we find a small range where
 $\unicode[STIX]{x1D6F1}(k)\sim \text{constant}$
for
 $k>k_{c}$
(see figure 5). Note that in figure 5(e) (run
 $\mathtt{SP13}$
,
 $Re=65$
, and
 $We=116.2$
) we do not observe a plateau region in
 $\unicode[STIX]{x1D6F1}(k)$
due to lack of scale separation (the contribution due to viscous dissipation is comparable to the energy flux around
 $k=2\unicode[STIX]{x03C0}/L_{c}$
).
For
 $k<k_{c}$
we find that
 $\unicode[STIX]{x1D6F1}(k)$
decreases with increasing
 $k$
and balances interfacial flux
 $\unicode[STIX]{x1D6F1}^{\unicode[STIX]{x1D719}}(k)$
. Indeed, much larger scale separation is required to verify if the Kolmogorov scaling is recovered for
 $2\unicode[STIX]{x03C0}/\ell _{inj}\ll k\ll k_{c}$
. Nevertheless, our study clearly shows that the presence of an interface opens up an additional mechanism for transferring kinetic energy from large scales to scales smaller than the average size of a domain in the emulsion.
Energy flux for (a)
 $Re=65$
(run
 $\mathtt{NS1}$
), (b)
 $Re=96$
(run
 $\mathtt{NS2}$
), (c)
 $We\approx 11.6,Re\approx 65$
(run
 $\mathtt{SP11}$
), (d)
 $We\approx 26.9,Re\approx 96$
(run
 $\mathtt{SP21}$
), (e)
 $We\approx 116.2$
,
 $Re\approx 65$
(run
 $\mathtt{SP13}$
), and (f)
 $We\approx 107.9,Re\approx 96$
(run
 $\mathtt{SP24}$
). The dashed vertical line indicate the wavenumber corresponding to the average domain size
 $2\unicode[STIX]{x03C0}/L_{c}$
.

4 Small-scale structures
We now investigate whether the different kinetic energy transfer mechanism in binary-fluid turbulence also alters the small-scale structures. In figure 6(a,b) we plot the statistics of the local viscous energy dissipation
 $\unicode[STIX]{x1D716}_{loc}=\unicode[STIX]{x1D708}\sum _{i,j}(\unicode[STIX]{x2202}_{i}u_{j}+\unicode[STIX]{x2202}_{j}u_{i})^{2}/2$
and the magnitude of the vorticity field
 $|\unicode[STIX]{x1D74E}|=\sqrt{\unicode[STIX]{x1D74E}\boldsymbol{\cdot }\unicode[STIX]{x1D74E}}$
for a binary-fluid mixture and compare it with a single-component fluid at the same
 $Re$
. We observe a reduction in the events with large values of
 $\unicode[STIX]{x1D716}_{loc}$
and
 $|\unicode[STIX]{x1D74E}|$
on increasing
 $We$
. However, the probability distribution functions (p.d.f.s) overlap when normalised by their standard deviations. Thus the small-scale statistics remains the same as that of a single-component turbulent fluid.
(a,b) Probability distribution function of the energy dissipation rate
 $P(\unicode[STIX]{x1D716}_{\unicode[STIX]{x1D708}})$
versus
 $\unicode[STIX]{x1D716}_{\unicode[STIX]{x1D708}}$
and the magnitude of the vorticity
 $P(|\unicode[STIX]{x1D714}|)$
versus
 $|\unicode[STIX]{x1D714}|$
for different
 $We$
. (c,d) Normalised p.d.f.s
 $P(\unicode[STIX]{x1D716}_{\unicode[STIX]{x1D708}})\unicode[STIX]{x1D70E}_{\unicode[STIX]{x1D716}}$
and
 $P(|\unicode[STIX]{x1D714}|)\unicode[STIX]{x1D70E}_{\unicode[STIX]{x1D714}}$
for different
 $We$
. We fix
 $Re=96$
(runs
 $\mathtt{SP21}$
,
 $\mathtt{SP24}$
). For comparison we also plot the corresponding p.d.f. for the pure fluid (run
 $\mathtt{NS2}$
).

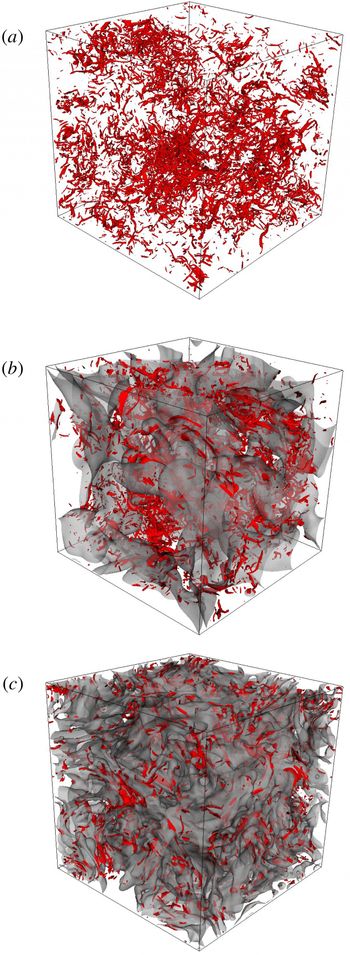
Representative steady-state iso-contour plots of the vorticity magnitude
 $|\unicode[STIX]{x1D714}|$
for
 $|\unicode[STIX]{x1D714}|=\bar{|\unicode[STIX]{x1D714}|}+6\unicode[STIX]{x1D70E}_{\unicode[STIX]{x1D714}}$
, where the overbar denotes spatial averaging. (a) Pure fluid with
 $|\unicode[STIX]{x1D714}|=1.123$
(run
 $\mathtt{NS2}$
), (b) a turbulent binary mixture with
 $We=26.9$
with
 $|\unicode[STIX]{x1D714}|=0.93$
(run
 $\mathtt{SP21}$
) and (c)
 $We=107.9$
with
 $|\unicode[STIX]{x1D714}|=0.76$
(run
 $\mathtt{SP22}$
). For the binary-mixture plots we also overlay the iso-contour of the order parameter
 $\unicode[STIX]{x1D719}$
for
 $\unicode[STIX]{x1D719}=0$
to highlight the interface.

To investigate the flow structures, in figure 7 we plot the iso-vorticity contours for a turbulent binary mixture as well as turbulence in pure fluid and overlay the
 $\unicode[STIX]{x1D719}=0$
contours on them to highlight the emulsion domains. For the single-component fluid, consistent with earlier studies (Ishihara, Gotoh & Kaneda Reference Ishihara, Gotoh and Kaneda2009; Pandit et al.
Reference Pandit, Perlekar and Ray2009), we observe tubular structures. For the case of a binary mixture, as shown earlier, smaller domains (more interfacial area) are formed as we increase
 $We$
. Also, near the interfacial region vorticity appears to be concentrated. Thus the interface undulations also generate flow structures whose statistics are similar to that of turbulence in a single-component fluid.
The local flow structures as observed by a Lagrangian fluid parcel in a turbulent flow can be quantified by the invariants
 $R\equiv -\text{Tr}(\unicode[STIX]{x1D63C}^{2})/2$
and
 $Q\equiv -\text{Tr}(\unicode[STIX]{x1D63C}^{3})/3$
of the velocity gradient tensor
 $\unicode[STIX]{x1D63C}\equiv \unicode[STIX]{x1D735}\boldsymbol{u}$
(Perry & Chong Reference Perry and Chong1987; Cantwell Reference Cantwell1992). The joint p.d.f.
 $P(R,Q)$
provides an understanding of the typical structures encountered in a turbulent flow. The discriminant
 $\unicode[STIX]{x1D6E5}\equiv 27Q^{3}/4+R^{2}$
demarcates the regions dominated by vortices (
 $\unicode[STIX]{x1D6E5}>0$
) from those that are dominated by strain (
 $\unicode[STIX]{x1D6E5}<0$
). To quantify whether the structures formed in pure-fluid turbulence are similar to or different from a turbulent binary mixture, in figure 8 we plot the joint p.d.f.
 $P(R,Q)$
for the pure-fluid turbulence as well as binary-fluid turbulence with
 $Re=96$
and
 $We=26.9,107.9$
. Although the qualitative features remain the same we observe a small but systematic shrinkage of the iso-contour lines with increasing
 $We$
.
Contour plots of the joint p.d.f.
 $P(R^{\ast },Q^{\ast })$
for pure-fluid turbulence (grey dots, run
 $\mathtt{NS2}$
) and binary-fluid turbulence with
 $We=26.9$
(blue line, run
 $\mathtt{SP21}$
),
 $We=107.9$
(red dashed line, run
 $\mathtt{SP24}$
). Here
 $R^{\ast }=\unicode[STIX]{x1D708}^{3/2}R/\unicode[STIX]{x1D716}_{\unicode[STIX]{x1D708}}^{3/2}$
and
 $Q^{\ast }=\unicode[STIX]{x1D708}Q/\unicode[STIX]{x1D716}_{\unicode[STIX]{x1D708}}$
. Contours are logarithmically spaced and separated by factors of
 $10$
. For all
 $We$
, the value of the outermost contour is
 $10^{-4}$
. The black curve is the
 $\unicode[STIX]{x1D6E5}=0$
line that demarcates regions with vortical
 $\unicode[STIX]{x1D6E5}>0$
or strain
 $\unicode[STIX]{x1D6E5}<0$
dominated flow structures.

5 Conclusions
We investigated turbulence in a stirred phase-separated symmetric binary-fluid mixture. Our study reveals that external stirring leads to the formation of a statistically steady emulsion. The Hinze scale provides an estimate for the average domain size. For a binary-fluid mixture, in comparison to a single-component fluid, kinetic energy content is reduced for length scales comparable to the domain size. We show that this is because the presence of interfaces opens up an alternative kinetic energy transfer mechanism. Emulsion domains absorb kinetic energy at scales comparable to the Hinze scale, dissipate part of it and redistribute the rest to small scales. Surprisingly, even with an alternative energy transfer mechanism, we do not find any qualitative change in the statistics of small-scale structures.
Our results bear a striking similarity with those of polymeric turbulence (Perlekar, Mitra & Pandit Reference Perlekar, Mitra and Pandit2006, Reference Perlekar, Mitra and Pandit2010; Valente, Silva & Pinho Reference Valente, Silva and Pinho2014). There also the presence of polymers modifies the energy transfer in the inertial range. This similarity could be attributed to a close correspondence between the CHNS equations and the equations for uniaxial polymers (Balkovsky, Fouxon & Lebedev Reference Balkovsky, Fouxon and Lebedev2001). However, a crucial difference is that the typical size of the polymer is in the dissipation range and they are homogeneously distributed throughout the flow, whereas the size of binary-fluid domains lies within the inertial range (Aronovitz & Nelson Reference Aronovitz and Nelson1984; Perlekar et al. Reference Perlekar, Benzi, Clercx, Nelson and Toschi2014; Fan et al. Reference Fan, Diamond, Cahcon and Hui2016).
Acknowledgements
We thank M. M. Bandi, M. Barma, D. Mitra, and F. Toschi for their comments and suggestions.
Appendix. Optimal grid resolution
To correctly capture the dynamics of a turbulent binary-fluid mixture it is essential to have both the interface
 $\unicode[STIX]{x1D709}$
as well as the dissipation range well-resolved. Thus to estimate optimal grid resolution, we conduct DNS for our largest-(
 $Re,We$
) run
 $\mathtt{SP24}$
with fixed length
 ${\mathcal{L}}$
and varying
 $N$
. Based on the criterion discussed in § 2.1, it is straightforward to show that for
 $\unicode[STIX]{x1D709}=1.88\times 10^{-2}$
, a grid resolution with
 $N\geqslant 482$
is needed to have a well-resolved interface. We perform DNS with
 $N=256,320,512$
and
 $1024$
and monitor the steady-state energy dissipation rate and the energy spectrum. We initialise the
 $N=1024$
configuration from an
 $N=512$
steady-state configuration and further time-integrate it for
 $2{\mathcal{T}}_{{\mathcal{L}}}$
.
Steady-state value of the viscous dissipation
 $\unicode[STIX]{x1D716}_{\unicode[STIX]{x1D708}}$
with different grid resolutions
 $N$
. The other parameter values are the same as our binary-fluid DNS
 $\mathtt{SP24}$
(see table 1).

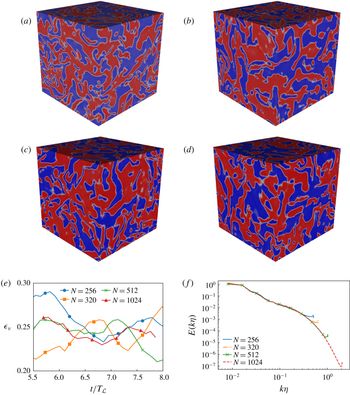
Grid convergence test for run
 $\mathtt{SP24}$
(
 $Re=96$
,
 $We=107.9$
). Pseudocolour plot of the order-parameter field
 $\unicode[STIX]{x1D719}$
with increasing grid resolution: (a)
 $N=256$
, (b)
 $N=320$
, (c)
 $N=512$
and (d)
 $N=1024$
; (e) time evolution of the viscous dissipation
 $\unicode[STIX]{x1D716}_{\unicode[STIX]{x1D708}}$
and (f) steady-state energy spectrum
 $E(k)$
versus
 $k$
.

In figure 9(a–d) we plot representative snapshots of the steady-state order-parameter field
 $\unicode[STIX]{x1D719}$
for different grid resolution. In all the cases the average domain size is correctly captured. However at the lowest grid resolution (
 $N=256$
), since interface is not well-resolved, we observe the presence of small-scale fluctuations. The viscous dissipation shows similar evolution for different grid resolutions (see figure 9
e). Indeed the steady-state viscous dissipation
 $\unicode[STIX]{x1D716}_{\unicode[STIX]{x1D708}}$
is comparable (see table 2) for all the cases. Next, in figure 9(f) we present a comparison of the steady-state energy spectrum
 $E(k\unicode[STIX]{x1D702})$
for different
 $N$
. Although the inertial-range behaviour is identical for all the runs, at low grid resolutions (
 $N=256$
and
 $N=320$
) we see a pile-up of energy at large
 $k$
which is a hallmark of under-resolved spectral simulations (Canuto et al.
Reference Canuto, Hussaini, Quarteroni and Zang1988). The energy spectrum for high-resolution runs (
 $N=512$
and
 $N=1024$
) is well-resolved and indistinguishable over the entire range. Since it is desirable to have a well-resolved energy spectrum and also long time integration, we conclude that
 $N=512$
provides an optimal grid resolution for
 $Re=96$
. A similar study reveals that for
 $Re=65$
,
 $N=256$
is sufficient.