Introduction
As the United States becomes more ethnically diverse, the need for culturally sensitive psychological assessment is increasing. When psychological assessment is used for diagnostic purposes in patients with ethnic backgrounds other than a group that a test was standardized for, differential sensitivity and specificity are a concern, as some ethnic groups perform differently on some neuropsychological tests, and they may also present with different prevalence rates of psychopathology and neurological disorders (Reynolds, Reference Reynolds2000). The use of demographically corrected normative data (Artiola i Fortuny, Hermosillo, Heaton, & Pardee, Reference Artiola i Fortuny, Hermosillo, Heaton and Pardee1999; Heaton, Miller, Taylor, & Grant, Reference Heaton, Miller, Taylor and Grant2004; Heaton, Taylor, & Manly, Reference Heaton, Taylor and Manly2003; Lucas et al., Reference Lucas, Ivnik, Smith, Ferman, Willis, Petersen and Graff-Radford2005; Ponton et al., Reference Ponton, Satz, Herrera, Ortiz, Urrutia, Young and Namerow1996) has been providing improved sensitivity and specificity of assessment measures in detecting cognitive impairment (Lucas et al., Reference Lucas, Ivnik, Smith, Ferman, Willis, Petersen and Graff-Radford2005; Manly, Reference Manly2005). One ethnic minority group that presents with a scarcity of empirical data is Asian Americans. Regardless of the need for race- and ethnicity-specific norms for Asian Americans and their subgroups, it is important to establish a knowledge base to guide efforts to provide culturally sensitive assessment and treatment for them. Because there is an increasing need for research in elderly and minority populations in our society (Longobardi, Cummings, & Anderson-Hanley, Reference Longobardi, Cummings and Anderson-Hanley2000), the current study elected to focus on older individuals of the Japanese American (JA) population, a relatively homogeneous subgroup of Asian Americans, by using neuropsychological instruments that are relevant in assessing the aging population.
The relative homogeneity of the JA community owes to their immigration history. Immigration from Japan began in the late 19th century (Azuma, Reference Azuma1999; Ichioka, Reference Ichioka1988). The Immigration Act of 1924 prohibited further immigration of Asians, until after the Second World War. The JA generations in the United States are often referred to by numbering them, such as, issei (the first generation), nisei (the second generation), sansei (the third generation), and so forth. The isseis were young adults at their arrival, and their clustered age distribution, combined with infrequent inter-ethnic marriage through the second generation, resulted in fairly discrete succeeding generations (Fujimoto et al., Reference Fujimoto, Bergstrom, Boyko, Kinyoun, Leonetti, Newell-Morris and Wahl1994). Although any Japanese individuals born in Japan who then immigrate to the United States are “first generation” by definition, the term “issei” is reserved for those who arrived in the 19th century. Post-war first generations are called “shin-issei” (literally, the new first generation).
A few sets of ethnicity-specific norms for cognitive measures widely used in the United States exist for individuals of Japanese ancestry (Boone, Victor, Wen, Razani, & Ponton, Reference Boone, Victor, Wen, Razani and Ponton2007). Those norms were derived from performance of monolingual Japanese individuals residing in Japan. Thus, with the exception of their applicability to very recent immigrants from Japan tested in the Japanese language, they are not appropriate for most JA individuals living in the United States. Among the studies that presented data on cognitive performance of elderly JA individuals residing in the United States (Fillenbaum et al., Reference Fillenbaum, McCurry, Kuchibhatla, Masaki, Borenstein, Foley and White2005; McCurry et al., Reference McCurry, Gibbons, Uomoto, Thompson, Graves, Edland and Larson2001), McCurry et al. reported that, when compared to performance of non-Hispanic white (NHW) Americans, JA individuals with education of less than 12 years scored lower for confrontation naming and memory for word list. The authors speculated that factors other than conventional demographic variables (i.e., age and education) might have affected the performance of JA adults. In fact, there are multiple factors to consider with regard to the interactions of culture and effects of demographic variables. First, observed differences in ethnic minority performance on some cognitive tests are reported to be partially explained by the quality of education (Manly, Jacobs, Touradji, Small, & Stern, Reference Manly, Jacobs, Touradji, Small and Stern2002). Different ethnic groups as well as various age groups within one ethnic group may receive education of different qualities due to cultural and historical reasons. Second, evidence indicates that some cognitive processes differ between individuals of different cultures due to experience and environment unique to each culture (Park & Gutchess, Reference Park and Gutchess2002), and that the impact of aging and culture may differ depending on the cognitive demand of tasks (Park, Nisbett, & Hedden, Reference Park, Nisbett and Hedden1999). Park and colleagues have shown, for example, that East Asian individuals have limited use of taxonomic category structure (Park et al., Reference Park, Nisbett and Hedden1999) and demonstrate more attention to the context of a visual object, while Westerners tend to attend to the focal object and are more affected by visual novelty (Goh, Tan, & Park, Reference Goh, Tan and Park2009), supporting a cultural bias in attention and cognitive processing. Neuroimaging results support differences in perceptual mechanisms and effortful processing, suggesting that culture may operate as a top-down mechanism that interfaces with neural processing of perceptual and cognitive information (Hedden, Ketay, Aron, Markus, & Gabrieli, Reference Hedden, Ketay, Aron, Markus and Gabrieli2008; Goh et al., Reference Goh, Tan and Park2009). It is, therefore, of interest to assess sociocultural and educational characteristics of JA adults to help interpret their cognitive performance.
The current study aimed to expand the knowledge base of cognitive performance of JA adults by having its own age- and education-matched control group, and by investigating impact of acculturation and generation status. Specifically, we sought to examine (a) systematic group differences between performance of JA and NHW adults, (b) the comparability of the relationships between demographic variables (i.e., age, education, and gender) and test scores between the two groups, (c) the impact of the levels of acculturation and generation status on test performance within the JA sample, and (d) the applicability of the existing normative dataset for the JA individuals. We hypothesized that JA adults would score lower than NHW adults, and more acculturated JA adults, and the later generation (i.e., third generation) would score higher, on the cognitive tests after controlling for the basic demographic variables.
Methods
Participants
Sixty-five self-identified Japanese American (JA) and 65 non-Hispanic white American (NHWs) adults, ages between 45 and 91 years, participated in the study. Any human data included in this manuscript were obtained in compliance with regulations of our institutions and research was completed in accordance with the guidelines of the Helsinki Declaration.
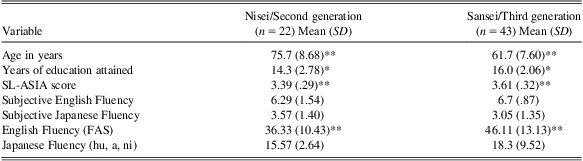
The two groups were matched to the extent possible in terms of age and years of education (see Supplement 1). Recruitment of older JA female participants was more difficult than the NHW counterparts, and we were unable to perfectly match the JA's gender ratio (67% male) to that of the NHW's (56% male) in the older age group (70 and up). Exclusion criteria were known history of neurological or psychiatric illness, substance use disorders, learning disability, or head trauma with loss of consciousness greater than 5 min. JA participants were asked to rate their fluency in English and Japanese, using a scale of 1 (“little to no knowledge”) to 7 (“like a native speaker”). Only those who indicated greater fluency in English were included in the current study. Proportions of JA participants who indicated knowledge of the Japanese language were 71.4% and 44.2%, for the second and third generations, respectively. Second generation individuals generated more words on verbal fluency in English, t(36) = −2.681, p = .009. Japanese American participants’ relative greater fluency in English can be appreciated by their low Japanese letter fluency performance (Table 1). This particular version of a letter fluency test (Abe et al., Reference Abe, Suzuki, Okada, Miura, Fujii, Etsurou and Yamadori2004) asks the participant to generate words that start with the Japanese single letters “hu,” “a,” “ni.” Abe et al. report that the mean number of words generated for 45–54 years old, 55–64 years old, and 65–74 years old in the normative sample were 28.1 (SD 9.0), 31.8 (SD 8.7), and 22.1 (SD 8.4), respectively.
Characteristics of Japanese American participants by generation status
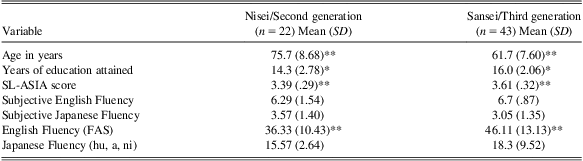
Note. Subjective fluency ratings are based on a 7-point Likert scale. English and Japanese fluency scores are raw scores, i.e., the number of words generated during 1 minute. * and ** denote statistical significance at p < .05 and p < .01, respectively.
SL-ASIA = Suinn-Lew Asian Self-Identity Acculturation Scale.
Assessment
Participants were administered the following cognitive tests as part of a larger test battery: 60-item Boston Naming Test-2 (BNT; Kaplan, Goodglass, & Weintraub, Reference Kaplan, Goodglass and Weintraub1983); Letter Fluency (FAS) and Semantic (animal) Fluency; California Verbal Learning Test (CVLT; Delis, Kramer, Kaplan, & Ober, Reference Delis, Kramer, Kaplan and Ober1987); Brief Visuospatial Memory Test-Revised (BVMT-R; Benedict, Reference Benedict1997); and Trail Making Test, Part A and Part B (Trails A and Trails B, Reitan & Wolfson, Reference Reitan and Wolfson1985).
The levels of acculturation of the JA individuals were assessed with the Suinn-Lew Asian Self-Identity Acculturation Scale (SL-ASIA; Suinn, Rickard-Figueroa, Lew, & Vigil, Reference Suinn, Rickard-Figueroa, Lew and Vigil1987), a widely used instrument for assessing acculturation among Asian American individuals (Abe-Kim, Okazaki, & Goto, Reference Abe-Kim, Okazaki and Goto2001) with adequate reliability (.91; Suinn, Ahuna, & Khoo, Reference Suinn, Ahuna and Khoo1992) and concurrent validity (Abe-Kim et al., Reference Abe-Kim, Okazaki and Goto2001; Suinn et al., Reference Suinn, Ahuna and Khoo1992; Suinn et al., Reference Suinn, Rickard-Figueroa, Lew and Vigil1987). This measure yields an overall acculturation score, ranging from 1 (low acculturation) to 5 (high acculturation).
Based on the past literature, the Wide Range Achievement Test-4 (WRAT4), Reading and Math Computation subtests (Wilkinson & Robertson, Reference Wilkinson and Robertson2006) were administered as measures of quality of education, to be included as potential covariates.
Procedures
Participants were individually invited to the assessment at the Lifespan Human Senses Laboratory at San Diego State University. Data collection complied with the regulations of the institution's Institutional Review Board. All the instruments were administered according to the published manuals, except for the BNT, for which all the 60 items were administered. The following raw scores were used in the analyses of the current study: the number of spontaneously produced correct responses (score range, 0 to 60) for the BNT; the total number of responses for Letter Fluency (F, A, and S combined); the total number of responses for Semantic Fluency; List A Total Trials 1–5 (CVLT Total; score range 0 to 80) and List A Long-Delay Free Recall (CVLT LDFR; score range 0 to 16) for the CVLT; Total Recall (BVMT-R TR; score range 0 to 36), and Delayed Recall (BVMT-R DR; score range 0 to 12) for the BVMT-R; and time required for completion (in seconds) for Trails A and B.
Data Analysis
All variables were screened for outliers, normality of distribution, and potential multicollinearity before analysis. Bivariate correlation coefficients were evaluated at an alpha level of .05 to examine relationships between the demographic variables and cognitive test scores, separately for the two ethnic groups. The following statistical analyses were then conducted, with alpha of .01 to achieve a balance between committing the Type I and Type II errors.
For the test of ethnic differences, hierarchical regression was used, as it allowed us to examine the additional contribution of ethnic group membership above and beyond basic demographic variables (i.e., age, education, gender). Hierarchical regression analyses were conducted predicting each test score with a combination of significant (at an alpha of .05) basic demographic variables (age, education, and gender; dummy coded as 0 for women and 1 for men) at step 1, and ethnicity (dummy coded as 0 for NHW and 1 for JA) at step 2. To examine the relationships between demographic variables and test scores of the two groups, interactions of age by ethnicity, and education by ethnicity were investigated with hierarchical regression analyses. Continuous predictors (age and education) were first mean-centered. Then, predictor variables were entered at step 1, followed by an interaction term at step 2. Interaction of gender by ethnicity was investigated by analyses of variance (ANOVAs), with ethnicity and gender as between-subject factors. Since there were significant associations between age and education, education-corrected Z-scores were used when the effect of age was examined, and age-corrected Z-scores were used when the effect of education was examined. Furthermore, due to a significant association between age and gender in the JA group, age-corrected Z-scores were used to examine the effect of gender. Then, scores of our participants who were within the age range for the normative datasets were converted to demographically corrected t scores based on the existing Caucasian normative dataset (Heaton et al., Reference Heaton, Miller, Taylor and Grant2004) for the BNT, CVLT Total, CVLT LDFR, Letter Fluency, Semantic Fluency, Trails A, and Trails B, and based on the standardization sample for the BVMT-R (not education- and gender-adjusted), to examine whether the group mean t scores and the percentage of people classified as “impaired” (defined here as t score less than 40, a commonly used cut-point that has been demonstrated to provide an optimal balance between sensitivity and specificity) would differ between the two ethnic groups. To examine the impact of levels of acculturation within the JA group, bivariate regression analyses were conducted with the SL-ASIA score as a predictor and test scores as criterion variables, followed by hierarchical regression with significant basic demographic variables at step 1, and the SL-ASIA score at step 2. Additional regression analyses were performed to investigate the effects of generation status, independently and after covarying for basic demographic variables. Correlation coefficients between the SL-ASIA and cognitive scores were calculated separately for the second- and third-generation JA adults.
Results
Demographic Information
For all participants, the mean age was 66.0 ± 10.5 in the JA and 65.5 ± 10.0 in the NHW, and the mean years of education was 15.4 ± 2.4 in the JA and 15.3 ± 2.1 in the NHW (see Supplement 1). As expected from the immigration history, the third generation was younger than the second generation, t(63) = 6.693, p < .001. The majority (63 of 65) of the JA participants were U.S.-born. Thus, years of residence in the United States was excluded from further analyses due to its strong correlation with age (r = .968). Similarly, the majority (60 of 65) of the participants received all of their education in the United States, resulting in a high correlation between the total years of education and years of education in the United States (r = .880). Thus, years of education in the United States was also excluded from further analyses. There was a statistically significant correlation between age and the number of years of education attained in the JA sample (r = −.401, p = .001), as well as a group difference between the second and the third generations (t[33.09] = −2.436; p = .020), indicating that younger JA adults have attained more years of formal education. The mean score of the SL-ASIA was 3.5 (SD = .32), a level of acculturation comparable with a past study of JA participants in southern California (Iwamasa, Pai, Hilliard, & Lin, Reference Iwamasa, Pai, Hilliard and Lin1998). Correlation analyses revealed statistically significant relationships between the SL-ASIA score with age (r = −.35; p = .002), as well as lower SL-ASIA score in the second generation relative to the third (t[63] = −2.734; p = .008), indicating older and earlier-generation JA participants self-reported lower levels of acculturation.
Cognitive Test Scores
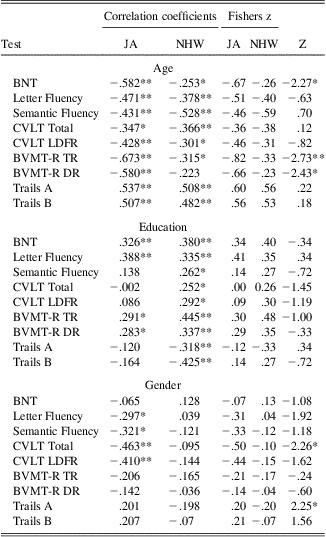
Table 2 presents the correlation coefficients between the demographic variables (age, education, and gender) and test scores within each ethnic group. The means and standard deviations of raw test scores can be found in Supplement 2.
Comparison of correlations between test scores and demographic variables (age, education, gender) in Japanese Americans and Non-Hispanic white Americans

Note. * and ** denote statistical significance at p < .05 and p < .01, respectively.
JA = Japanese Americans; NHW = Non-Hispanic White Americans. BNT = Boston Naming Test; CVLT = California Verbal Learning Test; LDFR = Long Delay Free Recall; BVMT-R = Brief Visuospatial Memory Test Revised; TR = Total Recall; DR = Delayed Recall; Trails A = Trail Making Test Part A; Trails B = Trail Making Test Part B.
Age significantly correlated in the expected direction with all test scores that were selected for the analyses in the JA group, and all but BVMT-R Delay in the NHW group. Stronger negative correlations in JA compared to NHW adults were observed in the BNT, BVMT-R Total, and BVMT-R Delay. Educational attainment (in years) was significantly positively correlated with the BNT, Letter Fluency, BVMT-R Total, and BVMT-R Delay in both groups. Additionally, education was positively correlated with CVLT LDFR, and Semantic Fluency, and negatively correlated (i.e., the higher the education, the faster the performance) with the Trails A and B in the NHW group, but not in the JA group. However, the difference in the strength of those associations did not reach significance at an alpha of .01. In the JA group, gender significantly correlated with performance on the verbal list-learning test (CVLT), and the verbal fluency measures (both phonemic and category). The JA group demonstrated a stronger association between gender and the verbally oriented memory measure (CVLT Total) with women scoring higher than men.
Bivariate regression analyses with each demographic variable, WRAT4, and SL-ASIA as a predictor (see Supplement 3) indicated the following. Age accounted for 12 to 45% of the variance of cognitive test scores in the JA group. Gender predicted verbally mediated test scores in the JA group, with females outperforming males. The WRAT4 Math Computation score was a strong predictor of the test scores in the JA group, explaining 6% to 43% of the variance. WRAT4 reading score on the other hand predicted fewer measures in both groups compared to WRAT4 Math Computation score.
Added Effects of Ethnicity
A series of regression analyses indicated that ethnic membership was not a significant predictor, either by itself (R2 ranged from 0 to .008; p > .50) or after controlling for other demographic variables (R2 ranged from 0 to .009; p > .50), in any of the test measures administered in this study.
Interaction of Basic Demographics and Ethnicity
The correlation analyses described above indicated that there was a statistically significant difference between the two groups in the magnitude of associations between some of the demographic variables and the test scores. Thus, interaction of basic demographic variables and ethnicity was formally tested (see Supplement 4 and Supplement 5). When the two ethnic groups were analyzed together, age was a significant predictor of all the test scores examined. The partial regression coefficients for the interaction term of age and ethnicity was approaching statistical significance in the BNT and the BVMT-R TR, indicating that the relationship between age and test scores tended to differ as a function of ethnicity. As shown earlier, age, when evaluated at alpha of .01, was significantly and negatively associated to the scores in JA for both BNT and BVMT-R TR (β = −.229; p < .001; R2 = .339, and β = −.521; p < .001; R2 = 453, respectively) but not in NHW. This indicates age-related decline in these tests was steeper in JA than NHW. Additional analyses comparing ethnicity-score relationship at younger (50), medium (65), and older (80) age values indicated that, on the BNT, JA tended to score lower than NHW at the older age (b = −2.58; p = .012). On the BVMT-R TR, JA adults tended to score higher than NHW at the younger age (b = 4.86; p = .026). No significant education-ethnicity interaction was observed for the tests that were administered. For gender, the ANOVA revealed that the main effect of gender was significant for verbal learning (CVLT Total and CVLT LDFR). Interaction of gender and ethnicity was a trend (p = .014) for CVLT Total. This was due to JA men tending to score lower than JA women (F = 17.18; p < .001), and than NHW men (F = 5.20; p = .026).
Rate of Impairment
Chi-square independent tests indicated that the pattern of distribution of “impairment” was not statistically different between the two groups (see Supplement 6), except for the marginally significant asymmetry on Trails B (χ2(1, N = 127) = 6.123; p = .013). When the impairment rates were compared against the expected value within the normal distribution (i.e., 15.6% impairment rate), a statistically larger proportion of JA participants were classified as “impaired” on the CVLT Total (χ2(1, N = 64) = 11.905; p < .001). The JA performance on the BNT also showed a tendency for asymmetrically larger rate of impairment (χ2(1, N = 64) = 4.249; p = .039). When rates of impairment were calculated separately for the two genders within the JA group, a higher percentage of JA men tended to be classified as “impaired” on the CVLT Total compared to JA women (χ2(1, N = 64) = 4.55; p = .033), and on the CVLT LDFR compared to NHW men, (χ2(1, N = 64) = 3.61; p = .058), using the available Caucasian norm.
Relationship of Acculturation to Test Performance
Earlier analyses (see Supplement 3) revealed that the SL-ASIA score was a marginally significant predictor of the BNT (R2 = .095; p = .014), Letter Fluency (R2 = .073; p = .008), and Semantic Fluency (R2 = .063; p = .015) scores, indicating that more acculturated individuals scored higher on these measures that are considered more culture-laden than non-verbal and visuospatial tasks. However, the association of the SL-ASIA and cognitive test scores was attenuated once controlling for other basic demographic variables.
Other Exploratory Analyses
SL-ASIA and generation
When correlations between the SL-ASIA score and cognitive test scores were evaluated separately for the second and third generation JA participants, the third generation showed a significant correlation in BNT (r = .36; p = .02). However, the association between the SL-ASIA score and verbal fluency measures were no longer significant once the JA participants were subdivided into different generations.
Generation status
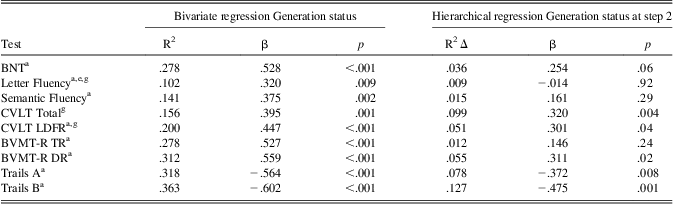
Regression analyses (Table 3) indicated that the generation status was a significant predictor of the scores on all the tests, with third generation individuals performing better than second generation individuals. After controlling for significant demographic variables, the association between generation status and test score was attenuated on many of the tests, but remained significant for CVLT Total, Trails A and B, and marginally significant for CVLT LDFR and BVMT-R DR. The effects of generation status were not attenuated after entering WRAT4 scores before entering generation status. A larger proportion of the second-generation individuals (see Supplement 6) tended to be classified as “impaired” on BVMT-R TR (χ2(1, N = 58) = 6.843; p = .026), BVMT-R DR (χ2(1, N = 58) = 8.320; p = .008), and Trial A (χ2(1, N = 58) =5.725; p = .017). Given this impact of generation, effects of ethnic membership on test scores were examined again only with the third generation JA participants (n = 43) and age- and education-matched NHW adults (n = 43), to explore the possibility that younger generation JA adults may perform better than NHW adults. The results indicated that ethnic membership did not explain additional variance after controlling for demographic variables, except for Trails B, where ethnicity explained a marginally significant amount of variance (R2 change = .51; F = 5.06; p = .027) above and beyond years of education.
Proportion of Variance Explained by Generation Status Independently and After Covarying for Significant Basic Demographic Variables
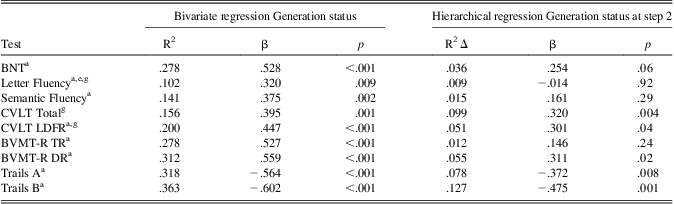
Note. Bivariate regression R2 = Proportion of variance accounted for by generation status; Step 1 R2 = Proportion of variance accounted for by significant basic demographic variables (indicated by superscripts a = age, e = education, g = gender) when entered as a set; R2 Δ = increase in the amount of variance accounted for by adding generation status at step 2.
BNT = Boston Naming Test; CVLT = California Verbal Learning Test; LDFR = Long Delay Free Recall; BVMT-R = Brief Visuospatial Memory Test Revised; TR = Total Recall; DR = Delayed Recall; Trails A = Trail Making Test Part A; Trails B = Trail Making Test Part B.
Discussion
The present study demonstrated the importance of examining the ethnic group differences in the impact of demographic variables on test scores, even when there is no mean difference in the test scores between the two ethnic groups. The results indicated that age, education, and gender were important predictors of cognitive performance in JA adults, similar to other ethnic groups. Age had the most prominent effect, showing strong associations with all the test scores. JA participants in this study showed stronger age-score correlations in confrontation naming, and learning and immediate memory for visually presented figures (BVMT-R TR) relative to NHW adults, and than other ethnic minorities in some past studies (Byrd, Sanchez, & Manly, Reference Byrd, Sanchez and Manly2005; Manly, Byrd, Touradji, & Stern, Reference Manly, Byrd, Touradji and Stern2004). It is possible that the makeup of the JA population caused the age-score correlation to be stronger, that is, due to age being inherently associated with the years of education, and with the generation status. Education correlated with the test scores less frequently compared to age. Gender was significantly associated with JA's performance on the verbal memory task (CVLT), with females outperforming males, a finding that is consistent with the previous literature with JA individuals (McCurry et al., Reference McCurry, Gibbons, Uomoto, Thompson, Graves, Edland and Larson2001), and with the CVLT standardization sample.
The past literature on cognitive performance of African and Hispanic Americans has consistently demonstrated that ethnic minority individuals tended to score lower compared to NHW individuals. In the current study, ethnic membership was not a significant predictor of cognitive test scores in terms of its overall impact. The lack of overall group difference may be partly explained by the quality of education. Past studies indicate that lower scores of African American individuals were partially explained by the difference in quality of education between the African American and NHW adults. Manly et al. (Reference Manly, Jacobs, Touradji, Small and Stern2002) found approximately 1 SD difference in the academic achievement test scores as measured by the earlier version of the WRAT between the two groups, which attenuated the ethnicity effects. In contrast, JA participants in the current study did not show such differences in the academic achievement (WRAT4) scores from NHW adults.
Within the JA group, “generation status” was a more important variable than the levels of acculturation. Acculturation, when assessed for its independent effect on test scores of JA participants, was a significant predictor for verbal fluency measures and visual confrontation naming. However, similar to Manly et al. (Reference Manly, Byrd, Touradji and Stern2004), acculturation no longer predicted test scores after covarying for other basic demographic variables. On the other hand, generation status continued to explain additional variance, even after controlling for demographic variables, on CVLT Total, Trails A, and Trails B. This may be because generation status carries a combined impact of age, acculturation level, and education within the current JA population. In our sample, the second generation had fewer years of education and was less acculturated than the third generation. It is of note that the impact of generation status did not attenuate after the quality of education was considered. Therefore, we speculate that other cultural factors that we did not measure may be at work, such as culturally specific experiences and environment of earlier generations of immigrants from Japan affecting their cognitive processes. For instance, studies suggest East Asian individuals have limited use of taxonomic category structure (Park et al., Reference Park, Nisbett and Hedden1999) and age-related decline may be steeper in a task that requires such strategies, which may have resulted in the lower performance of second-generation JA adults on verbal list learning (CVLT Total) in the current study. On the other hand, the pattern seen in the visual memory task (BVMT-R) may be an example of “a culturally saturated” task in which younger generations show cultural differences, while aging populations of the two different cultures would show convergence in their performance.
Clinical Implications
The current study provides useful information on assessing JA individuals clinically. First, behaviorally, it was noted by the examiners that JA participants were less vocal about their experience during testing (e.g., frustration). This may lead to differential behavior on the examiner's side, such as, not providing encouragement when needed. Second, in terms of background history taking, some older JA adults had their education disrupted due to internment camps during the war. It is a sensitive subject matter in terms of rapport building.
On the BNT, older (age 80) JA participants tended to score lower. There was not a concerning discrepancy in the rate of impairment between the two ethnic groups, or between the second and third generation JA participants, when using the Caucasian-based norm.
With regard to memory measures, there was a stronger age-score relationship on the BVMT-R TR in JA than NHW counterparts. Half of the second-generation participants were classified as “impaired” on visuospatial memory measures (BVMT-R TR and DR), a rate much higher than the expected rate (i.e., 15.6%). It is notable that the age-by-ethnicity interaction was observed in this visual memory test, which is typically conceptualized to be more robust for cultural or ethnic influences than language based tests. JA participants showed stronger age-score correlations compared not only to the NHW counterparts in the current study, but also to the mono-lingual Spanish speakers who showed correlation coefficients of −.20 for Total recall, and −.23 for Delayed recall (Cherner et al., Reference Cherner, Suarez, Lazzaretto, Artiola i Fortuny, Mindt and Dawes2007). With regard to verbal memory, more JA adults were classified than NHW adults as “impaired” on the CVLT Total. Generation status explained a measureable amount of variance above and beyond what age and gender accounted for in the CVLT. The extent of the gender discrepancy was larger in the JA individuals and our results indicate that caution is required when interpreting performance of JA men and early generation individuals on the CVLT.
For the Letter Fluency Test, acculturation level explained a measurable, though not significant proportion of variance after covarying for age and education. Although not statistically significant, a considerably larger proportion of the second generation scored below a t score of 40 on the Letter Fluency and Semantic Fluency than did the third generation.
For the Trail Making Test, a significantly smaller % of JA participants were classified as “impaired” on Trails B compared to NHW adults, when using the age- and education-corrected normative dataset for NHW adults. Further analyses indicated that the generation status explained a significant amount of variance in both Trails A and B among JA participants, with a larger proportion of second generation classified as impaired relative to the third generation. We may need to be careful when assessing the third and younger generations of JA individuals, as we may underestimate the rate of impairment.
Finally, at least for the current aging population, asking the generation status of a JA individual appears to be a more meaningful question that would yield much more relevant information for interpretation of neuropsychological test results, than assessing levels of acculturation, as the SL-ASIA mostly captured generation differences and not much within-generation variability in the levels of acculturation.
Conclusion
Our results indicate that it is important to investigate interactions of ethnic group membership and other demographic variables, even when there is no group difference. Our analyses indicated that age-score relationships differed between the two ethnic groups on BNT and BVMT-R TR. It is not clear at this time if these patterns will persist in the future generations to come, or if the difference would be attenuated as the JA population becomes more assimilated into the mainstream culture. Longitudinal studies to examine the age-related cognitive changes over time may help clarify a presence of ethnicity specific cognitive aging processes, if they exist.
Despite the novel and unique contribution of the study, limitations need to be noted. The first is sample representation and participant selection. The majority of the participants being descendants of immigrants in the late 1800s, the results may not generalize to more recent immigrants who may possess different characteristics, due to factors such as lessened degree of racism in the society, and increasing inter-ethnicity marriage. The study did not include individuals with low education, and there was some gender bias in the older group (60% men 65 years old and above, as opposed to 34% men based on the census data in this ethnic group). The eligibility criteria were based on self-report of the participants, and not assessed by structured interview. It is possible that individuals with subclinical dementia may have been included in this study, whose cognitive decrement might have been masked by relatively high years of education. We also note that the current results may not be applicable to other Asian American subgroups with different immigration histories, cultures, and languages. Finally, our use of the CVLT, instead of the second edition of the CVLT (CVLT-II), may be a confound for the gender effect observed. However, we hypothesize that the gender effect would remain even with the CVLT-II, given that JA men tended to score lower than the control NHW men. Despite these limitations, the current study indicates the importance of the interactions of aging and cultural background, which inspires clinical work as well as future neuroscientific investigation on the mechanisms supporting these differences.
ACKNOWLEGMENTS
We thank Jeanne Elyea, Mildred Kawasaki, Gwen Momita, Miyo Reff, Steve Sato, Joyce Teague, and all those involved in the Japanese American Historical Society of San Diego, Japanese American Citizens League, the Buddhist Temple of San Diego, Kiku Gardens, the Pioneer Ocean View United Church, and the Japanese Friendship Garden, for their assistance in participant recruitment. We thank Catherine Sumida, Susy Bonilla, Adeleine Conanan, Miki Ishikawa, and Bonnie Aguiar for research assistance, and Robert K. Heaton and David P. Salmon for advice. There are no conflicts of interest to declare. Information in this manuscript and the manuscript itself has never been published either electronically or in print. Supported by NIH grant #AG004085-26 from the National Institute on Aging to CM.
Supplementary material
To view supplementary material for this article, please visit http://dx.doi.org/10.1017/S1355617713000520.