I. INTRODUCTION
ZnO-based oxide semiconductors have been extensively attracted for large-scale thin-film transistor (TFT) switching devices because they have exhibited a good and uniform device performance as compared with Si-based TFTs.Reference Frenzel, Lajn, von Wenckstern, Lorenz, Schein, Zhang and Grundmann1 Especially, ZnO has superior physical and chemical properties such as a large field-effect mobility, a high transparency in the visible spectrum, and a environmental stability.Reference Ozgur, Alivov, Liu, Teke, Reshchikov, Dogan, Avrutin, Cho and Morkoc2 Recently, amorphous oxide TFTs such as InZnO,Reference Lee and Paine3 ZnSnO,Reference Chiang, Wager, Hoffman, Jeong and Keszler4, Reference Seo, Choi, Hwang and Bae5 and InGaZnOReference Nomura, Ohta, Takagi, Kamiya, Hirano and Hosono6–Reference Jeong, Jeong, Yang, Park, Mo and Kim8 with heavy metal cations like In and Sn have been reported since the overlap of spherical s-orbitals in heavy metal cations with (n−1)d 10ns 0 (n ≥ 5) electronic configuration was expected to contribute an improvement of electron mobility.Reference Nomura, Ohta, Takagi, Kamiya, Hirano and Hosono6 However, these oxide-based TFTs have an intrinsic instability of devices that the electrical characteristics of TFT devices under gate bias stressReference Sung, Choi, Han, Lee, Lee, Kim, Lim, Pearton, Norton and Heo7, Reference Jeong, Song, Kim, Koo and Moon9, Reference Jeong, Bae, Kim, Song, Woo, Shin, Cao and Moon10 and photo stressReference Maeng, Park, Kim, Lee, Park, Son, Kim, Kim, Ham, Ryu and Lee11–Reference Seo, Jeon, Hwang and Bae13 conditions are deteriorated. To solve the instability of device performance, several methods including the addition of other element such as HfReference Maeng, Park, Kim, Lee, Park, Son, Kim, Kim, Ham, Ryu and Lee11, Reference Kwon, Kim, Chang, Kim, Kim, Park, Song, Kim, Jung and Park14 and ZrReference Yang, Huh, Oh, Lee, Kim, Oh, Jeong, Hwang and Kim12, Reference Rim, Kim, Jeong and Kim15 have been proposed.
ZnO-based oxide semiconductors have been prepared by various methods such as chemical vapor deposition,Reference Ahn, Kim, Kang, Kong, Mohante, Cho, Kim and Lee16 rf sputtering,Reference Ryu, Yang, Park, Hwang and Jeong17 pulsed laser deposition,Reference Nomura, Ohta, Takagi, Kamiya, Hirano and Hosono6 and solution processing.Reference Song, Noh, Jun, Jung, Kang and Moon18–Reference Chong, Han, No and Kim20 Vacuum-processed devices exhibit better performance and higher reliability as compared with solution-processed devices. However, solution-processed devices could be prepared at low temperatureReference Cho, Yang, Byun, Shin, Ryu, Park, Hwang, Chung, Cheong, Yoon and Chu21 and on flexible substrates.Reference Song, Noh, Jun, Jung, Kang and Moon18 These properties enable them to be large mass production and large-scale device fabrication. Also, in the solution process, composition ratio of each element in multicomponent oxide semiconductors can be easily controlled and thin films with exact composition can be synthesized.Reference Kim, Shin, Ahn, Kim, Park and Kim22 The microstructure and chemical composition of thin films fabricated by a solution process depends on the precursor materials and processing conditions. For example, formation of sol–gel-processed ZnO-based oxide semiconductors requires the evaporation of solvent and organic additives and thermal decomposition of the precursors during annealing.Reference Seo, Hwang and Bae23 So the resulting films includes a little of remaining organics from time to time. In addition, even though the same precursors are used, thin films with different microstructure are formed with respect to the deposition method.
Indium is a rare and expensive material. Thus, the development of In-free oxide semiconductors is needed and the strong alternative element is tin (Sn). As a result, ternary ZnSnO (ZTO) semiconductor is considered as an attractive channel layer, inducing high field-effect mobility as much as InZnO. In addition, the ZTO-based quaternary oxide films including Hf,Reference Kwon, Kim, Chang, Kim, Sun, Kim, Kim, Park, Song, Kim, Jung and Park24, Reference Kwon, Jung, Son, Lee, Park, Kim, Park, Choi, Jeong, Koo and Lee25 Zr,Reference Yang, Huh, Oh, Lee, Kim, Oh, Jeong, Hwang and Kim12, Reference Rim, Kim, Jeong and Kim15 and GaReference Seo, Jeon, Hwang and Bae13 have been reported to improve high stability. These elements suppress the formation of oxygen vacancy, resulting in robust oxide films. Up to now, most studies focused the addition of elements such as Hf, Zr, and Ga, regardless of deposition method. Similarly, group IV element titanium (Ti) can have a strong influence on carrier concentration and improve the instability of TFTs since group IV Ti is easily combined with oxygen in oxide-based semiconductors and tailors the concentration of oxygen vacancies.
Therefore, we prepared TiZnSnO (TZTO) thin films by using acetate-based precursors. TFTs with a bottom-gate structure were successfully fabricated by using solution-processed TZTO films as an active channel layer. TFTs with nanocrystalline TZTO films exhibited a better device performance than those with amorphous TZTO films.
II. EXPERIMENTAL DETAILS
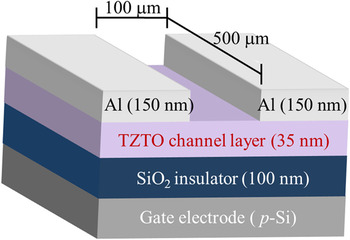
Metal precursor solution for fabricating TZTO thin films was prepared by dissolving 0.3 mol zinc acetate (Zn(CH3COO)2), 0.3 mol tin(II) chloride dehydrate (SnCl2⋅2H2O), and 0.01 mol titanium isopropoxide in 25 ml 2-methoxyethanol solvent. To make the solution stable, the precursor solution was mixed with ethanolamine (C2H7NO) of 1 ml. Then, the solution was aged for 24 h. The resulting solution was filtered through a 0.22-μm syringe filter and then deposited on the substrate by the spin-coating method at 4000 rpm for 30 s. After the deposition of TZTO thin films, annealing was conducted at 400, 500, and 600 °C for 1 h in air ambient. Heavily boron (p+)-doped silicon wafers were used in the bottom-gate/top-contact structure for the fabrication of TZTO TFTs. The SiO2 layer with a thickness of 100 nm was thermally grown on top of the silicon wafer as the gate dielectric. After the annealing of TZTO thin films, Al source and drain electrodes (150 nm) were deposited by sputtering with a shadow mask. The channel length and width were 100 and 500 μm, respectively. The schematic cross-section of the TZTO TFTs was shown in Fig. 1.
Schematic cross-section of the TZTO TFT.

X-ray diffraction (XRD) and transmission electron microscopy (TEM) measurements were carried out to investigate the crystal structure and microstructural evolution. The electrical characteristics of TZTO TFTs were characterized with a semiconductor parameter analyzer. The composition and chemical states of the deposited films were characterized by x-ray photoelectron spectroscopy (XPS). The carrier concentration and resistivity of TZTO films were measured by Hall effect measurement.
III. RESULTS AND DISCUSSION
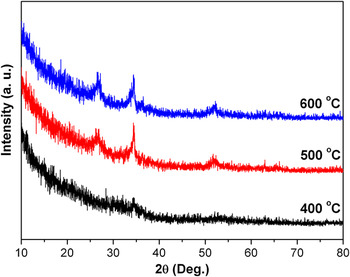
Figure 2 shows the 2θ−ω XRD patterns of the spin-coated TZTO thin films annealed at various temperatures for 1 h in air. For the sample annealed at 400 °C, no remarkable peaks are observed, indicative of characteristic of amorphous TZTO film. However, for the samples annealed at 500 and 600 °C, several broad and small peaks are observed, indicating that the spin-coated TZTO thin films are crystallized. This is also confirmed by TEM analyses.
XRD patterns of the spin-coated TZTO thin films annealed at various temperatures for 1 h in air.

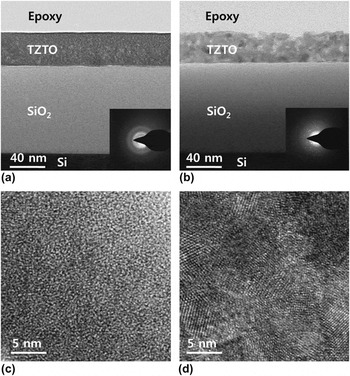
Further microstructural characterization of the spin-coated TZTO films was carried out by TEM. Figures 3(a) and 3(b) shows cross-sectional TEM micrographs obtained from the TZTO films annealed at 400 and 600 °C, respectively. Both samples show uniform thickness of about 35 nm. The insets are the corresponding electron diffraction patterns. For the sample annealed at 400 °C, the diffuse ring pattern was exhibited, indicating that the TZTO film was amorphous. In contrast, for the sample annealed at 600 °C, the spotty ring pattern was obtained, indicative of the crystalline phase. Figures 3(c) and 3(d) exhibits high-resolution TEM micrographs corresponding to the Figs. 3(a) and 3(b), respectively. Figure 3(c) shows no lattice fringes. But Fig. 3(d) exhibits good lattice fringes, indicating that the TZTO films annealed at 600 °C were completely crystallized and consisted of 5–10-nm-sized crystalline grains.
Cross-sectional TEM micrographs obtained from the TZTO films annealed at (a) 400 °C and (b) 600 °C. The insets are the corresponding electron diffraction patterns. (c) and (d) exhibit high-resolution TEM micrographs corresponding to (a) and (b), respectively.

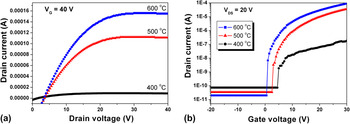
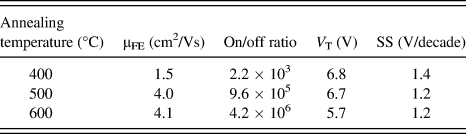
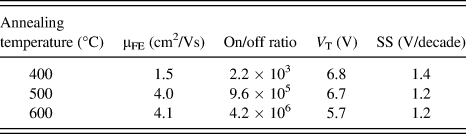
Figure 4(a) shows the typical output curves of the solution-processed TZTO TFTs as a function of annealing temperature. With the increase of the drain voltage (V DS) at a positive gate bias (V GS), the drain current (I DS) abruptly increases. Furthermore, the output characteristic exhibits a clear pinch-off and drain current saturation. As the annealing temperature is increased, the better device performance is obtained. Figure 4(b) shows the transfer characteristics of TZTO TFTs as a function of annealing temperature at a drain voltage of 20 V. With the exception of the device annealed at 400 °C, all the TFTs exhibited good operating behaviors in the n-channel enhancement mode. With the increase of the annealing temperature, the on-to-off ratio was increased from 2.2 × 10³ to 4.2 × 10⁶ and the field-effect mobility was also increased from 1.5 to 4.1 cm2/Vs. The turn-on voltage was shifted to negative direction. This was due to the increase of carrier concentration by the relative increase of the oxygen vacancy, which was confirmed by Hall effect measurement. The electrical characteristics of the TZTO TFTs annealed at different temperature are summarized in Table I.
(a) Typical output curves of solution-processed TZTO TFTs as a function of annealing temperature. (b) Transfer characteristics of TZTO TFTs annealed at different temperature at a drain voltage of 20 V.

Comparison of the electrical characteristics, including the field-effect mobility (μFE), on-to-off ratio, threshold voltage (V T), and subthreshold swing (SS), of TZTO TFTs with different annealing temperatures.
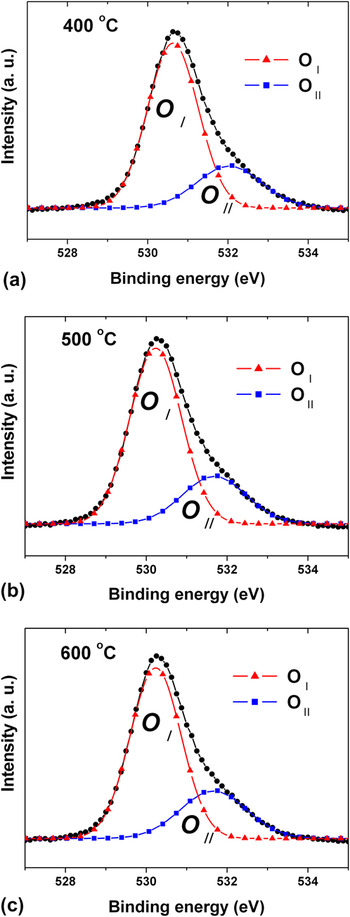
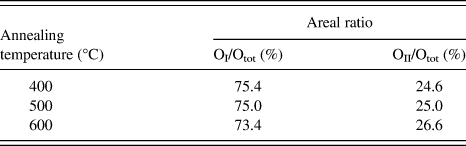
To investigate the relationship between the electrical characteristics and the chemical bonding in TZTO TFTs, the O 1s XPS spectra in TZTO films with different annealing temperatures have been examined. As shown in Fig. 5, the O 1s XPS spectra exhibited asymmetric peak shapes. Gaussian fitting was used to deconvolute the O 1s peaks. The peaks corresponding to lower binding energy of ∼530 eV are due to O2− ions present in stoichiometric TZTO films, whereas the peaks with higher binding energy of ∼532 eV result from O2− ions in oxygen-deficient TZTO films.Reference Chong, Han, No and Kim20, Reference Seo, Hwang and Bae23 Therefore, the ratio of the peak area with higher binding energy (OII) to total peak area (OT) indicates the relative quantity of oxygen vacancy. The areal ratio (OII/OT) was increased from 24.6% for the TZTO TFT annealed at 400 °C to 26.6% for the TZTO TFT annealed at 600 °C, as shown in Table II. This result indicates the TZTO TFT annealed at 600 °C has a larger carrier concentration, which contributed the improvement of the carrier conductivity.
O 1s XPS spectra in TZTO films with different annealing temperatures. (a) 400 °C, (b) 500 °C, and (c) 600 °C.

Areal ratio of OI/Otot and OII/Otot as a function of annealing temperature.
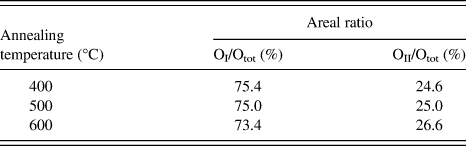
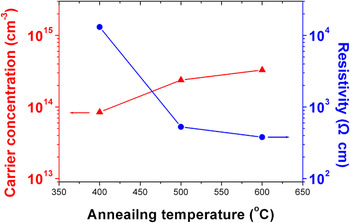
Figure 6 shows the variation of carrier concentration and resistivity in TZTO films annealed at different temperatures, which was obtained from Hall effect measurement. As the annealing temperature was increased, the carrier concentrations were monotonously increased and the resistivity was significantly decreased from 13,100 to 379 Ω cm. This result is in good agreement with XPS results. Considering the correlation from the Hall effect measurement and XPS analysis, it is suggested that the increase of carrier concentration results from the increase of oxygen vacancy, acting as a carrier donor.
Carrier concentrations and resistivities in TZTO films annealed at different temperatures.

In solution-processed TFTs, a relatively high annealing process above 500 °C is inevitably required to remove impurities in a channel layer and to improve the condensation of metal oxide metal.Reference Kim, Ahn, Shin, Jeong, Kim and Kim26–Reference Lee, Chang, Herman and Chang28 So, the annealing process is one of the processing parameters to affect reliability and mobility of a channel layer. In many oxide semiconductors including ZnOReference Ong, Li, Li, Wu and Loutfy27 and InGaZnO,Reference Kim, Ahn, Shin, Jeong, Kim and Kim26 the effect of annealing temperature on TFT performance has been reported. For the TZTO TFT annealed at low temperature, an overlap of s-orbitals in heavy metal ions is not sufficient in spite of their large radii because many pore and open structures exist in the loosely structured TZTO films, as shown in Fig. 2. The overlap of s-orbitals forms the conduction band minimum (CBM), which acts as an electron pathway.Reference Nomura, Ohta, Takagi, Kamiya, Hirano and Hosono6, Reference Seo, Hwang and Bae23 Thus, the electron conduction in the TZTO film annealed at low temperature is significantly limited due to the structural disorder despite of a relatively high oxygen vacancy. However, in the TZTO films annealed at high temperature, even though the morphology was slightly deteriorated through grain growth by the crystallization, metal–oxide bond becomes closer by crystallization and the connection of s-orbitals is improved, which reduces the density of a shallow location state below CBM. Therefore, the mobility is increased and the subthreshold swing is improved due to the reduction of trap sites. On the other hand, the effect of grain boundary scattering in nanocrystalline channel layers could be ignored as reported in nanocrystalline InGaZnOReference Kim, Ahn, Shin, Jeong, Kim and Kim26 and ScInZnOReference Choi, Kim, Jeong, Bae, Kim, Hong and Yu29 TFTs since calculated mean free paths are quite smaller than grain sizes of 5–10 nm as shown in TEM micrographs. In addition, as the annealing temperature increased, the carrier concentration increased and electrical resistivity decreased, as shown in Fig. 6, which increased the mobility. This trend has been reported in other oxide semiconductors: Mobility increases with carrier concentration in InZnOReference Martins, Barquinha, Ferreira, Pereira, Goncalves and Fortunato30 and InGaZnO.Reference Kim, Ahn, Shin, Jeong, Kim and Kim26, Reference Takagi, Nomura, Ohta, Yanagi, Kamiya, Hirano and Hosono31 For these reasons, nanosized crystalline TZTO TFTs exhibit the better device performance than amorphous TZTO TFTs.
IV. CONCLUSION
The TZTO films were fabricated by a simple and cost-effective solution process through spin coating. The films were annealed at various temperatures. For the sample annealed at 400 °C, it showed an amorphous phase. For the samples above 500 °C, nanosized crystalline phases were formed. The results showed that annealing the TZTO films allowed us to control the carrier concentration and microstructure of the films. Nanocrystalline TZTO TFTs exhibited the better device performance than amorphous TZTO TFTs because nanocrystalline TZTO films have higher concentration and lower resistivity than amorphous TZTO films. We obtained the optimized TZTO TFT device performance with a field-effect mobility of 4.1 cm2/Vs, a threshold voltage of 5.7 V, and an on/off ratio of 4.2 × 10⁶.
ACKNOWLEDGMENT
This work was supported by the Korea Science and Engineering Foundation (KOSEF) grant funded by the Korea government (MEST) (No. 2011-0005119).