

Introduction
Establishing what constitutes ‘need’, or the ‘necessities of life’, has been a long-standing battle-ground in empirical investigations of, and debates about, poverty. In their path-breaking Poor Britain study, Joanna Mack and Stewart Lansley (Reference Mack and Lansley1985) developed the ‘consensual’ approach to poverty: a democratic and inclusive approach that emphasises that needs should be determined by the public rather than academic or professional experts.
Their approach subsequently provided the basis for further UK academic surveys of poverty (Gordon and Pantazis, Reference Gordon and Pantazis1997; Hillyard et al., Reference Hillyard, Kelly, McLaughlin, Patsios and Tomlinson2003; Pantazis et al., Reference Pantazis, Gordon and Levitas2006; Gordon et al., Reference Gordon, Mack, Lansley, Main, Nandy, Patsios and Pomati2013) offering evidence of changing UK public attitudes over three decades, and since 2010 has informed the UK Government's measurement of child poverty. Its influence has extended internationally, informing surveys in other countries in Europe (Halleröd et al., Reference Halleröd, Bradshaw, Holmes, Gordon and Pantazis1997; van den Bosch, Reference Van den Bosch and Andreß1998), Australasia (Saunders et al., Reference Saunders, Naidoo and Megan2008), Africa (Nobel et al., Reference Noble, Wright, Magasela and Ratcliffe2008) and Asia (Lau, Reference Lau2005; Saunders et al., Reference Saunders, Wong and Wong2013). Despite the international proliferation of consensual studies, research investigating public perceptions of need comparatively across different societies and cultures remains sparse. A major breakthrough followed the European Commission's 2007 Eurobarometer survey on Poverty and Social Exclusion, undertaken across the twenty-seven EU-member states, which established a ‘high level of congruence between the national patterns of social needs as well as a large consistency in the identification of socially defined necessities throughout the EU’ (Dickes et al., Reference Dickes, Fusco and Marlier2008).
Beyond the EU, however, comparative analysis is lacking. As a result there is limited understanding about cross-cultural attitudes towards the necessities of life and the requirements to escape poverty. In the absence of such knowledge, it becomes difficult to assess the plausibility of a concept of universal needs, at least one that is rooted in public perceptions. Inherent in relative conceptualisations of need is the idea that they are products of particular historical, social and cultural junctures such that the determination of needs in different societies, by the public, are never likely to be identical; however, this does not preclude the possibility that there may be agreement across different societies about the essential nature of some goods and services. This is an important issue that has been largely unaddressed from a consensual perspective, the result of which is that expert-led approaches still dominate international debates about needs and poverty.
In this article, we attempt to address this research lacuna by offering a comparative analysis of the necessities of life, as determined by public opinion using the Mack and Lansley (Reference Mack and Lansley1985) approach, in two advanced capitalist societies: the UK and Japan. The countries offer interesting case studies for comparative research on this topic as their relative wealth suggests that there might be a high degree of congruence in terms of the range of goods and social activities considered customary by the public. Nonetheless, there are factors relating to geography, socio-demography, history and culture, as well as welfare arrangements, which suggest possible differing perspectives. In seeking to contribute to international and comparative debates about the necessities of life, the article examines the relevance of some of these issues. First, we provide a short overview of how needs have been conceptualised by consensual poverty researchers.
Conceptualisations of ‘need’: the consensual approach
Building upon the work of poverty pioneers, such as Peter Townsend (Reference Townsend1979), who had identified needs as socially determined and in the context of changing social norms, Mack and Lansely's Poor Britain study sought to ‘discover . . . what is an unacceptable standard of living for Britain’ (Mack and Lansley, Reference Mack and Lansley1985: 50). The study identifies people as living in poverty when ‘their standard of living falls below the minimum deemed necessary by current public opinion’ (ibid.). Mack and Lansley's methodology, which placed public opinion at the centre of the research process in the determination of minimum living standards, represented a major paradigm shift in poverty research. Their study was the first in Britain which sought to understand needs with reference to the views of the whole population (via a nationally representative social survey), instead of relying on the behaviour of people themselves or the views of academic experts. Their path-breaking study established, and subsequent UK consensual studies (Gordon and Pantazis, Reference Gordon and Pantazis1997; Hillyard et al., Reference Hillyard, Kelly, McLaughlin, Patsios and Tomlinson2003; Pantazis et al., Reference Pantazis, Gordon and Levitas2006) confirmed, that what constitutes a minimum standard of living involves being able to participate in society and perform social roles. According to the UK public, minimum living standards rest not only on an ability to meet physiological needs, but also in the capacity of individuals to take part in society.
Needs are said to be determined consensually because they are understood with explicit reference to ‘the views of society as a whole’ (Mack and Lansley, Reference Mack and Lansley1985: 42). Underlying the consensual approach is the idea that there is an accepted view, which cuts across social and political divides, of what a universal minimum standard of living should look like and which everyone in society should be entitled to. Establishing a consensus is important because without it the definition of what is an unacceptable minimum standard becomes the opinion of one group against another (Gordon and Pantazis, Reference Gordon and Pantazis1997). Previous UK studies assessing the strength of the consensus, and therefore the robustness of the approach, have found that with the exception of a few items and activities (for example, owning a ‘dressing gown’, eating a ‘Sunday roast joint’), social groups in the UK are generally in agreement over what constitutes necessities (or not). Mack and Lansley suggest that this is because society as a whole acts as a reference point for people: ‘judgments are being made on the basis of a cohesive view of the kind of society we ought to live in. There is, it seems, a general cultural ethos of what is sufficient and proper’, they argue (Mack and Lansley, Reference Mack and Lansley1985: 83). The notion of consensus forms a particular interest for this comparative research because we might expect to find that the degree of consensus to be stronger in more socially cohesive societies (such as Japan) than in more socially divided societies (such as the UK). The next part of the article discusses the data and methods used for the comparative study.
Data sources and methods
The analysis for this article is based on nationally representative surveys undertaken in Japan and the UK in 2011 and 2012, respectively. For the UK analysis, we used a merged dataset consisting of two Omnibus surveys, the Omnibus Survey for Great Britain (NatCen, 2012) and the Northern Ireland Omnibus Survey (NISRA, 2012), undertaken as part of the UK Poverty and Social Exclusion study (see http/poverty/ac.uk). Fieldwork for both surveys involved face-to-face interviews with adults aged sixteen and over in their own homes. Although the surveys differed in relation to sampling strategy and how respondents provided their answers, comparability was achieved through the use of identical questions on the necessities of life (eighty-six in total). Forty-six questions related to adults (thirty-three items and thirteen activities), thirty questions focused on children (twenty-two items and eight activities), and a smaller set of questions (n = 10) related to local services.Footnote 1 They were developed following a methodologically robust process involving national focus group research (Fahmy et al., Reference Fahmy, Pemberton and Sutton2013) and an expert review of previous survey indicators by the research team and international advisory board. The questions were piloted and also cognitively tested. Those taking part in the shuffle card exercise (all British and half of the Northern Ireland survey respondents) were asked the following question about the adult items and activities:Footnote 2
On these cards are a number of different items which relate to our standard of living. I would like you to indicate the living standards you feel all adults should have in Britain today by placing the cards in the appropriate box. BOX A is for items which you think are necessary – which all adults should be able to afford and which they should not have to do without. BOX B is for items which may be desirable but are not necessary.
Now, I would like you to do the same thing for the adult's activities on this set of cards – set H.
For Japan the data used is the 2011 Perception of Necessity Survey (2011 Kurashi ni Kansuru Ishiki Chosa) conducted by the National Institute of Population and Social Security Research (NIPSSR). Although the survey differs from the UK surveys in a number of respects – for example being a postal survey with questionnaires (rather than face-to-face interviews), involving respondents aged twenty and above (rather than aged sixteen and over) and selecting respondents randomly from the survey company's monitorsFootnote 3 all over Japan (rather than from private households) – the three surveys achieved almost identical response rates.Footnote 4 Moreover, comparability between the surveys was achieved as far as possible in terms of the phrasing of the question regarding the necessities of life. Translated, it reads as follows:
This question is about a standard of living for all people in Japan today. In order to live a modern life, what items do you think are necessary and should be able to be acquired by everybody? (A) Definitely necessary (B) Desirable but not necessary (C) Not necessary.
The question was asked for sixty-seven adult items and activities and for thirty children's items and activities, which were developed from a series of focus groups and a previous Japanese poverty survey (Abe, Reference Abe2004) whilst also attempting to match the UK surveys as far as possible. In interpreting the results of the Japanese data, it is important to note that the survey was conducted during July 2011, just four months after the Great East Japan Earthquake which killed nearly 20,000 people. It is quite possible that a disaster of this magnitude, whose effects are still being felt, may have influenced people's perceptions of life's necessities temporarily and/or even permanently.
The comparative analysis presented here examined three issues: (i) the differences in perceptions of need between the UK and Japan; (ii) the needs which might be ‘common’ between the two societies; and (iii) the factors which account for any of the differences found. Before any of these points could be addressed, it was necessary to harmonise the items and activities from the surveys. Harmonisation involved judging which items and activities could be included for comparative analysis based on how closely they matched; a process which finally yielded twenty-six adult items and activities and ninteteen child items and activities. Some items were considered an identical match (such as a ‘TV’, ‘car’ and ‘two meals a day’), although even here the specific details of each of the items may differ between the two societies. Other items were regarded as a very close match (such as the UK ‘warm waterproof coat’ which was a ‘winter coat’ in Japan). Underlying this process of harmonisation was the extent to which the items and activities reflected the same need. Ideas about decency and the avoidance of shame, common in both societies (see Sutton et al., Reference Sutton, Pemberton, Fahmy and Tamiya2012), resulted in the matching of the UK item ‘an outfit to wear for social occasions’ with the Japanese ‘reifuku’ (formal suits for funerals, weddings and other formal occasions). Some items differed only in the minor detail. For example, ‘hair done regularly’ in the UK was matched with ‘going to get a haircut once a month for men, once in two months for women’ in Japan. The Japanese item is more specific in terms of frequency, but was considered to correspond to the UK item; both represent the need to be adequately groomed. After harmonising items, we then combined the two datasets into a single dataset with a sample of 1,896 from the UK and a sample of 1,518 from Japan.
Findings
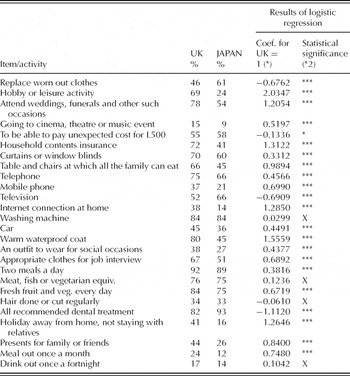
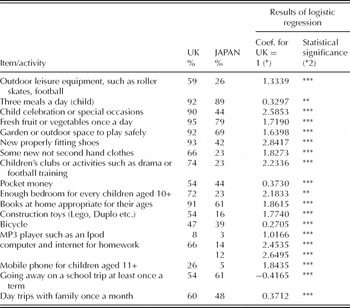
Turning to the first issue concerning differences in public attitudes across the two societies, Tables 1 and 2 illustrate the percentage of the population in each country agreeing that the item or activity is necessary.
Percentage of the population perceiving an adult item/activity as necessary

Notes: (*) The result of a logistic regression with a dummy variable of perception of necessity ( = 1 if the respondent answered the item is necessary, = 0 if not) as dependent variable. Independent variable is the country dummy ( = 1 if Japan, = 0 if UK). Control variables are sex, age (young (<35 old), old (> = 65 old) or middle age (base)), has child ( = 1 if the respondent has a child less than 18), marital status (single, divorced, married as base), education attainment (low, middle–high, high and other. middle as base), income quintile measured with equivalent household income (quintile 1,2,4 and 5. Quintile 3 as base).
(*2) Coefficient is statistically significant at 1% (***), 5% (**), 10% (*), not significant (X).
Percentage of the population perceiving a child item/activity as necessary

Notes:(*) The result of a logistic regression with a dummy variable of perception of necessity ( = 1 if the respondent answered the item is necessary, = 0 if not) as dependent variable. Independent variable is the country dummy ( = 1 if Japan, = 0 if UK). Control variables are sex, age (young (<35 old), old (> = 65 old) or middle age (base)), has child ( = 1 if the respondent has a child less than 18), marital status (single, divorced, married as base), education attainment (low, middle–high, high and other. middle as base), income quintile measured with equivalent household income (quintile 1,2,4 and 5. Quintile 3 as base).
(*2) Coefficient is statistically significant at 1% (***), 5% (**), 10% (*), not significant (X).
It is noteworthy that in both countries there is public support for items across a range of domains (such as clothing, housing, medical and food), as well as activities and participation allowing individuals to fulfil their social roles and obligations. However, particularly striking are the invariably higher levels of support in the UK. At first glance, this could simply be the result of the differing response categories available to survey participants in the two countries. The response category ‘necessary’ used in UK survey is broader than the Japan survey's ‘absolutely necessary’. Adding the caveat of ‘absolutely’ may have reduced support for items in Japan. It is also possible that difference in survey methodology, one face-to-face, the other postal, influenced responses. Whilst we cannot discount these possibilities, the large difference in public attitudes towards the child items suggests at least that there may be other important factors to consider.
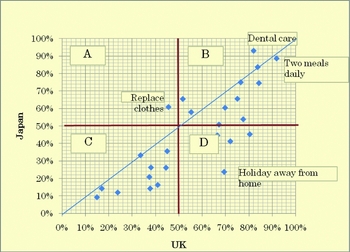
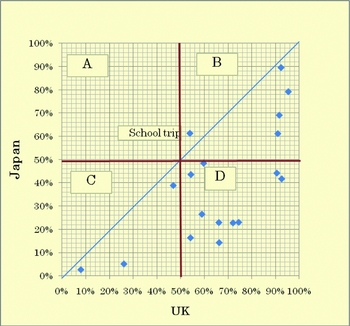
To show the findings visually, the percentage of the population answering ‘necessary’ has been plotted in scatter plot diagrams (Figures 1 and 2). Each dot represents an item or activity, and if it lies below the thin diagonal line this indicates that a higher proportion of the UK population, compared to the Japanese population, perceives the item or activity as necessary. It is noticeable that the difference in public opinion is particularly pronounced in relation to a few of the adult items, such as a ‘hobby or leisure activity’ and a ‘holiday away from home’, but is especially marked for the child items. How might such variations over the child items and activities be explained? Child poverty expert Gill Main (Reference Main2013) suggests that, in the UK at least, adults tend to view children through a protective lens where they are seen as ‘inherently dependent and vulnerable’ and ‘widely considered to be “becomings” (i.e. potential adults) rather than “beings” (i.e. people of relevance in their own right)’. Thus, children are seen as being ‘in need of extra provision to ensure they can develop to their full potential (ibid.). In this context, children are seen as lacking agency and culpability for their misfortune, and this reinforces a comparatively generous view concerning their entitlements (ibid.). This is quite unlike the situation facing adults who are often blamed for bringing poverty on themselves and their families. In Japan, however, there is a strong sentiment that today's children are surrounded and even ‘poisoned’ by the materialism that dominates their lives. This view is especially pronounced among older generations who experienced deprivation in their own childhoods, but it is also shared by younger generations.
Percentage of the population perceiving an adult item/activity as necessary

Percentage of the population perceiving a child item/activity as necessary

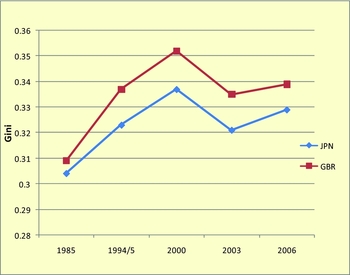
There may also be social-demographic drivers for the differences found, which can be explored from the two data sets. Japan has an ageing population; nearly a quarter (23 per cent) of its population is sixty-five years and older compared to the UK's 17 per cent (Japan 2011, UK 2010 data, United Nations, 2011). The difference in age composition alone could be the reason for the variation in the percentage of support for particular items, but the differing socio-economic conditions of the two countries may also be relevant. Poverty rates are higher in Japan than in the UK (16 per cent compared to the UK's 11 per cent, late 2000 data), although levels of inequality (measured using the Gini coefficient) are higher in the UK (0.345 compared to Japan's 0.323) (OECD, 2011). In order to assess whether demographic and key socio-economic characteristics of the two populations might be driving the difference in the public's perception of necessities, logistic analysis was undertaken controlling for age, sex, marital status, education attainment, income quintile and whether the respondent has a child or not.
These results are shown in the right-most columns of Tables 1 and 2. The coefficient for the country dummy variable (UK = 1, Japan = 0) is shown with the statistical significance indicator. The coefficient is positive and significant for almost all items, indicating that even after controlling for demographic differences the probability of a UK respondent thinking an item is necessary is greater than the probability of a Japanese respondent answering in the same way. The exceptions were four items (‘replacing worn out clothes’, ‘paying for an unexpected cost’, ‘television’ and ‘dental treatment’) for which the coefficient was negative and statistically significant, and one item (‘hair done regularly’) for which the coefficient was not significant, indicating there is no difference between the UK and Japan. The largest positive coefficients are found for the children's items; all but one item (‘going away on a school trip at least once a term’) show statistically significant positive coefficients. Six items (‘celebrations’, ‘new properly fitting shoes’, ‘children's clubs or activities such as drama or football training’, ‘enough bedrooms for every child aged ten plus’, ‘computer’ and ‘internet’) have coefficients larger than two. Thus, there is fairly robust evidence that there are higher levels of support for items and activities (particularly those relating to children) in the UK than in Japan, which does not appear to arise just from differences in the demographic characteristics of the population in the two countries.
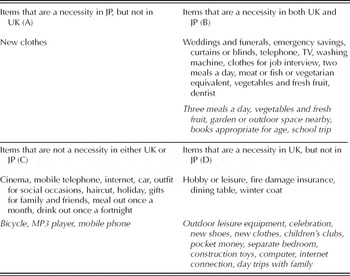
The next part of our analysis examines whether there exist common ‘socially perceived necessities’ across the two societies. Following Mack and Lansley (Reference Mack and Lansley1985), ‘socially perceived necessities’ are those which attract a majority support (50 per cent or more). This is the threshold at which an item or activity is recognised as having achieved consensual support, its significance lies in the fact that only those items and activities attracting a majority public support are included in consensual measures of poverty. Whilst there are marked differences in social attitudes concerning some adult necessities, there are only a handful of items which meet the 50 per cent rule in one country and not in the other. These items occupy the quadrants A or D in Figure 1; for these items there is some disagreement between the UK and Japanese public on whether they are ‘socially perceived necessities’. However, only five items on the adult list are in this category. All other items fall into either quadrant B or C, indicating that there is some consensus between the two societies about items and activities which are necessary, B, or not, C. Eleven items in quadrant B can be considered common ‘socially perceived necessities’, and they include items relating to meeting both physical and material needs, as well as social participation. Three of these items concern food, including access to fresh fruit and vegetables every day. On the other hand, both societies appear to give less priority to needs which relate to social obligations and roles – they dominate quadrant C – although some social activities are regarded as essential in both societies. This is a surprising finding, particularly for a society such as Japan which has traditionally placed a strong emphasis on societal obligation.
Regarding the children's items and activities, a weaker consensus is found (Figure 2). Just five items receive majority support across both societies (quadrant B). Food items are prioritised, but also those relating to education. Most of the child items fall into quadrant D, indicating that they are ‘socially perceived necessities’ in UK, but not in Japan. Thus, it would be fairly difficult to produce a common list of ‘socially perceived necessities’ for children that could be used in the construction of a poverty measure for both countries. Table 3 provides a summary of the items in each quadrant.
Adult and children's items and activities in quadrants A to D

Note: Items in italics are children's items.
So far, we have established that there exists a sizable difference in cross-cultural attitudes towards the necessities of life between the two countries. The difference is significant even after controlling for demographic differences. Two possible explanations are examined more closely.
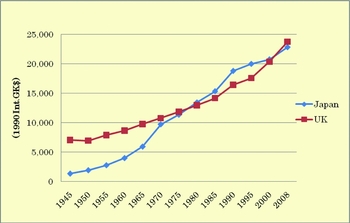
One explanation focuses on the perceptions of the older generation. Earlier we established that the difference is significant even after controlling for the age structure of the populations. However, this estimate assumes that the effect of age is the same across the two countries. It is possible that the age effect is larger in Japan than in the UK. In other words, the difference between Japan and the UK might be the result of less generous attitudes among the Japanese older population rather than because the proportion of the older population in Japan is comparatively larger than the UK's. Japan experienced very rapid economic development after World War II, and its pace was much faster than the UKs (Figure 3). Older Japanese generations experienced the harsh realities of the war and lived and grew up in an era when many of the ‘niceties’ of modern society were unavailable. It is possible that such harsh experiences have affected their perceptions, so that they consider items such as a ‘TV’ and activities such as ‘going out to the cinema etc.’ as unnecessary because they coped without having them in the past. The sentiment is especially strong for child items where many items on the list (for example, ‘MP3 player’ and ‘mobile phone’) are considered by some to even be detrimental to a healthy childhood. However, such an explanation could similarly apply to the UK's older population groups. After all, they too experienced the vicissitudes associated with the war and its aftermath, particularly in terms of food rationing. However, what distinguishes their experiences is the sense of collectivism which is reported to have swept the UK during the war-time period. Social policy analysts of the time, including most prominently Richard Titmuss, observed a new wave of social attitudes based on an ‘unprecedented sense of social solidarity among the British people’ (Harris, Reference Harris and Mommsen1981: 247) which subsequently led to the creation of an egalitarian welfare system. This may explain the variations found in public attitudes towards minimum living standards among the UK's differing generations (see Pantazis et al., Reference Pantazis, Gordon and Levitas2006).
Growth in gross domestic product per capita: Japan and the UK, 1945–2008
Source: World Economics Maddison Historical GDP Data http://www.worldeconomics.com/Data/MadisonHistoricalGDP/Madison%20Historical%20GDP%20Data.efp (accessed 2 July 2012).

A second possible explanation is the degree of societal stratification. While there are contradictory analyses about the supposedly egalitarian nature of Japan (see OECD, 2008, 2011; Abe, Reference Abe, Saunders and Sainsbury2010; Ballas et al., Reference Ballas, Dorling, Nakaya, Tunstall and Hanaoka2013), we might expect the socio-economic conditions of a country, including levels of inequality and poverty, to impact on public attitudes towards the necessities of life. For example, it is plausible that those living in an egalitarian society may identify an item as necessary for everyone because they perceive others as being similar to themselves. On the other hand, there may be a greater tendency for individuals living in a society with high level of inequality to believe that the ‘niceties of life’ that they themselves enjoy are privileges and not entitlements for everyone. If that is the case, Japan, which had been more egalitarian in terms of income inequality compared to the UK (See Figure 4), will exhibit a stronger consensus on the necessities of life.

In order to examine these two hypotheses, we incorporated cross terms of the country dummy variable with age and income variables into the following estimation model.
 \begin{eqnarray*}
Ln\frac{{(pi)}}{{(1 - pi)}} &=& a + \beta _1 Ci + \beta _2 Si + + \beta _3 (SiCi) + \beta _4 yi + \beta _5 (yi \times Ci) + \beta _6 Oi \\
&&+\,\beta _7 (Oi \times Ci) + \beta _8 q1_i + \beta _9 (q1_i \times Ci) + \beta _{10} q5_i + \beta _{11} (q5_i \times Ci) + ZXi \\[-24pt]
\end{eqnarray*}
pi = probability of individual answering the item is necessary
Ci = country dummy for individual i (UK = 1, JP = 0)
Si = sex of individual i (man = 1, woman = 0)
yi = dummy variable for young if individual i is less than 35 = 1, if not = 0
Oi = dummy variable for old if individual i is over 65 = 1, if not = 0;
q1i = dummy variable for quintile 1 (if individual i is in quintile 1 = 1, if not = 0)
q5i = dummy variable for quintile 5 (if individual i is in quintile 5 = 1, if not = 0)
Xi = control variables (marital status, has child less than 18 yrs old)
The coefficients we are interested in are the ones for the cross terms (β 3, β 5, β 7, β 9, β 11). For example, the coefficient β 2 indicates the overall effect of being a man (as opposed to the base category, women) on the probability of an individual answering the item is necessary, while β 3 captures any added effect of being a British man compared to being a Japanese man. The coefficient β 4 indicates the effect of being young (as opposed to the base category of thirty-six to sixty-four years old) and β 5 the added effect of being British and young. Β 8 indicates the overall effect of being income poor (quintile 1) as opposed to being a middle-income earner (quintiles 2–4) and β 9 the added effect of being the poorest and British.
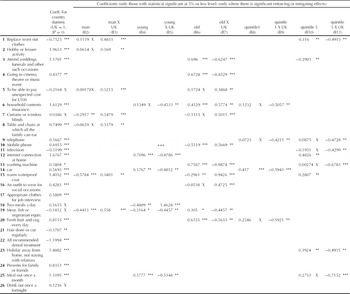
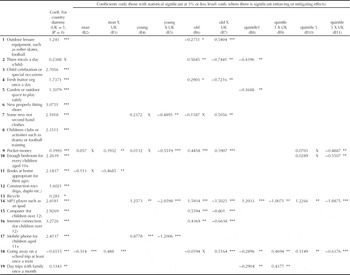
Tables 4 and 5 show the highlights of the results. The numbers are the coefficients of the variables. To simplify, we have shown only those coefficients that are statistically significant. Let us explain how to read the results using the example of the first item, ‘to replace worn out clothes’. The coefficient for the overall sex variable is positive (+0.1159), but not significant. This indicates that overall across Japan and the UK there is no statistically significant difference in the opinion of men and women. However, the cross term with the country dummy is positive and strongly significant (+0.4833***) which means that more UK men tend to perceive ‘replacing worn out clothes’ as necessary compared to UK women. Thus gender plays a strong role in determining differences in public opinion in the UK, but not in Japan. On the other hand, the coefficient for quintile 5 is positive and significant (+0.316**); overall across Japan and the UK, the rich tend to think this item is more necessary than middle-income earners (the base category for quintile variables). But the cross term with the country dummy is negative and significant (–0.4915**), and its absolute value is greater than the quintile 5 variable. In other words, the UK effect entirely cancels out the income effect. This indicates that the richest individuals in the UK tend to think the item is less necessary compared to middle-income earners, whereas the richest in Japan tend to think the item is more necessary compared to this group.
Results (Logistic Regression with cross terms): Adult Items

Note: Coefficient is statistically significant at 1% (***), 5% (**), 10% (*), not significant (X).
Results (Logistic Regression with cross terms): Children's Items

Note: Coefficient is statistically significant at 1% (***), 5% (**), 10% (*), not significant (X).
The first observation is that even after the introduction of cross terms the coefficient for the country variable is still strong and mostly positive. This indicates that the difference in the perception of older people, the young, poor and rich does not explain the variance between Japan and the UK. In another words, the estimation model does not explain the difference in the perception of necessities between the two countries. For some items, the coefficient becomes non-significant even though the country coefficient was significant in Tables 1 and 2 (‘unexpected cost’, ‘curtains/blinds’ and ‘two meals a day’ for adults and ‘three meals a day’ for children). For these items, it can be said that the model explains the differences in perception between Japan and the UK.
With regard to our first explanation focused on ‘age’, we find that the effect of the cross terms produces mixed results. Thus, looking at the cross terms of the country variable with the ‘young’ and ‘old’ variables (β 5, β 7), we see some which cancel out completely or partially the age effect (β 4, β 6) (for example, ‘attending weddings etc.’, ‘going to cinema’, ‘mobile phone’, ‘internet connection’, ‘car’, etc.). For these items, there is a less pronounced disagreement between generations in the UK than in Japan. But for other items, the disagreements between generations are greater in the UK than in Japan (for example, to be ‘able to pay unexpected cost’, ‘household contents insurance’, ‘curtain/blinds’, ‘warm coat’, ‘two meals’, ‘meat, fish or vegetarian equivalent’).
For the second hypothesis, focused on social stratification, we examined the income poor and the rich variables with the cross terms. Interestingly, for many of the items the coefficients for the poor and the rich variables (β 8, β 10) were not statistically significant, indicating that overall across the two countries, income does not influence people's perceptions. However, there are some exceptions. Quintile 1 (β 8) shows positive and significant coefficients for a ‘car’ and ‘MP3 player’, indicating overall that the poorest individuals tend to think these are necessary more than middle-income earners. On the other hand, the coefficient is negative and significant for children's items ‘three meals a day’, ‘garden’ and ‘family day trip’, indicating that the poorest tend to think these are less necessary. Looking at coefficient for Quintile 5 (β 10), the coefficient for ‘replace worn out clothes’, ‘internet’, ‘warm coat’, ‘holiday away’ and ‘MP3 player’ is positive, while that for ‘attending weddings etc.’ is negative. This shows that the rich, compared to middle-income groups, think these items are more necessary, while ‘attending weddings and funerals etc.’ is considered less necessary.
However, the cross terms with country variable (β 9, β 11) were negative and significant for many items (nine adult items and four children's items). This shows that, at least for these items, the poor and the rich in the UK tend to think the item is less necessary compared to middle-income earners, whereas the influence of income is less evident in Japan. Especially notable is that the cross terms of the country variable with Quintile 5 variable (β 11) are strongly negative in relation to many items. These show that, for the rich in the UK, these items are seen as less necessary. Although the richest in the UK are more likely to possess these items, they do not necessarily perceive these items as part of a minimum standard of living for all. Interestingly, this is not the case in Japan. We may interpret this as evidence in support of our hypothesis that the levels of inequality and poverty at least partially explain difference in public opinion regarding what is necessary. As levels of inequality have historically been higher in the UK than in Japan this might explain why differences in public perceptions between income groups are more accentuated in the UK than in Japan.
Conclusion
There has been an increasing number of studies seeking to identify the necessities of life using consensual approaches in different countries, yet international comparisons between countries with diverse cultures and traditions are rare. This article has sought to address this research gap by comparing public perceptions of need in the UK and Japan. Both societies can be characterised as wealthy capitalist societies, but their historical trajectories, cultures and demographic profiles suggest that public attitudes towards life's necessities might differ.
Using harmonised micro-data from the UK and Japan, we were able to observe the impact of some of these factors to explain differing public attitudes. We found that the Japanese public tends to have a more restrictive notion of what a minimum standard of living should encompass, even after controlling for key variables. Nevertheless, there was also evidence of a consensus on the majority of adult items in terms of whether they constituted necessities or not. This initial analysis suggests that it may be possible to develop agreed international standards concerning some adult items (principally, those relating to food). However, there were wide disagreements found in relation to children's items with UK participants giving considerably higher levels of support. On this basis, it would be difficult to produce a comparable child poverty measure using a deprivation approach that could be used in both countries.
We explored two hypotheses to explain differences in public attitudes. The first was that the difference can be explicated in terms of the older generation in Japan thinking an item is less necessary compared to the young generation in Japan, because of the country's rapid economic progress after World War II. Our analysis revealed that this is the case for some items, but not others. The second hypothesis was that social stratification might be driving the difference. The results reveal that for many items the difference in the perception of necessities between the rich and middle-income earners, especially, is observed with respect to some items in the UK, but not in Japan. In the past, Japan was considered a typical example of an egalitarian society, and its level of inequality was low, even though it has been rising steadfastly since the 1980s. Our analysis reveals that there is stronger consensus on what is considered necessary between people of different income groups in Japan than in the UK and this might be the legacy of the past egalitarian society in Japan.
Acknowledgements
This article draws on research funded by the Economic and Social Research Council Grant RES-060-25-0052. The authors would like to thank Dave Gordon, Shailen Nandy, Demi Patsios and Marco Pomati for producing the harmonised UK dataset which made this analysis possible. The authors also wish to acknowledge the helpful comments of the two reviewers.