INTRODUCTION
Unlike in the United States and several other federal systems, state-level elections in Germany are scattered across the calendar. Each election garners national attention as a gauge of voter support, not only for the state (Land) government but for the national government as well. We leverage these subnational elections to build a fundamentals-based (i.e., structural) forecast of the 2017 Bundestag election. Not only does this exercise offer a test of how predictive state (Länder) elections are of national elections, but it also allows us to circumvent two frequent shortcomings of fundamentals-based models: small samples due to the limited number of prior elections and difficulties in capturing changes that have occurred since the previous national election.
Our forecast, estimated on March 1, 2017 to predict an election on September 24, 2017 will likely deviate farther from the actual outcome than polls taken shortly before the election. Yet structural models, based on theory and estimated on historical data, serve an important function other than providing long-range forecasts—setting expectations against which outcomes can be compared. Structural models are essentially predicting how an average candidate with an average campaign and opposition would fare in the predicted election.
Our model also makes two contributions to the forecasting literature. First, we offer the first forecast of German national elections based on Länder-level data. More precisely, we use, among other covariates, results from elections to the Land-level parliaments to fit a model on federal election results for each party in each of the Länder in all national elections since 1961. We then convert predicted state-level vote shares into votes, accounting for state turnout, and aggregate up to the national level. Länder provide more observations that lower the variable to observation ratio, making it less likely to fit noise. More observations also provide more information, especially when they are distributed over the electoral calendar and can pick up events that have happened after the last national election. To a certain extent, polling data do this as well, but additional information provided through state elections also reflects the actual voting behavior of actual voters. Moreover, as poll and forecast aggregators are keen to point out, averaging over multiple (in our case, state-level) predictions attenuates out-of-sample forecast errors (Graefe Reference Graefe2015)—even more so when state elections are asynchronous and less likely to suffer from correlated errors.
Second, we employ a multi-level model predicting outcomes for each party in each state. This decision builds on the realization that a single-equation model with a forecast of the outgoing coalition’s voteshare would be of limited interest when the outgoing government is a grand coalition, as is the case in 2017. We are not the first to forecast vote shares for individual parties in a German election—Jérôme, Jérôme-Speziari, and Lewis-Beck (Reference Jérôme, Jérôme-Speziari and Lewis-Beck2013) used a SUR model in 2013—but our model adds the advantage of estimates for multiple parties in each of the Länder.
THE MODEL
We assembled a dataset of state-level returns for all national as well as state elections since 1961. This provides us with a panel dataset in which a party’s result in a federal election in one of the 16 German states forms the unit of analysis. This is an unbalanced panel because not all parties campaigned in all elections in all states. We focus on the CDU/CSU, SPD, FDP, Bündnis 90/Die Grünen, Die Linke/PDS and a residual category Others. To predict the vote shares for these parties we estimate a linear random effects model, including random intercepts for states and parties.
Our model is composed of the following variables: the vote share a party obtained in the previous federal election, the vote share it obtained in the preceding state election, whether the chancellor was from that party at the time of the election, national quarterly GDP growth Footnote 1 , an interaction of these two variables, the number of years the chancellor has been in office, and an interaction with the chancellor’s party dummy variable.
The inclusion of a party’s vote share in the previous national election allows us to form a baseline prediction. Including past outcomes effectively focuses the other predictors on changes from the previous vote share. We also include the vote share a party obtained in the preceding state election. State specific issues are of great importance in these contests and there are often quite substantial differences between a party’s national and state result. Nevertheless, vote shares in state elections are considered a thermometer for the popularity of the national government and the national opposition parties.
Yet structural models, based on theory and estimated on historical data, serve an important function other than providing long-range forecasts—setting expectations against which outcomes can be compared. Structural models are essentially predicting how an average candidate with an average campaign and opposition would fare in the predicted election.
We a code a dummy variable that indicates whether the current chancellor was from the given party. Consequently, it only ever equals 1 for the CDU/CSU and the SPD. Furthermore, we incorporate the growth rate of GDP in the quarter preceding the election compared to the same quarter of previous year, seasonally adjusted. Footnote 2 Growth is the main variable in the economic voting literature and has been successfully used for forecasting German elections before (e.g., in a benchmarked form, Kayser and Leininger Reference Kayser and Leininger2016). We interact the growth rate with the chancellor’s party dummy because responsibility for the state of the economy is primarily attributed to the head of government’s party (Duch, Przepiorka, and Stevenson Reference Duch, Przepiorka and Stevenson2015). We also include the number of years that the chancellor has been in office, interacting it with the chancellor’s party dummy to capture cost of ruling effects.
Note that ours is a completely structural model which does not rely on any poll-based variables. We only make a small exception for the vote share in state elections. Due to differing term lengths for some state and federal elections there is no state election in-between two federal elections. In this case we impute the results from a state poll conducted at least six months prior to the federal election if such data are available.
OUR FORECAST
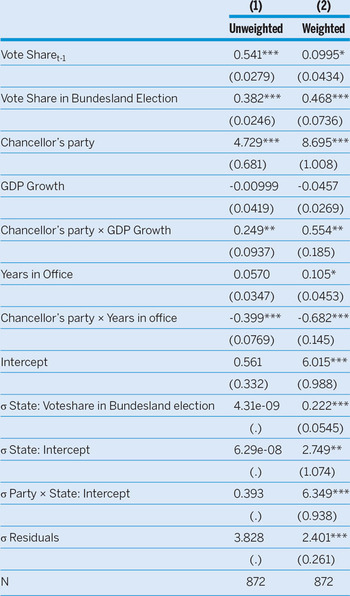
We regress a party’s vote share on our explanatory variables in a multi-level model—parties in states—to obtain coefficient estimates and calculate the 2017 vote share of the five major parties and Others by plugging in up-to-date values for our explanatory variables. We estimate two models, an unweighted and weighted version, both of which are presented in table 1. The second model weights state elections closer to the federal election more heavily in order to pick up late-developing events.
The Model

Note: Two multi-level election models. Model (2) is weighted so that state elections held on a date more closely approaching a federal election have more influence. Standard errors in parentheses. *(p < 0.05), **(p < 0.01), ***(p < 0.001)
All coefficients carry the expected sign. There is a strong positive correlation in a party’s vote share over time. The same holds for state elections which post-date the preceding but pre-date the national election to be forecasted. The coefficient on GDP growth depends on the status of a party. As expected there is no association between economic growth and a party’s vote share if it does not lead the national government. However, if it does we see the expected positive relationship. The chancellor’s time in office by and large is not predictive of an opposition party’s vote share. However, the coefficient on Years in Office for the chancellor’s party is significantly negative representing the expected cost of ruling effect.
Inserting 2017 values for our explanatory variables into the equation, we obtain predictions for each of the parties for each of the 16 German Länder. To account for differences in the size of the electorates and levels of turnout between states, we translate the party-state vote shares in each state into vote totals by multiplying the current estimates of the electorate size with the estimated vote shares and the expected turnout. The latter is estimated in a separate model. Footnote 3 We then sum these vote totals across states within parties and transform them back into proportions to arrive at an estimate of the national vote share for each party. To incorporate the uncertainty stemming from the estimation of the vote shares and turnout we simulate many predictions from both models, merge them, and then aggregate over the simulated data to provide 95% prediction intervals.
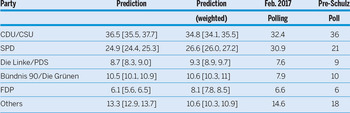
We present our predictions in table 2. In both models, the CDU/CSU retains its plurality. However, this would represent a loss of at least 5%-points vis-à-vis their performance in the 2013 election. Based on our model we expect the SPD to finish at 25% to 27%, about matching their result in the previous election. This is an improvement over polling before the former president of the European parliament Martin Schulz became the party’s candidate for the chancellorship. Yet, our forecast also suggests that current polling is overstating the electoral support of the SPD. The forecasts for Die Linke/PDS and Bündnis 90/Die Grünen are relatively stable across both models. We expect a stronger finish for the FDP in the weighted model and weaker finish for Others.
Predictions

Note: Predictions for the five major parties and a residual category – others (includes AfD) – from models without (column 2) and with (3) weights. Simulation-based 95% prediction intervals in square brackets. Columns 4 and 5 report an average of current polling at the time of draft (March 1, 2017) and the final ‘Forschungsgruppe Wahlen’ poll before the SPD announced Martin Schulz’s candidacy (January 14, 2017).
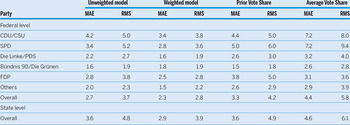
A forecasting model’s predictive validity rests on its ability to predict elections out-of-sample. When we crafted our model in early 2017 we conducted synthetic out-of-sample predictions. We did so by estimating the model on a reduced set of elections up to and excluding 1998, forecasting the 1998 election based on this model and then repeating this exercise for all further federal elections until 2013.
For these five elections we summarized the forecasting error, the deviation between prediction and actual result, as mean absolute errors (MAE) and root mean squared errors (RMSE) within and across parties (see table 3). This gives us some indication of the degree of accuracy we can expect for our forecast for 2017. We also compare our regression-based model to two much simpler forecasts. The first treats the vote share a party obtained in the preceding election as a forecast and the second takes the average of a party’s results in all preceding federal elections since 1961. Our model fares considerably better than these “naive” benchmarks. Careful readers might also notice the benefits of aggregating from the Länder up to the national level: for all methods of forecasting, the errors at the federal level are consistently and substantially smaller than for the state-level predictions.
Summarizing Forecasting Errors

Note: Party specific and overall forecasting errors based on out-of-sample predictions of the federal elections 1998 - 2013, for the federal level, and overall forecasting error only for the state level.