I. INTRODUCTION
Recently, Fe–B alloy attracts many researchers’ attention for its capacities on wear resistance and corrosion resistance in zinc melt. Reference Yi, Xing, Fu, Zhang, Zhang and Zhang1–Reference Wang, Xing, Ma, Liu, He, Yang and Bai5 In the Fe–B alloy, the hard Fe2B phase acting as the reinforcement phase plays an important role in comprehensive properties of the alloy. Compared with traditional Fe–C cast alloys, Fe2B in the Fe–B alloy has the advantage of high hardness, good thermostability, and corrosion resistance, which is superior to the Fe3C hard phase.
However, Fe2B has intrinsic embrittlement due to the weak B–B bond along [002] crystal orientation. Reference Li, Fu, Xu, Zhang and Yu6–Reference Jian, Huang, Xing and Wang9 For industry applications with impacts, Fe2B tends to fracture causing premature failure to the component, which may bring catastrophic loss. To guarantee the performance and safety of application, many researchers have explored various ways to improve the comprehensive properties of the Fe–B alloy. Reference Yi, Xing, Fu, Zhang, Zhang and Zhang1,Reference Jian, Huang, Xing, Liu, Sun, Zheng and Wang3,Reference Fu, Xiao, Kuang, Jiang and Xing11–Reference Jian, Huang, Xing, Guo, Wang and Lv17 Yi Reference Yi, Xing, Fu, Zhang, Zhang and Zhang1,Reference Yi, Xing, Zhang, Fu and Yang14 has found that with titanium, nitrogen, and cerium addition the network microstructure of Fe2B can be refined and wear properties of the Fe–B alloy can be improved. Additionally, Ma Reference Ma, Xing, Liu, Yi, Fu, Zhang and Li13 and Liu Reference Liu, Chen, Li and Hu12 have reported that the microstructure and mechanical properties of the Fe–B alloy can be ameliorated by appropriate chromium addition. Their results have given the messages that transition metal element can make contribution to the improvement of the microstructure and mechanical properties of the Fe–B alloy. In my previous researches, Reference Jian, Huang, Xing and Wang9,Reference Jian, Huang, Xing, Guo, Wang and Lv17,Reference Jian, Huang, Xing, Zheng, Sun, Liu and Liu18 the effects of chromium and manganese addition on mechanical properties and wear properties of the Fe–3.0 wt% B alloy have been explored. All these reports imply that mechanical properties of Fe2B play an important role in the application of the Fe–B alloy. In addition, Ma Reference Ma, Xing, He, Fu, Li and Liu19 and Wang Reference Wang, Xing, Ma, Liu, He, Yang and Bai5 have proposed that orientation and lamellar spacing of Fe2B have significant influence on the corrosion behavior of the Fe–B alloy in hot-dip galvanization. The report of Lv Reference Lv, Fu, Xing, Huang, Ma and Hu20 has discussed the oxidation behavior of Fe2B in the Fe–B alloy at high temperature.
To sum up, comprehensive properties of the Fe–B alloy have tight association with the microstructure and mechanical properties of Fe2B. In other words, the key point to improve the comprehensive performance of the Fe–B alloy lies on the single Fe2B phase. However, investigations about single Fe2B are difficult to be conducted due to the difficulty of separation. So the preparation of a pure bulk Fe2B sample is of great value to be explored and corresponding mechanical properties can be helpful to discuss the role of Fe2B in the Fe–B alloy. Reference Jian, Huang, Xing and Wang9,Reference Ma, Huang, Xing, Liu, He, Fu, Wang, Li and Yi10 In the previous research, Reference Jian, Huang, Xing and Wang9 it has been found that chromium addition can bring positive influence to mechanical properties of the pure bulk Fe2B sample. According to Xiao’s report, Reference Xiao, Xing, Ding and Su21,Reference Xiao22 hardness and fracture toughness of Fe2B can be improved simultaneously with one Fe atom replaced by a Mo atom in the Fe2B crystal lattice. In my present work, directional pure bulk Fe2B samples with a series of Mo additions were prepared successfully. Mo distribution in the pure bulk Fe2B and the effect of Mo addition on mechanical properties of the directional bulk Fe2B sample have been investigated systematically. The result is expected to provide guideline for designing the Fe–B alloy with superior comprehensive properties.
II. EXPERIMENTAL PROCEDURE
A. Materials preparation
In the present work, directional pure Fe2B samples with Mo addition of 0, 0.5, 1.0, 2.0, and 3.0 (in weight percent) were prepared. According to the Fe–B binary phase diagram, Reference Baker23 single Fe2B crystal can be obtained with B content reaching 8.8 wt%. By controlling the weight percent of B to be 8.8 wt%, raw materials of pure iron, ferroboron, and ferromolybdenum were melt in a vacuum induction furnace with a capacity of 500 g. The melt was superheated to 1700 °C and then poured into sand mold with a chiller under it. Reference Jian, Huang, Xing and Wang9 At last, 5 pure Fe2B samples with a dimension of φ35 × 60 mm were obtained. The directional length of the oriented sample was measured to be about 25–31 mm. For convenience, the 5 series of samples were numbered with 0 Mo, 0.5 Mo, 1.0 Mo, 2.0 Mo, and 3.0 Mo, respectively, according to Mo addition.
B. Microstructure examination
All specimens for the upcoming examinations were extracted from the directional zone by sparking cutting. The metallographic analysis were conducted utilizing an optical microscopy (OM; LEICA DMI 5000M, Leica Mikrosysteme Vertrieb GmbH, Wetzlar, Germany) and a scanning electron microscopy (SEM; VEGA II XMU INCA, Tescan, Brno, Czech Republic) equipped with energy disperse spectroscopy (EDS). The phase composition was analyzed through an X-ray diffraction (XRD). The test was carried out on a diffractometer (Rigaku D/Max-2400X, Rigaku Corporation, Tokyo, Japan) with copper Kα radiation at 40 kV and 200 mA as an X-ray source. And the specimens were scanned in the 2θ range of 15–90° in a step-scan mode (0.02° per step).
C. Mechanical properties tests
The microhardness test was carried out using a Vickers microhardness tester (HXD-1000TMC, PTE, Shandong, China) at a load of 25 gf. In this work, microhardness of Fe2B was tested on both the transversal section (perpendicular to [002]) and longitudinal section (parallel to [002]). To check the reproducibility, the average of ten readings was taken as the final hardness value.
Likewise, fracture toughness of Fe2B was also tested along different orientations. To keep precise, fracture toughness was measured by two methods, i.e., the indentation method (IM) and single edge notched bend (SENB) method, respectively. The IM is generally used to measure the fracture toughness of brittle materials, e.g., ceramics and glass materials. In recent years, a few researchers would use the IM to detect the intermetallics or second phase in the alloy. Reference Huang, Xing and Guo16–Reference Jian, Huang, Xing, Zheng, Sun, Liu and Liu18,Reference Casellas, Caro, Molas, Prado and Valls24,25 The IM has great advantage of no damage on the sample or component, nearly not influencing the following application. In this work, the Vickers indenter was used to generate cracks in the Fe2B crystal grain along different orientations and then the crack length was measured under the optical microscope. Fracture toughness (K IC) could be readily calculated by the following Eq. (1) Reference Huang, Xing and Lv15–Reference Jian, Huang, Xing, Zheng, Sun, Liu and Liu18,25–Reference Campos, Rosas, Figueroa, VillaVelázquez, Meneses and Guevara27 :
 $${K_{{\rm{IC}}}} = X \times {P \over {{C^{{3 \mathord{\left/ {\vphantom {3 2}} \right. \kern-\nulldelimiterspace} 2}}}}}\quad ,$$
where X is the residual-indentation coefficient [which equals to 0.064(H/E)1/2], H is the hardness of Fe2B in this study, E is elastic modulus (approximately 290 GPa for Fe2B Reference Huang, Xing and Lv15–Reference Jian, Huang, Xing, Zheng, Sun, Liu and Liu18 ), P is the applied load (N), and C is the indention half crack length (m).
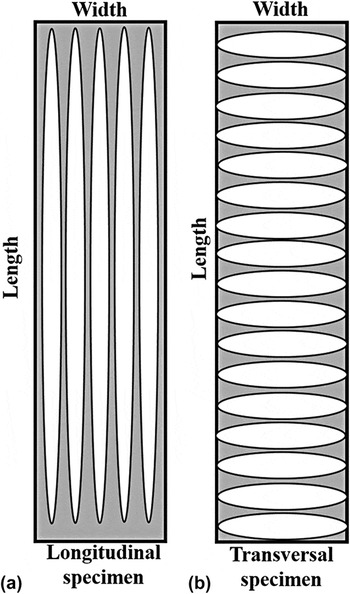
For the SENB method, a transversal specimen and a longitudinal specimen with a dimension of 3 mm (b) × 4 mm (W) × 20 mm (L 0) were tested, respectively (as depicted in Fig. 1). The specimen had a precrack on the width with the a/W ratio of 0.5. Reference Jian, Huang, Xing and Wang9,Reference Shi and Jin28,Reference Huang, Ma, Xing and Wang29 The test was conducted on an eMT-5104A electronic multi-function testing machine. Fracture toughness (K IC) could be calculated by the following Eqs. (2) and (3) Reference Jian, Huang, Xing and Wang9,Reference Shi and Jin28,Reference Huang, Ma, Xing and Wang29 :
 $${K_{{\rm{IC}}}} = Y{{3PL} \over {2b{W^2}}} \cdot {a^{{1 \mathord{\left/ {\vphantom {1 2}} \right. \kern-\nulldelimiterspace} 2}}}\quad ,$$
 $$Y = 1.93 - 3.07{a \over W} + 14.53{\left( {{a \over W}} \right)^2} - 25.11{\left( {{a \over W}} \right)^3} + 25.80{\left( {{a \over W}} \right)^4}\quad ,$$
where Y is the geometrical factor related to the crack depth ratio; P is the maximum load (N); b is the thickness of the bar (m); L is the span (m), set as 0.016 m in test; W is the width of the bar (m); and a is the initial crack length (m). At least three bars were tested for each specimen to check the reproducibility. In addition, to discuss the effect of Mo addition on the fracture toughness, fracture surface topography of the oriented bulk Fe2B specimen was observed by SEM.
Sketches of the transversal and longitudinal specimens.

D. Wear tests
The wear test of the oriented bulk Fe2B was conducted using a pin-on-disk abrasion tester (ML-100-type) at a load of 7N. Reference Jian, Huang, Xing, Liu, Sun, Zheng and Wang3,Reference Jian, Huang, Xing, Guo, Wang and Lv17,Reference Jian, Huang, Xing, Zheng, Sun, Liu and Liu18,Reference Zheng, Huang, Xing and Xiao30 SiC (hardness: HV 2600) and SiO2 (hardness: HV 900–1100) were selected as the abrasive, acting as the hard abrasive and soft abrasive, respectively. Reference Jian, Huang, Xing, Liu, Sun, Zheng and Wang3 The weight loss after the wear test was measured by an electronic balance with the accuracy of 0.1 mg. Average of three experimental data was regarded as the final weight loss value on each condition.
III. RESULTS AND DISCUSSION
A. Microstructure and phase composition
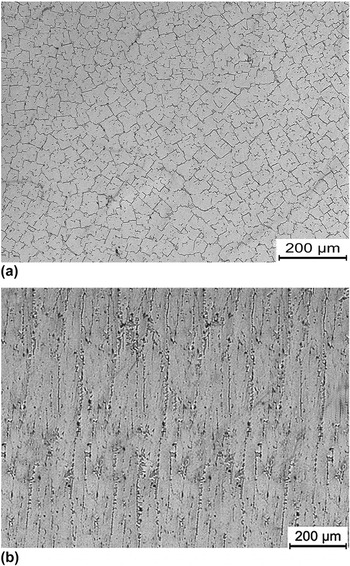
Figure 2 shows the microstructures of transversal and longitudinal sections of 2 Mo samples. From Fig. 2(a), the transversal section is filled with homogeneous Fe2B crystal grains. No other phases except a few precipitates on the grain boundary can be observed. Comparatively, columnar crystals of Fe2B distribute all over the longitudinal section, as shown in Fig. 2(b). As known, Reference Li, Fu, Xu, Zhang and Yu6,Reference Jian, Huang, Xing and Wang9,Reference Ma, Xing, Fu, He, Bai, Li and Bai31 the Fe2B crystal grows preferentially along the [002] direction during the solidification process. Thereby, the Fe2B crystal grain will grow along the negative direction of heat flow. So the distinctive metallographs for oriented bulk Fe2B are reasonable, indicating that the bulk Fe2B has a good directional zone. The microstructure characteristics of oriented bulk Fe2B in this work are somewhat similar to previous research about the pure Fe2B sample with Cr addition. Reference Jian, Huang, Xing and Wang9
OM micrographs of the oriented bulk Fe2B: (a) transversal section, (b) longitudinal section.

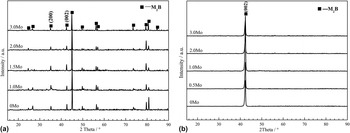
To identify the phase composition, five batches of bulk Fe2B with different Mo additions were ground to a size of 10–20 μm for XRD examination. Figure 3(a) shows the XRD patterns of Fe2B powder specimens. It can be indicated that the bulk sample only contains a single M2B phase (where M representing for Mo or Fe, JCPDS 36–1332) for each Mo addition. Additionally, with increasing Mo addition there is no new phase coming into being. In other words, Mo addition has not contributed to the phase composition change. From Fig. 3(b), XRD patterns of the transversal sections only contain the (002) crystal plane peak for all specimens. The result also helps confirm that the directional samples have been prepared successfully.
XRD patterns of 5 specimens with different Mo additions: (a) XRD patterns of nondirectional powders, (b) XRD patterns of transversal sections.

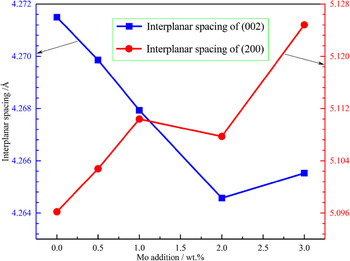
Furthermore, the interplanar spacings of (002) and (200) crystal planes of Fe2B are calculated by Bragg’s equation. Reference Jian, Huang, Xing and Wang9 As shown in Fig. 4, the interplanar spacing of (002) decreases firstly and then increases slightly with increasing Mo addition, while that of (200) has a gradually increasing trend. Due to the different atom densities on the (002) and (200) crystal planes before doping, Mo distribution will be different along each plane, which may contribute to the different changes of interplanar spacings. As stated in previous research with chromium addition, Reference Jian, Huang, Xing and Wang9 the increasing interplanar spacing of (200) may result from the existence of a larger Mo atom in the Fe2B lattice and then the interplanar spacing of (002) will accordingly decrease due to the compression of the Fe2B lattice. It is a pity that the underlying mechanism about the interplanar spacing change cannot be unraveled in the present work.
Interplanar spacings of (002) and (200) planes in the Fe2B crystal.

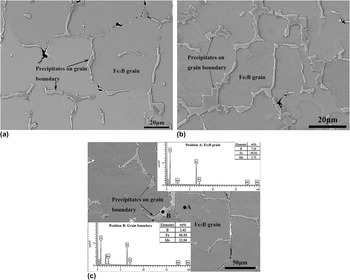
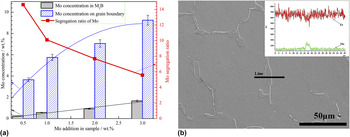
To clearly characterize the morphology of the oriented bulk Fe2B, the SEM images of transversal sections of 0 Mo, 2 Mo, and 3 Mo with high magnification are shown in Fig. 5. The transversal sections are decorated with irregular polygonal grains encompassed by precipitates. Additionally, with the increase of Mo addition, the size of the precipitates surrounding the grain boundary grows larger. It is easy to associate the size change with the addition of Mo element. To confirm the assumption, Mo concentrations in the Fe2B grain and on the boundary have been detected, respectively [the detecting positions being selected as A and B in Fig. 5(c)]. Figure 6(a) summarizes Mo distribution in the Fe2B grain and the boundary for 0.5 Mo, 1.0 Mo, 2.0 Mo, and 3.0 Mo. With increasing the Mo addition in the bulk Fe2B sample, Mo concentrations in both the Fe2B grain and the boundary rise gradually. Diversely, Mo concentration in the Fe2B grain increases linearly while the growth rate in the boundary precipitate tends to decline. In addition, Mo concentration in Fe2B is conspicuously lower than that in the grain boundary precipitates. In other words, Mo atoms tend to segregate on the boundary when added into bulk Fe2B. This phenomenon can also be apparently indicated from the linear scanning result in Fig. 6(b). The segregation ratio of Mo (the ratio of Mo concentration in grain boundary and Fe2B grain) declines with the increase of Mo addition, as shown in Fig. 6(a). This indicates that the doping efficiency of Mo in bulk Fe2B increases with the increment of Mo addition. According to the Fe–B binary equilibrium phase diagram, Reference Baker23 pure Fe2B is supposed to be obtained with B content reaching 8.8 wt%. Due to the existence of nonequilibrium cooling and impurities in raw materials, B content in a certain zone may be lower than 8.8 wt%, which contributes to the hypereutectic reaction during the solidification process. Therein, the Fe2B phase separates from the metallic liquid firstly when the temperature drops to the liquid–solid transformation line. At the same time, Mo and other elements (i.e., Si) tend to accumulate constantly in the remaining liquid. The final liquid with rich Mo and other impurities will solidify on the Fe2B grain boundary. Therefore, the higher Mo concentration on the boundary than that in the Fe2B grain can be explained reasonably. However, with the increase of Mo addition, Mo concentration in the liquid will become so high at the initial stage that further discharge of the Mo atom may be hindered to some extent. Thereby, the rise of Mo concentration on the boundary will slow down.
SEM micrographs of the transversal sections of oriented bulk Fe2B: (a) 0 Mo sample, (b) 2 Mo sample, (c) 3 Mo sample.

Energy spectrum detection of the Mo element: (a) Results of point detection, (b) result of linear scanning.

B. Hardness and fracture toughness
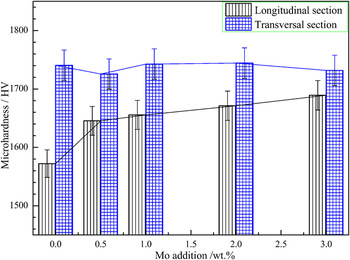
Figure 7 shows the microhardness on the transversal and longitudinal sections of the oriented bulk Fe2B. From Fig. 7, it can be visible that the microhardness of the transversal section has little change with increasing Mo addition while that of the longitudinal section gradually increases. Microhardness of the longitudinal section rises faster when Mo addition is lower than 0.5 wt%. Hereafter the rising rate of microhardness tends to slow down. In addition, microhardness on the transversal section is obviously higher than that on the longitudinal section. As discussed elsewhere, Reference Jian, Huang, Xing and Wang9 the transversal section belongs to close-packed crystal plane resulting in the higher hardness while the hardness on the longitudinal section is relatively lower due to the weak B–B bong along the [002] direction. According to the results of interplanar spacing, the spacing of (200) increases gradually, which is supposed to decrease the hardness on the transversal section. However, the hardness on the transversal section is so high that the variation less than HV20 is somewhat unapparent. With Mo addition, the interplanar spacing of (002) can be decreased, which may associate with the decrease of the B–B bond length. As a result, the B–B bond along the [002] direction may be strengthened by Mo addition. So it is reasonable for the increment of hardness on the longitudinal section. In addition, the result is consistent with the previous calculating research by B. Xiao. Reference Xiao22
Microhardness of the oriented bulk Fe2B samples with different Mo additions.

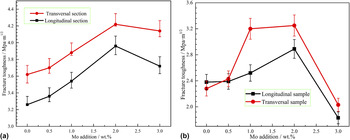
Figure 8(a) shows the fracture toughness of the oriented bulk Fe2B samples by the IM. It can be observed that, fracture toughness on both the transversal and longitudinal sections increases firstly and then decreases. And the highest toughness value is obtained at a Mo addition of 2.0 wt%. As for the longitudinal section, the variation trend of fracture toughness is exactly opposite to that of the interplanar spacing of the (002) crystal plane. The decrease of interplanar spacing of (002) may contribute to the reinforcement of the weak B–B bond. So the fracture toughness can be improved accordingly. However, the fracture toughness on the transversal section has no obvious relationship with the interplanar spacing of (200). Generally, with the increment of interplanar spacing of (200), fracture toughness on the transversal section is supposed to decrease. But Mo addition may cause lattice distortions on the (002) crystal plane which helps hinder the crack propagation in return. On the other hand, fracture toughness on the transversal section is relatively higher than that on the longitudinal section, as shown in Fig. 8(a). This phenomenon is comprehensible due to the intrinsic weakness on the longitudinal section.
Fracture toughness of oriented bulk Fe2B samples with different Mo additions: (a) By the indentation method, (b) by the SENB method.

The fracture toughness of oriented bulk Fe2B by the SENB method is shown in Fig. 8(b). With increasing Mo addition, the fracture toughness of both the transversal and longitudinal samples increases firstly and then decreases. The variation trend is exactly in accordance with these by the IM. Likewise, the toughness of the transversal sample is relatively higher than that of the longitudinal sample. So the fracture toughness of oriented bulk Fe2B by the SENB method is tightly associated with that by the IM in the last section. Compared with the values by the IM, the fracture toughness values by the SENB method are a little lower. Considering the defects on the grain boundaries, the fracture toughness of oriented bulk Fe2B by the SENB method is supposed to decrease in some degree. Furthermore, the fracture toughness becomes very bad on the contrary when Mo addition reaches 2.5 wt%. According to microstructure observation, precipitates on the boundaries increase with the increment of Mo addition. With a Mo addition of 2.5 wt%, excessive precipitates will weaken the binding force among Fe2B grains. During the bending process, cracks may firstly originate from the current position due to stress concentration. Therefore, the bulk Fe2B sample with a Mo addition of 2.5 wt% may become more brittle instead.
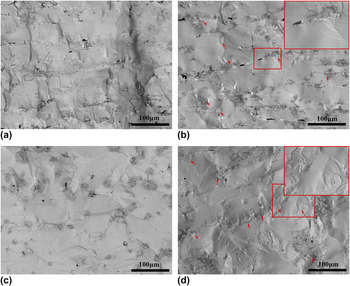
Figure 9 illustrates the SEM micrographs of fracture morphology after the SENB test. From Figs. 9(a) and 9(b), it can be visible that typical cleavage fracture takes place for transversal specimens of 0 Mo and 2 Mo. By comparison, the fracture morphology for 0 Mo is smoother without obvious obstruction during the crack propagation. For the 2 Mo sample, a few cleavage step patterns and island-like morphologies [as marked by red arrows in Fig. 9(b)] can be observed on the fracture surface. Seemingly, the crack propagation process may be more difficult for the 2 Mo sample due to the appearance of particular morphology. As supposed, with appropriate Mo addition, the hindering ability of crack propagation on the (002) section can be improved, resulting in some plasticity characteristics on the fracture surface. On the other hand, cleavage facets and river patterns can be observed on the fracture surfaces of longitudinal samples. For the 0 Mo sample, large amounts of cleavage river patterns can be observed in Fe2B crystal grains indicating typical brittle fracture. Under the high stresses during the fracture process, a crack may originate along the (002) crystal plane in the Fe2B grain firstly and then the longitudinal specimen will be broken off with further crack propagation. However, for the 2 Mo sample, a few protrusions and tearing steps can be observed on the fracture surface apart from the ordinary brittle cleavage steps. Generally, the appearance of tearing steps is a typical plasticity characteristic on the fracture surface. Reference Sun32 The distinctive characteristics of the fracture surface exactly accord well with the results of fracture toughness. Taken as a whole, the fracture toughness of the oriented bulk Fe2B can be improved with appropriate Mo addition.
Fracture morphologies of SENB samples: (a) Transversal sample of 0 Mo, (b) transversal sample of 2 Mo, (c) longitudinal sample of 0 Mo, (d) longitudinal sample of 2 Mo.

C. Wear resistance
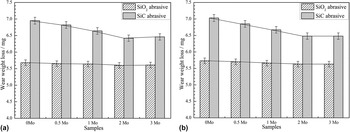
Wear losses of the orientated bulk Fe2B in cases of SiC and SiO2 abrasives are shown in Fig. 10. From Fig. 10(a), wear losses of the transversal sample in the case of SiC and SiO2 decrease firstly and then increase slightly with increasing the Mo addition, which is opposite to the fracture toughness of the transversal sample. And wear loss in the case of SiC is distinctly higher than that in the case of SiO2 abrasive. According to Richardson’s theory, Reference Richardson33 it can be easily understood considering the different hardness of SiC and SiO2. Additionally, the variation trend of wear loss in the case of SiO2 is somewhat unapparent with increasing Mo addition. Due to its lower hardness, SiO2 particles cannot effectively scratch the surface of Fe2B so that the material removal for each sample is relatively slight. On the other hand, wear losses of the longitudinal sample in the case of SiC and SiO2 have similar a variation trend with those of the transversal sample, as shown in Fig. 10(b). The variation trend of wear weight loss is also exactly opposite to the fracture toughness of longitudinal samples. Therefore, it can be indicated that fracture toughness plays a key role in the wear performance of the pure Fe2B sample. However, wear loss of the longitudinal sample is relatively higher than that of the transversal sample in the case of both SiC and SiO2 abrasives. As supposed, Fe2B can be easily peeled off during the cutting process by abrasive particles due to the relatively lower fracture toughness of the longitudinal sample. In this case, the higher wear weight loss of the longitudinal sample is reasonable.
Wear losses of the oriented bulk Fe2B samples: (a) Transversal samples, (b) longitudinal samples.

In conclusion, the oriented bulk Fe2B shows excellent wear resistance to relatively soft abrasive. In the case of both SiC and SiO2 abrasives, the wear resistance of bulk Fe2B can be improved by appropriate Mo addition. The variation is deemed to be aroused by the improvement of fracture toughness. To sum up, fracture toughness of the bulk Fe2B sample can be ameliorated by Mo addition so as to improve the wear resistance.
IV. CONCLUSIONS
The oriented bulk Fe2B samples with different Mo additions were prepared and tested in the present work. The microstructures and mechanical properties have been investigated systematically. A few insights have been summarized as follows:
-
(1) with increasing Mo addition in Fe2B, interplanar spacing of the (002) crystal plane decreases firstly and then increases slightly while that of (200) has an increasing trend;
-
(2) Mo atom tends to segregate on the grain boundaries and the segregation ratio decreases with increasing Mo addition;
-
(3) with the increment of Mo addition, microhardness on the transversal section changes little while that on the longitudinal section increases gradually; fracture toughness of both transversal and longitudinal samples increases firstly and then decreases;
-
(4) with the increment of Mo addition, wear losses of both the transversal and longitudinal samples decrease firstly and then increase slightly in the case of SiC and SiO2 abrasives.
ACKNOWLEDGMENT
This work was supported by the National Natural Science Foundations of China (No. 51371138 and 51571159) and the Program for New Century Excellent Talents in University (NCET-12-0457).