


INTRODUCTION
The role of the environment in population gene flow is a well-established concept in marine biology. Many studies attempt to elucidate the interrelation between abiotic factors and the genetic diversity of populations (Cimmaruta et al., Reference Cimmaruta, Bondanelli and Nascetti2005; Gamfeldt et al., Reference Gamfeldt, Wallén, Jonsson, Berntsson and Havenhand2005; Baselga & Fujisawa, Reference Baselga and Fujisawa2013), yet not much is known on the topic. The dispersal of species is often spatially fragmented and the causes that limit it are not easily understood (Galindo et al., Reference Galindo, Pfeiffer-Herbert, McManus, Chao, Chai and Palumbi2010). At small geographic distance scales, adaptability to habitat attributes seems to be an important factor affecting gene flow between populations (Mallet et al., Reference Mallet, Martos, Blambert, Pailler and Humeau2014) and the influence of the ecological divergence on genetic population differentiation becomes stronger (Shafer & Wolf, Reference Shafer and Wolf2013).
Seascape genetics is a term analogous to landscape genetics and refers to the effect of spatial environmental factors on marine populations and their dispersal (Galindo et al., Reference Galindo, Olson and Palumbi2006; Selkoe et al., Reference Selkoe, Watson, White, Ben Horin, Iacchei, Mitarai, Siegel, Gaines and Toonen2010; Liggins et al., Reference Liggins, Treml and Riginos2013). The focus is primarily on the barriers to the gene flow, which shape the genetic structure of populations. In the marine environment genetic structuring of populations is difficult to detect, as in most of cases, species tend to show high genetic variation but low genetic differentiation (Palumbi, Reference Palumbi1992; Galindo et al., Reference Galindo, Pfeiffer-Herbert, McManus, Chao, Chai and Palumbi2010; Riginos & Liggins, Reference Riginos and Liggins2013). Gene flow barriers can be caused by landscape attributes, environmental gradients or species life history traits (Riginos & Liggins, Reference Riginos and Liggins2013; Vandamme et al., Reference Vandamme, Maes, Raeymaekers, Cottenie, Imsland, Hellemans, Lacroix, Mac Aoidh, Martinsohn, Martínez, Robbens, Vilas and Volckaert2014).
Temporal variation of the environmental parameters should not be neglected when assessing the effect on population spatial distribution. Shifts of the abiotic and biotic characteristics can highly influence dispersal and establishment of populations (Sanford & Kelly, Reference Sanford and Kelly2011). Population distribution and establishment, especially in transitional ecosystems, is strongly related to the niche features as well as to the species dispersal ability (Chust et al., Reference Chust, Albaina, Aranburu, Borja, Diekmann, Estonba, Franco, Garmendia, Iriondo, Muxika, Rendo, Rodríguez, Ruiz-Larrañaga, Serrão and Valle2013).
Coastal lagoons are transitional ecosystems characterized by unstable spatial and temporal environmental conditions. They are shallow aquatic ecosystems, located between land and sea, and separated from the latter by barriers of land and connected to it through channels (Barnes, Reference Barnes1995). Sea and river inflows cause strong salinity gradients along the lagoons. These transitional habitats are highly enriched with organic matter, which under favourable conditions causes hypoxic or anoxic events to their sediments (dystrophic crises) (Guelorget & Perthuisot, Reference Guelorget and Perthuisot1983). These events are induced by increased microbial respiration activity, most commonly occurring under the conditions of ample organic material and nutrient concentrations, relatively high temperatures and absence of strong winds. Consequently, the oxygen consumption rate becomes extremely high, leading to mass mortality events of benthic populations (Vignes et al., Reference Vignes, Barbone, Breber, Adamo, Leonilde, Ungaro, Focardi, Renzi and Basset2009). Lagoonal systems may experience a large number of human activities (e.g. aquaculture, fisheries). These activities combined with natural disturbance are responsible for the intense stress these systems receive, allowing only a small number of tolerant species to establish viable heterogeneous populations, following the habitat patchiness (Pérez-Ruzafa et al., Reference Pérez-Ruzafa, Fernández, Marcos, Gilabert, Quispe and García-Charton2005, Reference Pérez-Ruzafa, Marcos, Pérez-Ruzafa, Barcala, Hegazi and Quispe2007). The different environmental variables, acting at spatial and temporal scales, are therefore an integral part of the population and community structuring and the gene flow process.
The lagoons of the Amvrakikos Gulf form one of the most important transitional water complexes in Greece, and have a protected status under the Ramsar Convention. The Amvrakikos lagoons were primarily formed by the influence of the Louros and Arachthos Rivers. The abiotic and nutrient profile of these lagoons varies temporally according to the seasonal freshwater inflows (Kormas et al., Reference Kormas, Nicolaidou and Reizopoulou2001). They are used for extensive aquaculture of gilthead sea bass, mullets, gobies and eels (Katselis et al., Reference Katselis, Moutopoulos, Dimitriou and Koutsikopoulos2013) but no other obvious source of extensive anthropogenic stress has been observed (Reizopoulou et al., Reference Reizopoulou, Thessalou-Legaki and Nicolaidou1996; Kormas et al., Reference Kormas, Nicolaidou and Reizopoulou2001).
The polychaete Nephtys hombergii Savigny in Lamarck, 1818 is one of the dominant macrobenthic species found in the lagoons of the Amvrakikos Gulf. The species is considered to be perennial, as it is estimated to live up to 5 years (Mathivat-Lallier & Cazaux, Reference Mathivat-Lallier and Cazaux1991; Schmidt & Westheide, Reference Schmidt and Westheide1994) with an advanced swimming capability (Polytraits Team, 2013). Nephtys hombergii worms start spawning from the second year of their lives and they produce a trochophore larva; however, they do not spawn every year (Schmidt & Westheide, Reference Schmidt and Westheide1994; Lawrence & Soame, Reference Lawrence and Soame2004). The larvae have a 2-month planktonic phase before establishing in the sediment as juveniles (Mathivat-Lallier & Cazaux, Reference Mathivat-Lallier and Cazaux1991). Nephtys hombergii is used in long-term monitoring programmes as a bioindicator (Schmidt & Westheide, Reference Schmidt and Westheide1994). Nephtys hombergii is one of the key species of macrobenthic communities, it combines a planktonic larval phase and it is one of the most abundant species in the lagoons under study; these attributes were considered important for the aims of the study.
Determining the environmental factors that are responsible for the population structuring and the gene flow patterns were the main focus of the study. The rates at which abiotic factors fluctuate in space and time are much higher in lagoons than in other coastal and marine environments. Thus their impact on the populations is more intense, rendering these ecosystems ideal for the assessment of the environment on the gene flow and population patterns. The environmental components variation of the lagoons is also strong on a temporal scale. Therefore, comparing the changes of genetic diversity across the lagoonal complex of Amvrakikos Gulf over different sampling seasons was considered an important aspect of the study.
MATERIALS AND METHODS
The sampling area is located in Amvrakikos Gulf (W Greece) (Figure 1). Specimens of N. hombergii were collected from the lagoons of Logarou (39°02′N 020°54′Ε), Tsoukalio (39°03′N 020°48′Ε), Mazoma (39°00′N 020°44′Ε) and Tsopeli (39°02′N 020°46′E). Out of the four lagoons sampled, Logarou is the largest with a surface area of 28,000 ha. Tsoukalio is separated from the sea by sand barriers with narrow openings allowing limited water exchange. Mazoma is a small lagoon formed in the opening of the Louros River with a surface area of 300 ha. Tsopeli is the smallest of the four lagoons (~120 ha surface area) without any obvious source of pollution. Macroalgae (Ulva) and angiosperms (Zostera) were found in Tsopeli, while angiosperms (Cymodocea) were also present in Tsoukalio lagoon. Tsopeli and Mazoma lagoons experience less intensive anthropogenic disturbance as compared with Tsoukalio and Logarou. In Tsoukalio and Logarou the aquaculture activities carried out are more intense and the production of the fish species is higher in comparison to Tsopeli and Mazoma. The depths of the lagoons range between 0.20–1.5 m. The water columns of the lagoons are well-mixed through the whole year, as a result of their shallow depth in combination with the wind activity and the river inflows. Hence, the currents have a weak influence on the functions of these systems.
Map of the sampling locations in the lagoons of Amvrakikos Gulf (W Greece).
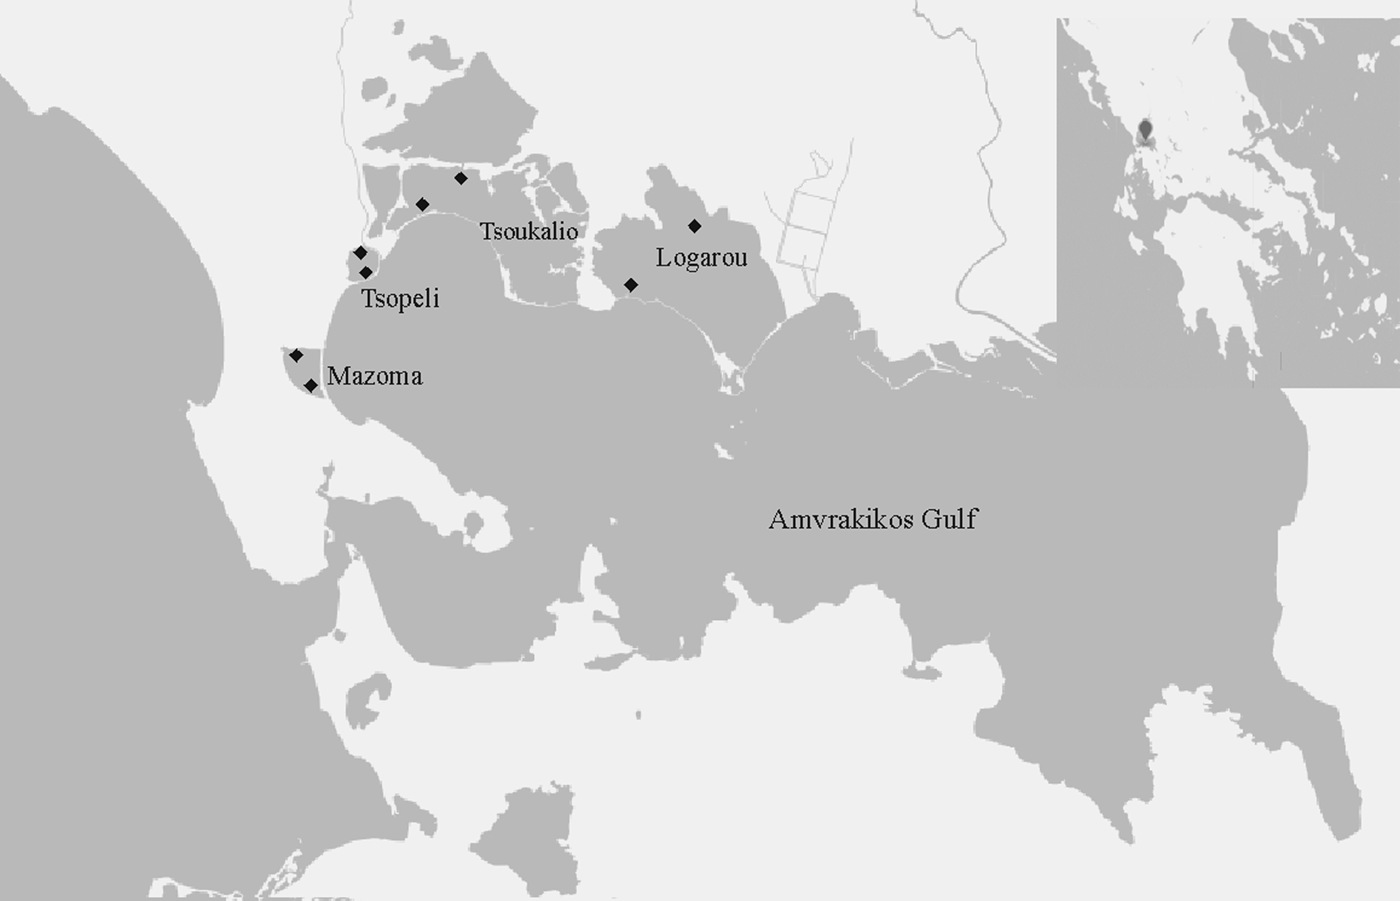
Two sites were sampled in each of the lagoons: one located near the opening connecting the lagoon to the sea and another in its inner part (Figure 1). Four samplings were completed: September 2010, February 2011, May 2011 and July 2011. Three replicate water samples from each station were analysed for the estimation of nutrient concentrations: phosphate, nitrate, nitrite, ammonium and silicon dioxide following the protocols of Grasshoff et al. (Reference Grasshoff, Ehrhardt and Kremling1983) and Parsons et al. (Reference Parsons, Maita and Lalli1984). Three replicate units of both water and sediment samples were used to assess chlorophyll-a and particulate organic carbon (POC) concentrations using the protocols of Hedges & Stern (Reference Hedges and Stern1984) and Yentsch & Menzel (Reference Yentsch and Menzel1963). The concentrations of chlorophyll-a and POC were estimated in micrograms per water litre (μg l−1) and micrograms per sediment gram (μg g−1). Moreover, the percentage of labile organic matter (labile OM) concentration in the sediment was estimated according to the methods described by Loh et al. (Reference Loh, Miller, Reeves, Harvey and Overnell2008). Additional sediment samples were collected for granulometry following the protocols by Gray & Elliott (Reference Gray and Elliott2009). Furthermore, temperature, salinity and pH were measured in the water column and conductivity and redox potential (Eh) were measured in the first two centimetres of the sediment by means of a portable multi-parameter (WTW Multi 3420 SET G). Average values of the abiotic parameters per station and per season are given in Table 1. Faunal samples were collected by a modified manually operated box-corer. Five replicate units, corresponding to a total sampling surface of 0.084 m2, were collected at each station. Polychaetes were sorted in situ and all individuals were preserved in 95% ethanol. From Logarou lagoon 73 specimens were collected, while 32 were found in Tsoukalio, 29 specimens in Mazoma and 15 in Tsopeli lagoon. The numbers of individuals per sampling season were: 58 in Autumn, 34 in Winter, 31 in Spring and 26 in Summer. The taxonomic identification of N. hombergii species was carried out by using the taxonomic key of Rainer (Reference Rainer1991).
The average values of the environmental variables from the lagoons of Amvrakikos Gulf per lagoon and per sampling season.

Polychaete DNA was isolated with a phenol/chloroform/isoamyl alcohol protocol. A fragment of COI gene was amplified using the primers NEPHF (5′-GTTTCGGTCTGTCAGAAGCA-3′) and NEPHR (5′-ATCTTTGGCACATGAGCGGGA-3′) specifically designed for this study. Reactions were of 20 µl final volume and contained 1 µl DNA template, 2 µl 10× PCR buffer, 2 mM MgCl2, 200 µM of dNTPs, 0.25 µM of each primer, and 0.5 Units of KAPATaq DNA Polymerase (KAPA BIOSYSTEMS, Boston, USA). Polymerase Chain Reactions (PCR) were carried out under the following thermal conditions: 94 °C for 5 min; 36 cycles with 94 °C for 1 min, 50 °C for 2 min, 72 °C for 1 min; 72 °C for 3 min. Amplification products were sequenced in ABI3730 at the Genetics Lab of the Institute of Marine Biology, Biotechnology and Aquaculture (HCMR). Sequences of the unique haplotypes acquired were submitted to GenBank (accession numbers KP144875–KP144926). All sequences were aligned in MEGA v5 software with Clustal W algorithm (Tamura et al., Reference Tamura, Peterson and Peterson2011).
The analyses were applied on 149 sequences of total length 270 bp. The same analysis was applied also on a dataset of 600 bp length sequences (Supplementary Material, Section II) to verify the evidence from longer sequences. The genetic analysis was applied in an attempt to infer population patterns and gene flow changes over the lagoons and seasons. Both the phylogenetic networks and the diversity indices were used to estimate the genetic diversity of the species. The networks not only provide an estimation of the genetic diversity but they also depict the frequency that each haplotype was observed in the population, as well as the connections between the different haplotypes. The networks were created with NETWORK 4.6.1.1 (Fluxus Technology Ltd). Haplotype (Hd) and nucleotide (π) diversity indices can be used as a means to infer the demographic history of populations. The values of the Hd index are considered high when they exceed the threshold of 0.5, while for the π this threshold is determined at the 0.5%. High values of both indices are indicative of large and stable populations. Both indices were calculated with DNASP v.5 (Librado & Rozas, Reference Librado and Rozas2009).
Three different approaches were used in order to verify whether N. hombergii was represented by cryptic species or not. The first method used was the estimation of pairwise genetic distances using Kimura-2-Parameter in MEGA v5 software. The distances among the sequences of N. hombergii were compared with the distances between the sequences of the congeneric species N. cirrosa, N. longosetosa and N. punctata available from GenBank (accession numbers GU179408, HM904907, HM473494 respectively). The distances were also calculated from sequences of the 16S gene (mtDNA) and 18S gene (nuclear DNA). Additionally, the Automatic Barcode Gap Discovery (ABGD) approach was used (Puillandre et al., Reference Puillandre, Lambert, Brouillet and Achaz2011). In the ABGD approach a distance threshold is specified from a given dataset. This threshold is then used to determine species. In cases in which the threshold cannot be recognized, the sequences are interpreted as belonging to the same species (Puillandre et al., Reference Puillandre, Lambert, Brouillet and Achaz2011; Fontaneto et al., Reference Fontaneto, Flot and Tang2015). The analysis was implemented through the ABGD webpage (http://wwwabi.snv.jussieu.fr/public/abgd/) the default settings were used and the distances were again estimated using Kimura-2-Parameter. The sequences of N. cirrosa, N. longosetosa and N. punctata were included in the analysis. The third technique was the calculation of K/θ (Birky, Reference Birky2013). The approach is based on the theory that the sister clades of a given tree are more than 95% possible to represent different species when the ratio of interclade divergence (K) to intraclade variation (θ) is higher than 4 (Fontaneto et al., Reference Fontaneto, Flot and Tang2015).
A series of statistical methods were executed in order to obtain an estimate on the genetic diversity and on the distribution of the haplotypes in the lagoons and through the seasons. To attain an estimation of the population gene flow between the different lagoons and different sampling seasons, the pair-wise fixation (FST) index between pairs of samples was calculated. The Analysis of Molecular Variance (AMOVA) was used to determine the variance of populations between seasons, within seasons, between lagoons, within lagoons and within populations of the lagoons. To test the significance in the intra- and inter-population variance 1023 permutations were used. The AMOVA analysis was performed using ARLEQUIN v. 3.5 software (Excoffier & Lischer, Reference Excoffier and Lischer2010).
Moreover, neutral tests (Fu's F (Fu, Reference Fu1997) and Tajima's D (Tajima, Reference Tajima1989)) were applied. Negative values of the tests imply that the populations have experienced a recent expansion, while positive values signify that the populations have been subjected to a recent bottleneck (Lorenzo-Carballa et al., Reference Lorenzo-Carballa, Hadrys, Cordero-Rivera and Andrés2011). The significance of the values obtained was tested by random permutation, using 1000 replicates. The ARLEQUIN v. 3.5 software was used to apply the latter analyses (Excoffier & Lischer, Reference Excoffier and Lischer2010).
The mismatch distribution was applied to the data from the Amvrakikos lagoons. The model assumes that populations increase the total number of individuals and expand their allocation range (Ray et al., Reference Ray, Currat and Excoffier2003; Excoffier, Reference Excoffier2004). The observed distributions were compared against those of the model of spatial expansion. The results of the mismatch distribution were combined with those from the neutral tests and goodness-of-fit tests to infer population demography. Non-significant values of sum of squared deviation (SSD) and raggedness index indicate population expansion. The significance of the values and the mismatch distribution were tested based on 1000 permutations. The analysis was conducted with the ARLEQUIN v. 3.5 software (Excoffier & Lischer, Reference Excoffier and Lischer2010). The distribution patterns were characterized following the study of Patarnello et al. (Reference Patarnello, Volckaert and Castilho2007).
The following techniques were chosen in an attempt to identify the environmental parameters that influence the haplotype distribution patterns. Matrices of haplotype frequencies over the stations and seasons were first constructed and the similarities between the stations were then estimated by applying the Bray–Curtis similarity coefficient (Bray & Curtis, Reference Bray and Curtis1957). The process resulted in the construction of triangular resemblance matrices, which subsequently were subjected to the non-metric multidimensional scale analysis (nMDS) in order to assess genetic multivariate similarity patterns. Permutational multivariate analysis of variance (PERMANOVA) (Anderson, Reference Anderson2001) was performed to test for the significance of the sampled lagoons and of the sampling seasons to the revealed genetic multivariate patterns. To identify the abiotic variables best associated with the patterns deriving from the haplotypic data, the BIO-ENV analysis was applied by using the weighted Spearman rank coefficient (Clarke & Ainsworth, Reference Clarke and Ainsworth1993). The coefficient values range between −1 and 1, with −1 attributed to absolute reverse monotony and with 1 to absolute congruent ones between the multivariate patterns of the abiotic and biotic variables. The RELATE routine was additionally employed to test the significance of correlations (Clarke & Gorley, Reference Clarke and Gorley2006). The PRIMER6 v. 6.1.8 (Clarke & Gorley, Reference Clarke and Gorley2006) software was used for all of the above analyses.
All of the aforementioned analyses were applied on two different models: for the first model, populations were defined according to their distribution in the lagoons (Logarou, Tsoukalio, Mazoma, Tsopeli), whereas for the second model only one population was assumed for the whole area of the Amvrakikos Gulf and variation was estimated between the populations collected in different sampling seasons (Autumn, Winter, Spring, Summer).
Finally, the width of each specimen was measured in an attempt to define whether the individual was a newly recruited juvenile or it was an adult over 1 year old. The values obtained were clustered into two different categories according to their width ranges. Each size range corresponds to a different age class: (i) the first class for specimens with width ranges 0–1 mm corresponding to the juveniles, (ii) the second class for ranges over 1.2 mm for adult individuals. Size ranges were defined according to Olive et al. (Reference Olive, Garwood, Bentley and Wright1981).
RESULTS
A fragment of 270 bp of COI gene was sequenced. The genetic analysis revealed the existence of 52 unique COI haplotypes for the N. hombergii collected from the Amvrakikos Gulf lagoons. The greatest distance between haplotypes was found to be 25 mutational steps. All of the haplotypes presented in this study are reported for the first time; the COI gene for the species N. hombergii is still under-researched.
The phylogenetic network produced was complicated, consisting of many distant nodes and unique haplotypes (Figures 2 & 3). The network is depicted in two versions: one with the haplotype distribution to the sampling stations (Figure 2) and one with their distribution to the sampling season (Figure 3). Three different haplogroups were observed: Haplogroup A including the haplotypes H1–H32; haplogroup B including the haplotypes H33–H43; haplogroup C including the haplotypes H44–H52. The distance between Hap 8 and Hap 43 was estimated to be 8 mutational steps, while between Hap 8 and Hap 47 was 11 mutational steps. Interestingly, though no specific spatial structuring is observed, there is clear change of the haplotypes present over the sampling seasons.
Median-joining phylogenetic network with the haplotype distribution per lagoon. The size of the circles is proportional to the frequency of the haplotypes. The size of branches is proportional to the number of mutational steps between the nodes. The capital letters ‘A’, ‘B’ and ‘C’ refer to the different haplogroups.

Median-joining phylogenetic network with the haplotype distribution per sampling season. The size of the circles is proportional to the frequency of the haplotypes. The size of branches is proportional to the number of mutational steps between the nodes. The capital letters ‘A’, ‘B’ and ‘C’ refer to the different haplogroups.

Further tests were applied on the possible occurrence of cryptic speciation of N. hombergii, due to the high genetic diversity described by the phylogenetic networks. Pairwise genetic distance values between the haplogroups ranged between 0.044–0.057 for the COI gene. Additionally, the distances between the different N. hombergii haplogroups and N. longosetosa, N. punctata and N. cirrosa were calculated. The values ranged over 0.233–0.254 between the haplogroups and N. longosetosa, over 0.190–0.205 when compared with N. cirrosa and over 0.214–0.220 when compared with N. punctata. The distance value for the sequences of N. hombergii from 16S gene was calculated to be d = 0.017. The same value obtained from the same analysis applied to the 18S gene was found to be 0.001 (results are shown in Table 2).
Pairwise distances between the different COI haplogroups of N. hombergii (standard error values in parentheses).

The ABGD approach identified eight partitions with four groups in each one. In the first group all the sequences of N. hombergii were assembled, while the remaining three units were the sequences of the species N. cirrosa, N. longosetosa and N. punctata (Figure 4). The prior maximal distance ranged from P = 0.001 to P = 0.03. The K/θ ratio was estimated among the sequences of N. hombergii. The value of the index was found to be 0.95, showing that the hypothesis of cryptic species for N. hombergii cannot be supported.
Neighbour-joining tree obtained by the ABGD method. Dashed lines show the different groups as defined by the analysis. All the haplotypes of N. hombergii were assembled in one group.

The values of haplotype and nucleotide diversity indices (Table 3) were high for both indices for all the lagoons and seasons. High index values imply that the populations were large and stable. The indices showed that the lowest haplotype and nucleotide diversity occurred in Tsoukalio lagoon. At the seasonal scale, highest haplotype and nucleotide diversity values were calculated in Autumn, while the lowest were in Summer.
Genetic diversity indices, neutrality tests, SSD and Raggedness index for both spatial and seasonal models. Significant values are shown in bold (P < 0.05; P < 0.02 for Fu's F).

Hd, haplotype diversity index; π, nucleotide diversity index.
The gene flow between populations of lagoons was estimated through pairwise Fsts (Table 4). The low values obtained by the analysis indicated unrestricted gene flow between lagoons and between the seasons. The negative values obtained for Tsopeli were probably due to the small number of observations available. The results of the AMOVA analysis demonstrating the genetic variance between lagoons and seasons are shown in Table 5. The values of fixation indices for the spatial model of variance were not significant. However, the analysis was significant for the seasonal model and revealed that variance between seasons was not high (~5%) but 95% of variance was calculated within populations.
Pairwise Fsts between the populations of four lagoons of Amvrakikos Gulf and between the different sampling seasons. Significant values are shown in bold (P < 0.05).

AMOVA analysis results for both seasonal and spatial models of variation. Significant values are shown in bold (P < 0.05).

In line with the previously presented analyses, the mismatch distribution analysis was applied on data of populations per lagoon and per sampling season (Figure 5). The patterns were following bimodal distribution for all the lagoons except Tsopeli, where the plot showed a ragged distribution. The values of both the SSD and raggedness index were non-significant for all the lagoons. Similarly, non-significant values were calculated for both neutrality tests, except from a negative F value in Logarou lagoon (Table 3).
Mismatch distribution patterns. On the horizontal axis are the numbers of pairwise differences; on the vertical axis are the frequencies of haplotypes. Patterns a–d show the results of the populations per lagoon. Patterns e–h show the results of the populations distribution per season.

Mismatch distributions inferred from population data by season presented bimodal patterns for Autumn, Winter and Spring populations, whereas the one for the Summer population appeared to be skewed unimodally. The values of SSD and raggedness index were non-significant for all seasons. For Autumn, the F values were found to be significantly negative (Table 3). Similarly, significantly negative D values were found for the Spring and Summer populations, whereas all the values were non-significant for the Winter populations (Table 3).
The plot of nMDS analysis applied on sequence data over stations showed the stations from Logarou and Tsoukalio lagoon to be placed closer to each other. However, no significant grouping of stations was observed (Figure 6). The PERMANOVA routine demonstrated non-significant results with the lagoons as a tested factor (Pseudo-F = 1.82; P > 0.05). Nevertheless, the multivariate pattern derived by seasonal genetic frequency data presented greater resemblance between summer and winter, while autumn and spring were placed far more distantly (Figure 7). The PERMANOVA test showed significance with the seasons as a tested factor (Pseudo-F = 2.29; P < 0.05).
Plot of the nMDS analysis of haplotype frequency similarities of N. hombergii populations from different lagoons.

Plot of the nMDS analysis of haplotype frequency similarities of N. hombergii populations from different sampling seasons. Aut was used for the autumn sampling season, Win represents the winter sampling season, Spr was used for the spring sampling and with Sum was labeled the summer season.

The results of the BIOENV analysis are shown on Table 6. The weighted Spearman coefficient value (ρw) was calculated to be at the level of 0.44 when the abiotic factors were correlated with the biotic pattern deriving from the stations. The abiotic variables associated with the haplotype pattern at the station level were the concentration of the O2 in the water column and the sediment redox potential (Eh). The RELATE analysis showed an almost borderline value of 5.1% significance level. A much higher Spearman's coefficient value (ρw = 0.88) was calculated from the comparison of the seasonal pattern with that of the abiotic variables. Here, PO4 concentration in the water, pH and Eh were found to be correlated with the aforementioned pattern. However, the significance level obtained by the RELATE analysis was 7.3%.
BIOENV analysis results for the seasonal pattern and the pattern of stations. ρw is the weighted Spearman correlation coefficient.

On the classification of the specimens following their age class, only two individuals were found to be in the age class of the juveniles, as their width was measured to be less than 1 mm. The rest of the specimens were classified as adults (147 individuals). Therefore, the populations, during the samplings, were found to consist of adult individuals of more than a year old, rather than newly recruited ones.
DISCUSSION
The genetic analysis of the COI gene of N. hombergii shows a much greater variance than hitherto known. Nevertheless, the existence of cryptic species is not supported by the pairwise genetic distances obtained from COI, 16S and 18S data, as the values were found to be under 6%, while the distances between N. hombergii and N. cirrosa were calculated to be over 19%, between N. hombergii and N. longosetosa was found to be over 23% and between N. hombergii and N. punctata over 21%. The cryptic species existence is not supported either by the ABGD approach or the K/θ ratio. The results of the ABGD method included all the haplotypes of N. hombergii in one group, even for the lowest P values. The K/θ ratio was calculated to be lower than 4. The great intraspecific variability observed from the phylogenetic networks contradicts the findings from isozyme data (Schmidt & Westheide, Reference Schmidt and Westheide1994) where the polymorphism was remarkably low between different populations from Europe. Moderate polymorphism was ascribed to the excessive dispersal ability of the species larvae (Schmidt & Westheide, Reference Schmidt and Westheide1994).
The values of the pairwise Fsts are evidence that gene flow is unrestricted between lagoons and through the seasons. In addition, the AMOVA analysis indicated that intra-population variability may well be responsible for the observed divergence rather than variability between seasons. This is an anticipated result since the trochophore larvae of N. hombergii can be widely distributed as they are transferred by the water currents (Schmidt & Westheide, Reference Schmidt and Westheide1994) and they settle into the sediments 2 months after spawning (Mathivat-Lallier & Cazaux, Reference Mathivat-Lallier and Cazaux1991). The great larval dispersal potential along with the advanced swimming ability of the adults could explain free gene flow between populations. The above results support the argument that the populations of the species from the lagoons of Amvrakikos, come from a common pool.
Considerable degree of genetic variability ensures stability of populations and resistance to disturbance (Abbiati & Maltagliati, Reference Abbiati and Maltagliati1992; Gamfeldt et al., Reference Gamfeldt, Wallén, Jonsson, Berntsson and Havenhand2005; Reusch et al., Reference Reusch, Ehlers, Hämmerli and Worm2005; Gamfeldt & Källström, Reference Gamfeldt and Källström2007). At the scale of the lagoons, the mismatch distribution combined with the neutrality tests, the goodness-of-fit tests and the diversity indices, all suggest that the N. hombergii populations in the lagoons of Amvrakikos have a constant size. The only evidence of a possible spatial expansion can be seen for Logarou. The bimodal pattern of mismatch distribution is usually related to populations with stable size. In some cases, however, it can also be interpreted as multiple population expansions (Alvarado-Bremer et al., Reference Alvarado-Bremer, Viñas, Mejuto, Ely and Pla2005; Patarnello et al., Reference Patarnello, Volckaert and Castilho2007). The SSD and raggedness index values obtained in Logarou lagoon were non-significant, supporting a possible expansion of the population in this lagoon. The significant negative value of Fu's F test also underpins this hypothesis.
On the seasonal scale, the population patterns show stable size for both Winter and Spring, while this does not seem to be the case for the Autumn and Summer populations. In Autumn the case of a spatial expansion seems possible, as the values of SSD and raggedness index were non-significant, combined with a significant negative F value and the bimodal distribution of the plot. The mismatch distribution plot is different for the Summer. The skewed unimodal plot, the significant negative D values, together with the non-significant SSD and raggedness index, indicate that the population has undergone a recent expansion.
The aforementioned outcomes need to be interpreted under the spectrum of a seasonal time scale, thus they represent the population size ranges by season, rather than by historical events. Therefore, the putative expansion events of Autumn and Summer imply changes of the population size only over these seasons. Interestingly, the N. hombergii mismatch distribution plots show that seasonally shrinking populations seem to follow the same patterns as the populations that experience reduction in size over demographic history (they tend to have higher frequencies of sequence pairs with low mismatch counts) (Hamilton, Reference Hamilton2009). During summer, the population not only tends to lose haplotypes, but the present haplotypes tend to have smaller numbers of different nucleotide sites. The latter is also obvious from the network of haplotype distribution per season, where the summer haplotypes were found to be within small distances of each other.
The network was complex with the presence of distant nodes and many unique haplotypes (41 out of 52). However, the location did not seem to play an important role in the distribution of haplotypes, as the most frequent haplotypes were found in almost all the lagoons. On the contrary, the seasonal haplotype pattern change was noticeable on the network plot: great distances were found between the haplotypes. The haplogroup A was the most diverse, consisting of many unique haplotypes differentiated by many mutation steps. The great diversity observed within haplogroup A provides evidence for a stable population. The great complexity of haplogroup A compared with the other haplogroups suggests the existence of an older population in the lagoons and two populations more recently established (Posada & Crandall, Reference Posada and Crandall2001). This inference is also supported by the fact that haplogroup A was found in all the sampling seasons, showing tolerance to the local environmental conditions, while haplogroups B and C were observed only during certain seasons. Haplogroup C was mostly found during Winter and Autumn, while it seemed to disappear during Spring and Summer. Similarly, haplogroup B is present only during Autumn and Spring and appears to be completely lost during Summer and Winter. The seasonal heterogeneity of the haplotype distribution in opposition to the spatial homogeneity, seems to be analogous to the abiotic variables ranges, where the differences between the seasons are greater than between the lagoons (Table 1).
Vergara-Chen et al. (Reference Vergara-Chen, Gonzalez-Wanguemert, Marcos and Perez-Ruzafa2013) as well as Rodrigues et al. (Reference Rodrigues, Valente and González-Wanguemert2015) attempt to assess the influence of fluctuating conditions on the genetic diversity in lagoonal populations of Cearstoderma glaucum and Holothuria arguinensis respectively. The populations of H. arguinensis were found to have high rates of gene flow among localities. However, for C. glaucum lack of gene flow between localities was correlated to sediment allocation, bottom vegetation and small salinity variations. Salinity and temperature have been stated to be the main factors responsible for spatial genetic structuring of transitional water ecosystems (Bilton et al., Reference Bilton, Paula and Bishop2002). Nevertheless, in the present study, populations were found to be influenced by the changing regime, temporally, rather than spatially. The results of BIOENV analysis do not seem to be in line with the findings provided in the literature resources above: redox potential, which is associated with the oxygen concentration in the sediment, along with the oxygen concentration in the water column, are the factors mostly correlated with the seasonal patterns of the populations of Amvrakikos lagoons.
The effect of temporal changes on the transitional ecosystem assemblages of Evros Delta has been assessed by Gouvis et al. (Reference Gouvis, Kevrekidis and Koukouras1997), who observed highest values of abundance and biomass of the benthic communities occurring during spring. Similar studies in lagoonal ecosystems (Gravina et al., Reference Gravina, Ardizzone, Scaletta and Chimenez1989; Kevrekidis, Reference Kevrekidis2004; Como & Magni, Reference Como and Magni2009; Prado et al., Reference Prado, Caiola and Ibáñez2014a) showed significant seasonal variation in the abundances of benthic assemblages, with two peaks to the abundance of species assemblages: one in spring and a second one in autumn. During these seasons, good mixing of the water column and rise of oxygenation in both the water and sediment have been observed. According to the above authors, benthic diversity loss takes place during summer and is mostly related to high temperature and salinity, low oxygen concentration and higher rate of predation. In other cases, the seasonal variability of macrobenthic communities has been attributed not only to salinity and temperature but also to oxygen concentration and organic matter in the sediment associated with freshwater inflows (Prado et al., Reference Prado, Caiola and Ibáñez2014a). In the lagoons of Amvrakikos the seasonal intraspecific patterns of N. hombergii were also found to be highly correlated with the redox potential, together with the PO4 concentration and pH, although not significantly. Interestingly, only some of the haplotypes (H7, H8, H19) seem to be more tolerant to the ranges of values these factors reach and this may be the reason they are found more frequently than the rest.
Although seasonal changes seem to be essential in the life cycle of the species temperature shifts have been reported to be important only for triggering the release of the spawning hormone (Lawrence & Soame, Reference Lawrence and Soame2004), thus temperature was not related to the population distribution by the analysis. The mature adults of the species do not spawn every year (Schmidt & Westheide, Reference Schmidt and Westheide1994; Lawrence & Soame, Reference Lawrence and Soame2004) therefore recruitment rate in the populations is low.
The reduced haplotypic diversity of N. hombergii in the lagoons during the summer season is also in accordance with the decrease of the species diversity recorded previously (Cancela da Fonseca et al., Reference Cancela da Fonseca, Costa and Bernardo1989; Sfriso et al., Reference Sfriso, Birkemeyer and Ghetti2001; Kevrekidis, Reference Kevrekidis2004). Summer seems to be the season with the highest environmental stress for the biota of the lagoons (Cancela da Fonseca et al., Reference Cancela da Fonseca, Costa and Bernardo1989). A plausible scenario for the seasonal shift of the haplotype pattern, suggests that parts of the populations with certain haplotypes retreat back to the marine environment, in favour of others, more resistant to abrupt switches of the environmental conditions. Only a few haplotypes with low nucleotide diversity between them appeared in the lagoons suggesting that only the less sensitive haplotypes could tolerate the stress conditions. The specimens used for this study were adult individuals (only two juveniles were found) showing a possible disappearance and reappearance of haplotypes in different seasons, owing to migratory movements of individuals rather than recruitment of larvae. Therefore, it appears that haplotypic diversity can be strongly influenced not only by ecological distance but also by seasonal fluctuations within the same habitat.
Changes of haplotype distribution patterns as a response of N. hombergii populations to the environmental fluctuations bring new arguments for the issue of management planning by taking the genetic approaches into account. The subject has been raised in previous studies, suggesting that conservation plans should be aiming towards intraspecific diversity, population genetics and demography (Lande, Reference Lande1988; Bisol et al., Reference Bisol, Gallini, Prevedello, Rianna, Bernardinelli, Franco and Zane2007). Cognetti & Maltagliati (Reference Cognetti and Maltagliati2004) underlined the importance of intraspecific diversity in marine environment management frameworks. Management plans should aim mostly at the population level rather than the community one, especially for the systems with few species (Cognetti & Maltagliati, Reference Cognetti and Maltagliati2004; Gamfeldt et al., Reference Gamfeldt, Wallén, Jonsson, Berntsson and Havenhand2005).
Understanding the interrelation of populations with the ecosystem components is of major importance for developing management tools and strategies. Recent studies are heading in this direction (e.g. Maltagliati, Reference Maltagliati2002; Aylagas et al., Reference Aylagas, Borja and Rodríguez-Ezpeleta2014), especially in transitional systems (Chust et al., Reference Chust, Albaina, Aranburu, Borja, Diekmann, Estonba, Franco, Garmendia, Iriondo, Muxika, Rendo, Rodríguez, Ruiz-Larrañaga, Serrão and Valle2013; Vergara-Chen et al., Reference Vergara-Chen, Gonzalez-Wanguemert, Marcos and Perez-Ruzafa2013; Prado et al., Reference Prado, Vergara, Caiola and Ibáñez2014b). The present study is an attempt to elucidate the role of environmental variables on the genetic diversity and gene flow patterns of populations in different lagoons and over different sampling seasons, in order to provide evidence to facilitate the development of future conservation plans.
SUPPLEMENTARY MATERIAL
The supplementary material for this article can be found at https://doi.org/10.1017/S0025315416001910.
ACKNOWLEDGEMENTS
The authors would like to acknowledge Amvrakikos Management Body for their help during the fieldwork and also Dr Eugenia Apostolaki, Dr Giorgos Chatzigeorgiou, Dr Eva Chatzinikolaou, Dr Lucia Fanini, Dr Evagelos Pafilis and Dr Nafsika Papageorgiou for their contribution to the sampling. Special thanks should be attributed to Dr Dimitris Tsaparis for the fruitful conversation and the constructive remarks.
FINANCIAL SUPPORT
The study was supported by the EUBON project (grant agreement no. 308454), funded by the European Union's 7th FP.



