Introduction
After fertilization, mammalian preimplantation embryos undergo mitotic cleavage and increase the number of embryonic cells. During early cleavage stages spherical blastomeres keep their clear outline and contact with each other is at a minimum area. Then, they suddenly increase the cell-to-cell contact area in the outer blastomeres, resulting in a well known phenomenon, compaction. Embryos post compaction are generally called morulae, and eventually accumulate embryonic fluid inside and develop into blastocysts. Thus, embryonic cells differentiate into trophectoderm (TE) cells that contribute to the embryonic placenta, and inner cell mass (ICM) cells, which produce the fetus and related membrane structures. The TE is the first observed epithelial tissue in mammalian development that surrounds the ICM cells, and generates the blastocoel cavity which benefits the ICM by vectorial transport of ions, water, and other small molecules (Biggers et al., Reference Biggers, Bell and Benos1988; Watson et al., Reference Watson, Natale and Barcroft2004).
In mouse, the cell-to-cell adhesion mediated by E-cadherin and β-catenin complexes are initiated after the 8-cell stage, and causes compaction that leads to differentiation of the TE. Coincident with cell-to-cell adhesion, compaction also induces polarization of outer blastomeres (Hyafil et al., Reference Hyafil, Morello, Babinet and Jacob1980; Ohsugi et al., Reference Ohsugi, Hwang, Butz, Knowles, Solter and Kewler1996). Cell-to-cell adhesion is critical for maintaining the functions of embryonic epithelial tissue. The E-cadherin null mutant embryo fails to form a TE (Larue et al., Reference Larue, Ohsugi, Hirchenhain and Kemler1994). The outer blastomeres differentiate into the epithelial cell type in embryos from the 16-cell to 32-cell stages, and then begin to accumulate embryonic fluid to form the blastocoel (Collins & Fleming, Reference Collins and Fleming1995; Yamanaka et al., Reference Yamanaka, Ralston, Stephenson and Rossant2006; Eckert & Fleming, Reference Eckert and Fleming2008). The embryo that is filled with blastocoelic fluid is called a blastocyst, providing a unique environment for ICM. Thus, ICM cells are completely isolated from the extraembryonic environment.
The complexes of the intercellular adhesion structure are universally present in vertebrate epithelial cells. The apical membrane domain consists of morphologically different adhesion structures that include the tight junction (TJ), adherens junction (AJ), gap junction and desmosome. The belt-like TJ sealing the intercellular space between adjacent cells prevents the diffusion of water and solutes via the intercellular space (Tsukita et al., Reference Tsukita, Furuse and Itoh2001; Van Itallie & Anderson, Reference Van Itallie and Anderson2006). The barrier function of the TJ varies widely, depending on the physiological functions of each organ. The TJ is permeable through the paracellular pathway where small molecules such as ions, water and sugars pass into the intercellular space, but the TJ works as an extremely strong barrier to macromolecules such as proteins. The TJ transports such small molecules only passively, and its permeability against each molecule also varies widely in each organ. The TJ is a multi-protein complex, which is composed of transmembrane proteins such as occludin, claudin, tricellulin and so on, and cytosolic scaffold proteins that link membrane proteins to the actin cytoskeleton as zonula occludens 1 (ZO-1), ZO-2, ZO-3 and cingulin (Furuse et al., Reference Furuse, Hirase, Itoh, Nagafuchi, Yonemura, Tsukita and Tsukita1993; Itoh et al., Reference Itoh, Nagafuchi, Yonemura, Kitani-Yasuda, Tsukita and Tsukita1993; Bazzoni et al., Reference Bazzoni, Martinez-Estrada, Orsenigo, Cordenonsi, Citi and Dejana2000; Angelow et al., Reference Angelow, Ahlstrom and Yu2008). ZO-1, which was first detected as a TJ protein, is the peripheral membrane protein with a molecular mass of 220 kDa (Stevenson et al., Reference Stevenson, Siliciano, Mooseker and Goodenough1986). ZO-1 has two isoforms, ZO-1α− and ZO-1α+. ZO-1α+ has an extra domain composed of 80 amino acids (α-domain, Willott et al., Reference Willott, Balda, Heintzelman, Jameson and Anderson1992). ZO-1- or ZO-2-deficient mice (Katsuno et al., Reference Katsuno, Umeda, Matsui, Hata, Tamura, Itoh, Takeuchi, Fujimori, Nabeshima, Noda, Tsukita and Tsukita2008; Xu et al., Reference Xu, Kausalya, Phua, Ali, Hossain and Hunziker2008) fail to develop after implantation.
Occludin is a four transmembrane protein of molecular mass about 60 kDa; the N-terminal half of occludin contains two extracellular loops composed of 44 and 45 amino acids, and intracellular C- and N-terminal domains. The C-terminus binds to ZO-1, -2 and -3 (Furuse et al., Reference Furuse, Hirase, Itoh, Nagafuchi, Yonemura, Tsukita and Tsukita1993; Tsukita et al., Reference Tsukita, Furuse and Itoh2001; Feldman et al., Reference Feldman, Mullin and Ryan2005). Occludin-deficient newborn mice are morphologically normal, but show remarkable growth retardation, and histological abnormalities in gastric epithelium, salivary gland, brain, testis and bone (Saitou et al., Reference Saitou, Furuse, Sasaki, Schulzke, Fromm, Takano, Noda and Tsukita2000). Furthermore, mutation of the genes encoding TJ proteins is involved in several human hereditary diseases (Moriwaki et al., Reference Moriwaki, Tsukita and Furuse2007).
It has been shown that the TJ is built gradually following compaction in mouse preimplantation development. First, ZO-1α− and rab13 are assembled in the boundary region among cells at the 8-cell stage, then occludin and ZO-1α+ are assembled during the 32-cell stage (Sheth et al., Reference Sheth, Fesenko, Collins, Moran, Wild, Anderson and Fleming1997, Reference Sheth, Fontaine, Ponza, McCallum, Page, Citi, Louvard, Zahraoui and Fleming2000a,b). ZO-1α+ and occludin co-localize in the cytoplasm before their membranous assembly, and both proteins are assembled together at the membrane (Sheth et al., Reference Sheth, Fesenko, Collins, Moran, Wild, Anderson and Fleming1997, Reference Sheth, Moran, Anderson and Fleming2000b). Most of the mRNAs of TJ-related proteins are initially inherited as maternal transcriptional products, and are present throughout preimplantation development, whereas in mouse, ZO-1α+ is transcribed only from the embryonic genome as the embryonic transcript (Sheth et al., Reference Sheth, Fesenko, Collins, Moran, Wild, Anderson and Fleming1997). Membrane assembly of these TJ-related proteins is enabled by intercellular adhesion of the E-cadherin complex assembly. For example, loss of E-cadherin function in the mouse morula leads to lack of membrane assembly of occludin (Sheth et al., Reference Sheth, Moran, Anderson and Fleming2000b). ZO-1 knockdown by siRNA inhibits blastocoel formation (Sheth et al., Reference Sheth, Nowak, Anderson, Kwong, Papenbrock and Fleming2008; Wang et al., Reference Wang, Ding, Brown, Yamamoto, Prince, Reese and Paria2008), and lack of ZO-2 in TE TJs causes delayed formation of the blastocoel cavity, but does not inhibit normal cell proliferation and outgrowth morphogenesis in mouse embryos (Sheth et al., Reference Sheth, Nowak, Anderson, Kwong, Papenbrock and Fleming2008). The incidence of compaction is lower in in vitro-produced bovine embryos than in in vivo ones (Holm et al., Reference Holm, Booth and Callesen2002). As the incidence of polyspermic fertilization is very high in in vitro fertilization in pigs, it is difficult to obtain constantly fertilized diploid eggs. Conversely, matured pig oocytes can easily be activated by electro-stimulation (El-St), and the great majority of them quickly resume the second meiotic cell division. Diploid pig embryos that are produced by the treatment of cytochalasin B just after El-St show high developmental competence to the blastocyst stage. Their developmental patterns, such as the developmental rate, timing of compaction and number of cells in the blastocyst, are quite similar to in vivo development, at least up to the blastocyst stage (Kure-bayashi et al., Reference Kure-bayashi, Miyake, Katayama, Miyano and Kato1995, Reference Kure-bayashi, Miyake, Katayama, Miyano and Kato1996; Thuan et al., Reference Thuan, Harayama and Miyake2002, Reference Thuan, Kure-bayashi, Harayama, Nagai and Miyake2003).
There are few reports concerned with the TJ in the pig preimplantation embryos. This study was designed to clarify the expression of ZO-1 and occludin, at mRNA and protein levels during preimplantation development using parthenogenetic diploids in pigs.
Materials and methods
This study was approved by the Institutional Animal Care and Use Committee (Permission number: 19–5-31 and 22–05–13) and carried out according to the Kobe University Animal Experimentation Regulations.
Oocyte collection and in vitro maturation
Pig ovaries were collected from prepubertal gilts at local abattoirs and were transported to the laboratory within 2 h. Ovaries were rinsed once in 0.2% (w/v) cetylmethylammonium bromide (Wako Pure Chemical Industry, Ltd) for sterilization and washed three times in Ca2+- and Mg2+-free Dulbecco's PBS containing 0.1% (w/v) polyvinyl alcohol (PBS–PVA, Sigma Chemical Co.). Preparation of oocyte–cumulus–granulosa cell complexes (OCGCs) and maturation culture was based on the method of Kure-bayashi et al. (Reference Kure-bayashi, Miyake, Okada and Kato2000) and Thuan et al. (Reference Thuan, Harayama and Miyake2002). In brief, follicles 4–6 mm in diameter were dissected from ovaries with two disposable scalpels in PBS–PVA. OCGCs were isolated from the follicles in TCM-199 medium (Earl's salt; Nissui Pharmaceutical Co., Ltd) supplemented with 25.0 mM 2-[4-(2-hydroxyethyl)-1-piperazinyl]ethanesulfonic acid (HEPES; Dojindo Lab. Co. Ltd) and 0.1% (w/v) polyvinyl alcohol (HEPES-199). OCGCs were then washed twice with fresh HEPES-199, followed by washing twice with maturation medium. The OCGCs were cultured in 2.0 ml of maturation medium, along with two reversed healthy theca shells that had the granulosa cells removed in a CO2 incubator at 38.5°C under humidified air containing 5% CO2 with gentle agitation for 42 to 46 h. The maturation medium was bicarbonate-buffered TCM-199 containing 10% (v/v) heat-treated fetal calf serum (FCS; Biocell Inc.), 0.1 mg/ml sodium pyruvate, 0.08 mg/ml kanamycin sulfate, 2.2 mg/ml sodium bicarbonate, and 0.1 IU/ml human menopausal gonadotropin (hMG; Pergonal; Teikoku Zoki).
Electro-stimulation (El-St) and embryo culture
After maturation culture, oocytes were denuded in 100 μl drops of porcine zygote medium 3 (PZM-3) (Yoshioka et al., Reference Yoshioka, Suzuki, Tanaka, Anas and Iwamura2002), which was covered with paraffin oil (analytical grade for analysis of amino acids; Nacalai Tesque, Inc.). Extrusion of the first polar body was inspected under an inverted microscope for evaluation of oocyte maturation. Oocytes with a distinct first polar body were washed four times in an electric field solution composed of 0.3 mM mannitol, 0.1 mM MgSO4, and 0.05 mM CaCl2 supplemented with 0.01% (w/v) PVA. The oocytes were transferred to 100 μl of the fresh field solution between two parallel stainless electrodes in a chamber (FTC-03; Shimadzu Co. Ltd) and a single squared direct-current pulse of 1500 V/cm for 100 μs was supplied from an electro cell manipulator (ECM 2000, BTX Inc.; or OFC-2001, Riko Chemical Co.). Electro-stimulated oocytes were cultured in PZM-3 supplemented with 5 μg/ml cytochalasin B (CB; Sigma-Aldrich) for 4 h, to produce parthenogenetic diploids (Kure-bayashi et al., Reference Kure-bayashi, Miyake, Katayama, Miyano and Kato1996). Presumptive diploids were then cultured in PZM-3 for up to 168 h after El-St in a CO2 incubator.
LLC-PK1 cell culture
Porcine kidney epithelial cell line LLC-PK1 cells (Dainippon Sumitomo Pharmaceutical Co. Ltd) were used as the positive control for the detection of ZO-1α−, ZO-1α+ and occludin in the pig embryos. The cells were plated on a plastic dish (Falcon #3002, Becton Dickinson Labware) and cultured in bicarbonate-buffered TCM-199 containing 5% (v/v) FCS, 0.1 mg/ml sodium pyruvate, and 2 mM glutamine (Sigma-Aldrich) at 38.5°C in a CO2 incubator.
Real-time reverse transcriptase-polymerase chain reaction (real-time RT-PCR)
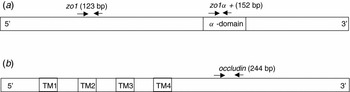
The total expression of the ZO-1α− and ZO-1α+ mRNA was detected using the primer set that was specific for both zo1α − and zo1α + to the N-terminal sequence, and zo1α + was detected using the primer set that was specific for the sequence of α-domain (Fig. 1a). The expression of occludin mRNA was detected by real-time RT-PCR using the primer set for the C-terminal cytoplasmic site of occludin (Fig. 1b).
Schematic diagram of zo1 (a) and occludin (b) gene structure and position of primer sites. (a) zo1 and zo1α + are primer sites that are specific for zo1 and for zo1α +, respectively. (b) Occludin primer set was designed in the C-terminal of the occludin sequence. TMs; transmembrane domains.

Total RNAs were extracted from 30 fresh oocytes at the germinal vesicle (GV) and metaphase (M)II stages and embryos at the 2-cell, early 4-cell, late 4-cell, morula, blastocyst and expanded blastocyst stages that were cultured for 24 h, 48 h, 72 h, 96 h, 120 h and 144 h after El-St using an Absolutely RNA Microprep Kit (Stratagene). Single-stranded cDNA were generated from the RNAs with RETRO script (Ambion) according to the manufacturer's instruction, and were used as templates for RT-PCR. The reactions were conducted according to the protocol of the SYBR Premix Ex TaqTM II (Perfect Real Time; Takara Bio Inc.), 12.5 μM of each primer (Table 1), and cDNA of 0.2 embryo equivalents in a final volume of 20 μl. PCR was performed using the Mastercycler EP Realplex System (Eppendorf Japan) in the following conditions: 95°C for 10 s, 1 cycle; 95°C for 5 s, 55°C for 20 s, 72°C for 15 s, 45 cycles; 95°C for 15 s, 60°C for 15 s, 95°C for 15 s, 1 cycle. The PCR products were analyzed by a melting curve and 1% (w/v) agarose gel electrophoresis. The relative quantification of gene expression was analyzed by the 2-ΔΔCt methods. GAPDH was used as an internal standard (Kuijk et al., Reference Kuijk, du Puy, van Tol, Haagsman, Colenbrander and Roelen2007).
Primer list for real-time RT-PCR

SDS-PAGE and western blotting
The embryos that had been cultured for 24 h, 48 h, 96 h, or 144 h after El-St were boiled for 5 min in concentrated SDS sample buffer, and stored at −20°C until use. Samples were run using 7.5% or 12.5% SDS-polyacrylamide gel electrophoresis (SDS-PAGE) and the proteins were transferred to hydrophobic polyvinylidene difluoride membranes (Immobilon; Millipore Co.). The membranes were blocked with 10% FCS in PBS containing 0.1% Tween-20 (PBST) for 1 h, and incubated overnight at 4°C with primary antibodies: rabbit anti-ZO-1 polyclonal antibody (1:250), rabbit anti-occludin polyclonal antibody (1:1000) or mouse anti-β actin (1:10,000; Sigma-Aldrich) monoclonal antibody, in PBST containing 10% FCS. After washing three times in PBST, the membranes were treated with horseradish peroxidase-conjugated anti-rabbit or anti-mouse IgG (1:1000, Pierce Biotechnology, Inc.). After washing in PBST, peroxidase activity was visualized using the Super Signal detection system (Pierce Biotechnology).
LLC-PK1 cells were washed twice with PBS–PVA after culture, and were released from the dish by treating with 0.25% trypsin–EDTA solution (Sigma-Aldrich). They were washed in PBS–PVA once and three times in PBS–PVA by centrifugation at 100 g for 2 min, and were subjected to the preparation processes for western blotting.
Immunofluorescence staining
Embryos were immersed in acid Tyrode's solution (137 mM NaCl, 2.7 mM KCl, 1.4 mM CaCl2·2H2O, 0.5 mM MgCl2·6H2O, 5.6 mM d-glucose and 0.1% polyvinylalcohol at pH 2.5, adjusted with HCl) to dissolve the zona pellucida, then fixed in 2% (w/v) paraformaldehyde in PBS–PVA for 25 min at room temperature. After treatment with 0.2% (v/v) Triton X-100 for 5 min, the embryos were blocked in PBS–PVA with 10% (v/v) goat serum for at least 2 h at room temperature or overnight at 4°C. Embryos were incubated with primary antibodies in PBS–PVA with 1% BSA (PBS–BSA) overnight at 4°C. After washing three times in PBS–BSA, the embryos were incubated with Alexa Fluorochrome labelled secondary antibody in PBS–BSA for 1 h at room temperature. After washing, the embryos were counterstained with 2 μg/ml Hoechst 33342 to stain the nuclei, and were observed under an epifluorescence microscope (BX51-3-4-FLD-1, Olympus Optical Co. Ltd) after whole mounting. As the negative control, a group of embryos were treated with only secondary antibody and subjected to nuclear staining. Primary antibodies included rabbit anti-ZO-1 polyclonal antibody (1:100, Zymed Laboratories) and rabbit anti-occludin polyclonal antibody (1:100, Zymed). The secondary antibody was Alexa fluor 488 anti-rabbit antibody (1:200, Invitrogen Co.)
Statistical analysis
The expression levels of mRNAs were measured at least three times in the embryos at each developmental stage, and values were analyzed by t-test. p-values less than 0.05 were considered statistically significant.
Results
Expression of ZO-1 and occludin mRNA in pig parthenogenetic diploids during preimplantation development
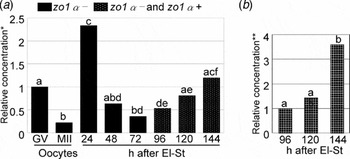
zo1α − was detected in all the oocytes and embryos examined (Fig. 2a). Conversely, zo1α + was detected only in embryos at the morula and blastocyst stages later than 96 h after El-St (Fig. 2b). Therefore, GV and MII oocytes and embryos at the earlier stages before the compaction at 72 h expressed zo1α − only, and embryos from the morula later than 96 h after El-St had transcribed both zo1α − and zo1α + mRNAs. The expression level of zo1α − was significantly lower in MII oocytes than in the GV, showing rapid decrease during oocyte maturation, and was significantly increased in 2-cell embryos 24 h after El-St (p < 0.05, Fig. 2a). Then the expression level of zo1α − decreased until late 4-cell stage embryos 72 h after El-St (Fig. 2a). Expression of zo1α + was detected from the morula stage, and gradually increased upto the expanding blastocyst stage 144 h after El-St (p < 0.05; compared with the morula value, Fig. 2b). Thus, the total amount of zo1 (zo1α − and zo1α +) expression was constantly increased from the morula up to the expanding blastocyst stages (p < 0.05, Fig. 2a).
Relative expression levels of ZO-1 mRNA in germinal vesicle (GV) and metaphase (M)II oocytes and the parthenogenetic diploids during preimplantation development in pigs. Diploids were cultured up to 144 h after electro-stimulation (El-St) and collected every 24 h. (a) The relative concentration of both zo1α − and zo1α + was analyzed by real-time PCR using a primer set that was specific for both zo1α − and zo1α +. (b) The relative concentration of zo1α + was analyzed with the zo1α +-specific primer set. Embryos at 2-cell, early 4-cell, late 4-cell, morula, early blastocyst and expanded blastocyst stages were analyzed at 24, 48, 72, 96, 120 and 144 h after El-St, respectively. Values between columns with different letters were significantly different (p < 0.05). *Relative concentration is shown by the rate to the amount of ZO-1 mRNA in the GV oocyte. **Relative concentration is shown by the rate to the amount of ZO-1α+ mRNA in the morula.

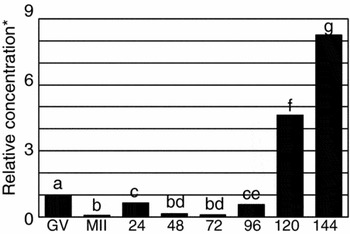
Occludin expression was also confirmed in GV and MII oocytes and embryos at all the preimplantation stages up to the blastocyst (Fig. 3). Occludin expression greatly decreased in the MII oocyte (p < 0.05). In the 2-cell embryo, occludin expression slightly increased after activation, and decreased again up to the late 4-cell stage (p < 0.05). Thus, the increase of occludin transcription was not so high compared with that of zo1 after activation. Although the changing pattern of the relative expression of occludin that was standardized by the concentration of the GV oocyte was fundamentally similar to that of total zo1, occludin did not show a prominent increase at the 2-cell stage. Conversely, the increase of occludin was much higher in the blastocyst stage later than 120 h after El-St.
Relative expression levels of occludin mRNA in germinal vesicle (GV) and metaphase (M)II oocytes and parthenogenetic diploids during preimplantation development in pigs. Diploids were cultured up to 144 h after El-St and collected every 24 h. The relative concentration of occludin mRNA, which was analyzed by real-time PCR. Embryos at 2-cell, early 4-cell, late 4-cell, morula, early blastocyst and expanded blastocyst stages were analyzed at 24, 48, 72, 96, 120 and 144 h after El-St, respectively. Values between columns with different letters were significantly different (p < 0.05). *Relative concentration is shown by the rate to the amount of occludin mRNA in the GV oocyte.

SDS-PAGE western blotting analysis of ZO-1 and occludin in pig parthenogenetic diploids during preimplantation development
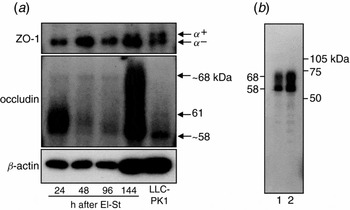
The ZO-1α− and occludin specific bands were detected in all embryos during preimplantation development and LLC-PK1 cells (Fig. 4a). The amount of ZO-1α− increased from the 2-cell to the 4-cell stage, slightly decreased in the morula, and increased again at the blastocyst stage. Conversely, a ZO-1α+ band was detected only in blastocysts. Both ZO-1α− and ZO-1α+ were evenly expressed in the positive control, LLC-PK1 cells. Conversely, the amount of ZO-1α+ was lower than that of ZO-1α− in the blastocyst.
Western blotting analysis of ZO-1 and occludin in preimplantation parthenogenetic diploids in the pig. (a) Embryos at indicated stage (30 embryos/lane) and LLC-PK1 (1400 cells/lane) were analyzed with rabbit anti-ZO-1 polyclonal antibody (1:250), rabbit anti-occludin polyclonal antibody (1:1000), anti-β-actin antibody (1:10,000) after SDS-7.5% polyacrylamide gel electrophoresis. Embryos at 2-cell, early 4-cell, morula, and expanded blastocyst stages were analyzed at 24, 48, 96, and 144 h after El-St, respectively. (b) 10 (lane 1) and 15 (lane 2) blastocysts at 144 h after El-St were re-analyzed with anti-occludin, after SDS-12.5% polyacrylamide gel electrophoresis.

Western blotting analysis of occludin using 7.5% polyacrylamide gel for electrophoresis showed a weak occludin-specific band around 68 kDa in embryos at the 2-cell, early 4-cell and morula stages. Conversely, a continuous very dark smear from 58 kDa to 68 kDa was detected in the blastocyst. Two dark smear-like bands between 58 kDa and approximately 61 kDa were detected in 2-cell embryos and decreased in 4-cell embryos. The size of the band slightly decreased from 61 kDa and the total amount of the smear-like band became pale in the morula. In contrast, the LLC-PK1 cells had a strong band at 58 kDa and two weak bands at 59 kDa and 61 kDa (Fig. 4a). As 30 blastocysts per lane were loaded on 7.5% polyacrylamide gel electrophoresis and widely spread smear was obtained after western blotting analysis of occludin (Fig. 4a), the number of blastocysts was decreased to 10 or 15 and the occludin expression was examined by western blotting analysis after 12.5% polyacrylamide gel electrophoresis. Two clear bands at 68 kDa and 58 kDa, with a widely spread smear between 58 and 68 kDa were detected (Fig. 4b). Thus, the expression pattern of occludin in the blastocyst was considerably different from that of LLC-PK1 cells (Fig. 4a).
Localization of ZO-1 and occludin in pig parthenogenetic diploids during preimplantation development, by immunofluorescence
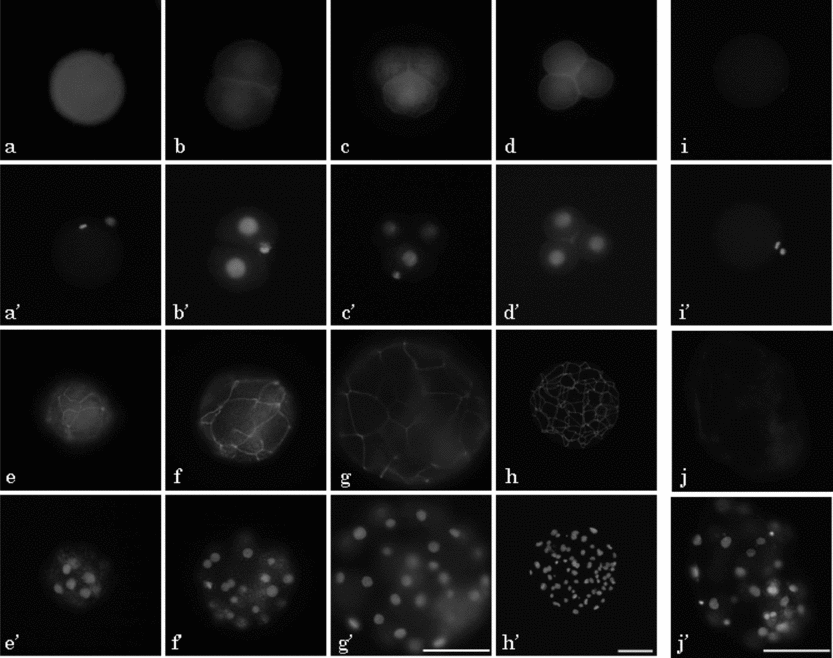
Typical localization of ZO-1 proteins in the pig oocyte and preimplantation embryos was detected by immunofluorescence using rabbit anti-ZO-1 polyclonal antibody, which recognized both ZO-1α− and ZO-1α+ (Fig. 5). ZO-1-specific fluorescence was observed in the MII oocyte and parthenogenetic embryos from the 2-cell stage, 24 h after activation as far as the expanded blastocyst stage at 168 h (Fig. 5a–h). ZO-1 showed homogeneous localization in the cytoplasm of the MII oocyte (Fig. 5a), and rather strong localization at the cell-to-cell boundary region in addition to the weak cytoplasmic localization in the embryos from 2-cell to late 4-cell stages (Fig. 5b–d). ZO-1 showed strong belt-like localization in morulae (Fig. 5e), and this belt-like localization became stronger towards the early blastocyst stage; the network structure of the TJ was clearly observed in the embryos at the early and expanded blastocyst stages (Fig. 5f–h). Faint fluorescence was observed on the cytoplasm of MII oocytes and blastocysts that was exposed only to the secondary antibody without treatment with the first antibody (Fig. 5i,j).
Localization of ZO-1 in parthenogenetic diploids during preimplantation development in pigs. Oocyte at metaphase (M)II stage (a, i) and embryos at 2-cell (b), early 4-cell (c), late 4-cell (d), morula (e), early blastocyst (f, j), expanded blastocyst (g) and hatched blastocyst (h) stages were observed at 24, 48, 72, 96, 120, 144 and 168 h after El-St, respectively. All eggs were subjected to immunostaining with (a–h) or without anti-ZO-1 antibody (i, j; negative control) followed by anti-rabbit IgG labelled with Alexa fluor 488 (a–j) and Hoechst 33342 (a′–j′). Pictures in (a–g, i, j) are shown at the same magnification. Scale bar = 100 μm.
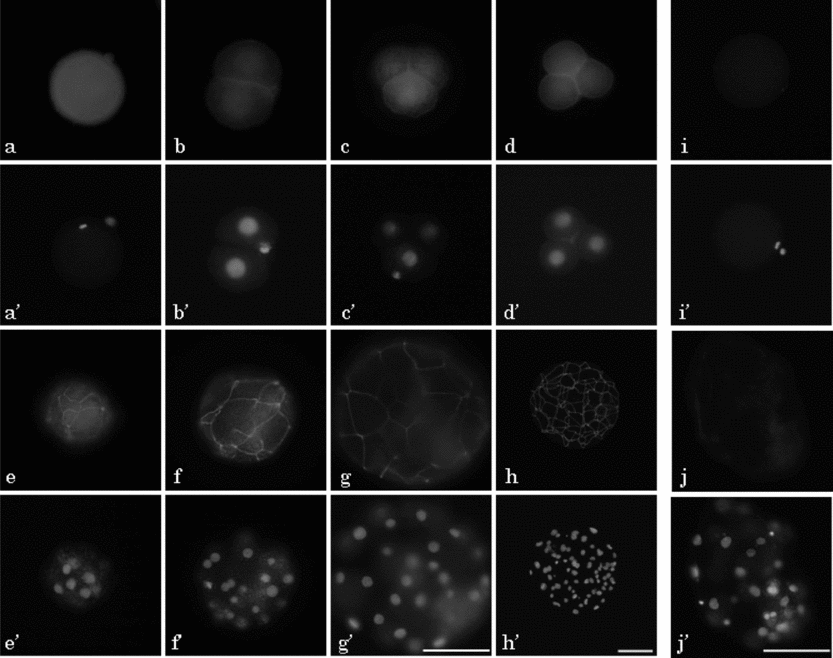
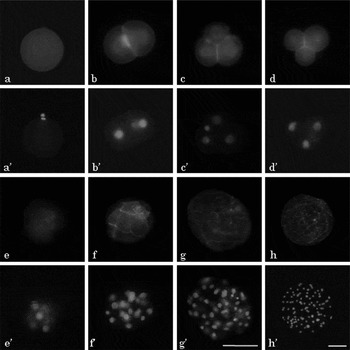
Figure 6 shows the localization of occludin in pig parthenogenetic diploids during preimplantation development detected by immunofluorescence staining with anti-occludin polyclonal anti body. The occludin-specific fluorescence was observed on the MII oocyte and on all embryos during preimplantation developmental stages, from the 2-cell stage to the expanded blastocyst. The localization and expression pattern of the occludin was fundamentally similar to that of ZO-1. The occludin-specific signal was clearer and stronger than the ZO-1-specific signal at the boundary region in the embryos from the 2-cell to the late 4-cell stage (Fig. 6b–d). The occludin-specific belt-like fluorescence in the cell-to-cell boundary region, however, was lower and fainter than that of ZO-1-specific signal in morula embryos (Fig. 6e). The occludin-specific network structure, which reflected the localization of TJ structure, was also clearly observed in the embryos later than the early blastocyst stage 120 h after activation, similar to that for ZO-1 (Fig. 6f–h).
Localization of occludin in parthenogenetic diploids during preimplantation development in pigs. An oocyte at the metaphase (M)II stage (a); and embryos at 2-cell (b); early 4-cell (c); late 4-cell (d); morula (e); early blastocyst (f); expanded blastocyst (g); and hatched blastocyst (h) stages were observed at 24, 48, 72, 96, 120, 144 and 168 h after El-St, respectively. All eggs were stained with anti-occludin antibody and anti-rabbit IgG labelled with Alexa fluor 488 (a–h) and Hoechst 33342 (a′–h′). Pictures in (a–g) are shown at the same magnification. Scale bar = 100 μm.

Discussion
In the present study, the expression of ZO-1 and occludin was examined at mRNA and protein levels in preimplantation parthenogenetic diploids in pigs. It was shown that GV and MII oocytes and embryos at all the preimplantation stages expressed mRNAs and proteins of ZO-1 and occludin.
The expression patterns of ZO-1 and occludin mRNAs are almost similar during oocyte maturation. Real-time RT-PCR analysis showed that both mRNA levels clearly decreased from GV to MII, and increased at the 2-cell stage with temporal decrease during the early and late 4-cell stages. Then, both mRNAs clearly increased after compaction.
The expression of zo1α − increased in 2-cell embryos, and the relative concentration was more than twice that of GV oocytes and highest throughout preimplantation development. The expression of zo1α − decreased rapidly until the late 4-cell stage, and then the concentration constantly increased from the morula stage. Real-time RT-PCR revealed that zo1α + was expressed only after the morula stage. Therefore, it is clear that GV and MII oocytes and embryos until the late 4-cell stage expressed only zo1α − and the increase of zo1 reflected the up-regulation of zo1α + transcription in the embryos later than the morula stage. It was reported that the mRNA of some genes, which may have important roles during early cleaving stages, was up-regulated at the 2-cell stage in pig parthenogenetic embryos (Hwang et al., Reference Hwang, Lee, Cui, Kim and Kim2005; Magnani & Cabot, Reference Magnani and Cabot2008). As the expression of zo1α − was rather limited in the early cleaving stages, zo1α − was translated as maternal gene expression and might have functional roles in early cleaving embryos. When considering the limited expression of zo1α + mRNA after the morula stage, zo1α + was transcribed by the zygotic gene activation and translated from the early blastocyst stage, suggesting that zo1α + has an important role only in the formation and retention of the TJ structure and function in the TE.
Occludin mRNA also rapidly decreased during maturation as did zo1, and relative concentration was also increased by activation and the level in the 2-cell embryo was almost half that of the GV oocyte. The expression level was again very low in the early and late 4-cell embryos, and occludin increased again from the morula stage and remarkably increased in expanded blastocysts, more than eight times the relative expression in the GV. Therefore, the relative concentration of occludin is highest in the expanded blastocyst 144 h after activation, suggesting that the increase was important for the TJ formation in the blastocyst coinciding with the increase of zo1α +.
It is reported that zo1, zo1α + and occludin mRNAs are expressed in the GV and in in vitro matured MII oocytes, and 8-cell to blastocyst embryos (2-cell and 4-cell embryos were not examined) in cattle (Miller et al., Reference Miller, Eckert, Lazzari, Duranthon-Richoux, Sreenan, Morris, Galli, Renard and Fleming2003). zo1α + expression was detected at the cleavage stages before compaction. Thus, the expression patterns of zo1 in cattle embryos were different from those found in pig embryos. Although the function of the temporal decrease of zo1 and occludin in the MII oocyte and their temporal increase at the 2-cell stage is unknown, the changes of their expression levels might have transient roles during the early cleaving stages and/or formation of the blastocyst, and thereafter during preimplantation development. In pigs, embryonic genes begin to be transcribed beyond the late 4-cell stage, and then these mRNAs are translated to the proteins for blastocyst formation. Therefore, it is speculated that ZO-1 and occludin might have quite different roles at maternal and embryonic gene expression during preimplantation development.
It has been reported that ZO-1α− and occludin mRNAs are expressed in in vitro cultured mouse embryos at all stages during preimplantation development, and zo1α + is expressed from the late morula (32 cells) (Sheth et al., Reference Sheth, Fesenko, Collins, Moran, Wild, Anderson and Fleming1997). Human embryos showed a similar expression pattern for these mRNA to that of mouse embryos (Ghassemifar et al., Reference Ghassemifar, Eckert, Houghton, Picton, Leese and Fleming2003). Thus, the expression patterns of zo1 and occludin are fundamentally common among mouse, human and pig, suggesting that these two proteins have a similar role in compaction and beyond, during preimplantation embryonic development.
Western blotting analysis of the embryos from the 2-cell to blastocyst stages revealed that ZO-1α− was expressed in the embryos at all the preimplantation developmental stages. Conversely, ZO-1α+ was translated from the blastocyst stage in pigs. These results support the results of real-time RT-PCR analysis of zo1 that showed expression of zo1α + starting from the morula stage, while zo1α − was expressed in all embryos during preimplantation development. Thus the expression pattern of ZO-1 protein reflected the expression pattern of zo1 mRNA in pig embryos. It is considered that protein expression increased temporally at the 4-cell stage, which probably resulted from the temporal increase of zo1 in the 2-cell embryo, and decreased at the morula stage, which may have resulted from the decrease of zo1 during the early and late 4-cell stages.
The expression level of occludin also reflected the level of occludin mRNA. As the occludin expression was much higher in 2-cell embryos than 4-cell ones, it can be considered that the occludin was quickly translated from maternal occludin compared with zo1. Occludin showed a tendency to form smears between approximately 58 to 68 kDa, but not clear bands in western blotting analysis. The smear-like distribution of occludin is also reported in somatic cells (Hirase et al., Reference Hirase, Staddon, Saitou, Ando-Akatsuka, Itoh, Furuse, Fujimoto, Tsukita and Rubin1997). It has been reported that occludin was detected as four clear bands at 58, 62, 65–67 and about 72–75 kDa by western blotting analysis in mouse embryos (Sheth et al., Reference Sheth, Moran, Anderson and Fleming2000b). It was also reported that the bands at 58 and about 72–75 kDa were detected from the early cleaving embryos to the early blastocyst, and both bands became very weak in the late blastocyst stage. The band at 65–67 kDa, which increased in the embryos later than compaction, was always expressed from early cleaving embryos to the late blastocyst. Conversely, the expression of a 62 kDa band showed limited expression only in late mouse blastocysts (Sheth et al., Reference Sheth, Moran, Anderson and Fleming2000b). In the pig parthenogenetic diploids, however, only two main bands at 58 kDa and 68 kDa were detected by western blotting analysis using a 12.5% gel with several migrating bands between them. These findings suggest that the occludin expression pattern is species specific in the preimplantation embryos. It has been reported that occludin shows multiple bands with widely ranged molecular weights due to different levels of phosphorylation in different cell types (Feldman et al., Reference Feldman, Mullin and Ryan2005). Therefore, these differences may suggest different levels of phosphorylation.
The strong band around 58–61 kDa in 2-cell embryos slightly shifted up and became weak in 4-cell embryos. The weak band reappeared at 58 kDa with smears between 58 and 61 kDa in the morula. It has been reported that dephosphorylation of occludin occurs during blastocyst formation in the mouse (Sheth et al., Reference Sheth, Moran, Anderson and Fleming2000b) and Xenopus (Cordenonsi et al., Reference Cordenonsi, Mazzon, De Rigo, Baraldo, Meggio and Citi1997). This result also supports the hypothesis that the levels of phosphorylation are stage-dependently different in pig parthenogenetic embryos. In the present study, the weak band at around 68 kDa was always detected from the 2-cell to blastocyst stages. This band may be embryo-specific, highly phosphorylated occludin. An alternative possibility is occludin 1B. Occludin 1B, which contains a 193-bp insertion with a unique N-terminal sequence of 56 amino acids, was identified in canine, human and mouse somatic cells (Muresan et al., Reference Muresan, Paul and Goodenough2000). The estimated molecular weight of occludin 1B is about 70 kDa, and is co-localized with occludin. Unfortunately, there is no information available about occludin 1B in mammalian embryos.
Indirect immunofluorescence analysis of ZO-1 and occludin revealed that ZO-1 and occludin have a rather homogeneous distribution in the cytoplasm, with moderately strong fluorescence in the vicinity of the contact region between blastomeres and around the nucleus in the 2-cell to the late 4-cell embryos, and that both ZO-1 and occludin showed clear network localization along the cell-boundary region in the embryos after the morula stage. Western blotting analysis also demonstrated the expression of ZO-1 and occludin in the embryos at all stages of preimplantation development. Thus, ZO-1 and occludin are co-expressed in the pig preimplantation embryos, as found for other epithelial somatic cells.
Although only ZO-1α− was detected in the 2-cell and as far as the morula stage embryos, ZO-1α+ was expressed along with ZO-1α− in the blastocyst. Pig kidney epithelial LLC-PK1 cells expressed both ZO-1α− and ZO-1α+, and the amount of ZO-1α+ expression was approximately equal to that of ZO-1α−. Conversely, the ZO-1α+/ZO-1α− ratio was considerably smaller in blastocysts than in LLC-PK1. As it has been reported that ZO-1α+ could be used as a reliable marker of epithelial differentiation (Komiya et al., Reference Komiya, Shimizu, Ikenouchi, Yonemura, Matsui, Fukunaga, Liu, Endo, Tsukita and Nagafuchi2005), these results may suggest different functions of the TE from somatic epithelial cells.
It is reported that ZO-1α− first assembled in the boundary region at the 8-cell stage, followed by occludin and ZO-1α+ assembly after compaction during the 32-cell stage in mice (Fleming et al., Reference Fleming, McConnell, Johnson and Stevenson1989; Sheth et al., Reference Sheth, Fesenko, Collins, Moran, Wild, Anderson and Fleming1997, Reference Sheth, Moran, Anderson and Fleming2000b). In human preimplantation embryos, first ZO-1α− localizes in the boundary region before compaction, and then ZO-1α+ is assembled there after the morula stage (Ghassemifar et al., Reference Ghassemifar, Eckert, Houghton, Picton, Leese and Fleming2003). In bovine, ZO-1α− first appears in the outer cells of the morula and forms the network structure at the intercellular site at the blastocyst stage, as in mouse embryos (Barcroft et al., Reference Barcroft, Hay-Schmidt, Caveney, Gilfoyle, Overstrom, Hyttel and Watson1998). Present results show that ZO-1α− was expressed in MII oocytes and parthenogenetic diploids at all preimplantation stages, and that its expression pattern was different from that of mouse, human and bovine embryos, while the expression pattern of ZO-1α+ after compaction was quite similar to the mouse, human and bovine embryos. The common expression of ZO-α+ in mammalian species suggests an important role for ZO-1α+ in the completion and retention of the TE structure.
Immunofluorescence staining of occludin revealed that its expression pattern in the pig oocyte and parthenogenetic embryos during preimplantation development was different from that of mice. In mice, occludin assembled to the plasma membrane at the late morula stage (Sheth et al., Reference Sheth, Moran, Anderson and Fleming2000b). Conversely, our present study shows that, in pig, even MII oocytes homogeneously expressed occludin in the cytoplasm, and that the integration of occludin signals was observed on the boundary regions of blastomeres with weak cytoplasmic expression in embryos at all preimplantation stages; the peri-nuclear distribution at the 4-cell stage was similar to that of ZO-1. In vitro fertilized bovine embryos at the early cleaving stages were subjected to immunofluorescence analysis of occludin. The 2-cell and 4-cell stage embryos also showed the integration of occludin at the boundary region of the blastomeres (data not shown). Therefore, the integration of occludin around the plasma membrane at the cell boundary region in the early cleaving embryos is common in pigs and bovines, both in in vitro fertilized and parthenogenetic embryos. In the human blastocyst, occludin appeared in the cell-to-cell contact regions and formed a highly concentrated ring-like structure at the periphery of the nucleus (Ghassemifar et al., Reference Ghassemifar, Eckert, Houghton, Picton, Leese and Fleming2003; Eckert et al., Reference Eckert, Houghton, Hawkhead, Balen, Leese, Picton, Cameron and Fleming2007). The ring-like structure of occludin localization around the nucleus, however, was never observed in the pig blastocyst in our study.
It is shown that the major structural proteins of TJ, ZO-1α− and occludin were expressed even in the GV oocytes, and that their localization was rather ectopic from the view of the TJ structure in the embryo at early cleaving stages. It is reported that ZO-1 knockdown by siRNA inhibited blastocoel formation in mice (Sheth et al., Reference Sheth, Nowak, Anderson, Kwong, Papenbrock and Fleming2008; Wang et al., Reference Wang, Ding, Brown, Yamamoto, Prince, Reese and Paria2008), while ZO-1-deficient mice failed in post-implantation development (Katsuno et al., Reference Katsuno, Umeda, Matsui, Hata, Tamura, Itoh, Takeuchi, Fujimori, Nabeshima, Noda, Tsukita and Tsukita2008). Conversely, occludin-deficient newborn mice look morphologically normal, but showed remarkable growth retardation, and histological abnormalities in several tissues (Saitou et al., Reference Saitou, Furuse, Sasaki, Schulzke, Fromm, Takano, Noda and Tsukita2000). Functional roles of the TJ proteins, such as ZO-1α−, ZO-1α+ and occludin, are not yet elucidated sufficiently even in somatic cells, and widely different finding regarding the expression of these mRNA and proteins are reported in cancer cells (Tsukita et al., Reference Tsukita, Yamazaki, Katsuno, Tamura and Tsukita2008; Martin & Jiang, Reference Martin and Jiang2009). Therefore, it is difficult to estimate or speculate the roles of these proteins in preimplantation embryonic development.
In the present study, it is shown that the ZO-1 and occludin mRNAs and proteins are expressed in embryos at all stages of preimplantation development in pig parthenogenetic embryos. The expression was cytoplasmic at first, and assembled to the cell-to-cell contact regions during early cleaving stages. These proteins were finally concentrated at the cell-to-cell boundary regions from the morula stage and showed the clear network localization in the blastocyst stage. TJ-related proteins ZO-1α− and occludin expression patterns in pig preimplantation embryos were slightly different from those of other reported species. Conversely, the expression pattern of ZO-1α+ was similar in all the species studied, suggesting its specific role in the formation and maintenance of TE in mammalian preimplantation development. It was also demonstrated that the expression levels of both mRNAs fluctuated during preimplantation development with two peaks, one at the 2-cell and the other at the blastocyst stage, although the role of the former peak is still unclear.