

Pompeii would seem to be the ideal Roman city to do bottom-up economic history. It is famously a city of houses, and although its elite fabric has garnered more interest, recent work has drawn attention not only to nonelite housing, but also to other aspects of nonelite economic life – retail and artisanal infrastructure, foodways, and broader consumer behavior.Footnote 1 Most of these studies have, by necessity, been qualitative in nature, limited by a strange lacuna in the Pompeiian data themselves: prices. For a town blanketed in graffiti and plastered with political sloganeering, we are poorly informed about how much things cost. Some 64 pieces of price data are preserved from the Vesuvian cities, a seemingly robust dataset that conceals systemic problems.Footnote 2 Most prices are preserved as graffiti, a genre of “everyday writing,” which until recently received little attention and has yet to be fully integrated into Roman economic studies.Footnote 3 For some items – such as the cost of a prostitute – we have multiple references, but for most everyday necessities, we are left either with no data or with data that confuse rather than illuminate.Footnote 4 Prices formed part of the Roman rhetorical apparatus of insult and exaggeration, and therefore much of our seeming price dataset may be intended as satire. Prices also formed part of different systems of value from our own, not necessarily circumscribed by quantity (price per unit) or time (service per period).Footnote 5 The information on “price” in Pompeii is therefore more accurately information about “cost” – the former implying a set value per unit, whereas the latter describes simply the value of an exchange independent of qualifiers. These problems have not gone unnoticed, but they have pushed the few studies that touch on prices onto the more fertile ground of monetary circulation or Roman numeracy.Footnote 6 The absence of a detailed study of Pompeiian prices is consequently not surprising, but it is nonetheless limiting for any quantitative understanding of economic well-being – particularly for nonelites – in a city that would otherwise be rich territory for it.
This paper seeks to partially address this gap with an analysis of five expense lists, scratched on the walls of five different buildings. These lists enumerate a series of consumables – mostly but not entirely limited to food – together with their cost. The small amounts involved, the emphasis on foodstuffs, and the location of the records all suggest nonelite actors – whether the authors of the graffiti, their readers, or both. These lists then constitute a precious, if contextually circumscribed, window into nonelite expenses, expense recording, and consumption.Footnote 7 This paper considers first the function of list graffiti as aspects of dialogic accounting and tentatively suggests that they may have been kept by and for nonelite visitors to the city. It then analyzes the consumption strategies and costs described in these lists and sets them against extant work on consumption in Pompeii and in the Roman world more generally. These lists describe nonelite consumption that is different – in cost, caloric value, dietary variety, and habit – from that imagined in most generalized calculations, and they reveal instead the complex opportunities and challenges of living in a society awash in consumer goods. In their variation, the lists also permit a glimpse past macroeconomic models of Roman consumption to individual decisions and strategies for getting by.
The lists and their contexts
All five of the lists under discussion were published in the CIL supplements on Vesuvian graffiti. Only one has seen more comprehensive study in the secondary literature, and the corpus has never been studied as a group.Footnote 8 A sixth list, a seeming “bar tab” from the Suburban Baths in Herculaneum, is not included here because its function seems somewhat different, although it and other price graffiti will provide important context.Footnote 9 All five lists are scratched in wall plaster, and they contain a columnar list of items followed by their cost. Items are often spelled according to variants common in Pompeiian graffiti, abbreviated, or misspelled.Footnote 10 The predominant cost unit is the as, often preceded by the abbreviation “A,” with occasional more expensive items listed in denarii, preceded by X̶ .
The best-known list, CIL IV 5380, is the only one from the Vesuvian cities to list expenses for multiple days. The list was found in 1880 in IX.7.25, a partially excavated modified atrium house, the structural peculiarities of which led Mau – and later, Della Corte – to identify the pre-79 CE phase as a hospitium (Fig. 1).Footnote 11 Flanking the entrance was a hot food establishment (IX.7.24) that opened into the atrium of IX.7.25. The stove apparatus from the hot food shop was connected to an oven located in the atrium of the house. These conjoined cooking facilities suggested to Mau some proprietary and functional connection between the hot food shop and the house behind it.Footnote 12 The house's tablinum (Fig. 1o), originally open to a peristyle behind (Fig. 1g), had been truncated by a dividing wall, leaving the resulting house largely, although not completely, cut off from the peristyle.Footnote 13 Mau thought he could see remnants of dining clinae on the floor of the refurbished tablinum, as well as in an adjacent room (Fig. 1 l).Footnote 14 All these features suggested to him the conversion of the house into a hostelry, connected to the food establishment at IX.7.25, which used the atrium as a kind of dining room, with sleeping quarters rented out from the adjacent alae. The owner, he hypothesized, used the rooms at the back of the house that were accessed by a narrow corridor (Fig. 1p). Mau's identification of the building as a hostelry was accepted by Della Corte, but it was only tentatively included in more recent studies of rented accommodation in Pompeii.Footnote 15
Plan of Regio IX, Insula 7, at Pompeii, showing house/hospitium IX.7.25 (after Pugliese Carratelli and Baldassare Reference Pugliese Carratelli and Baldassare1990–2003, Vol. IX, 870).

The graffiti list, although reported by Della Corte and others as having been located in the atrium or attached hot food establishment, was in fact found in a back room (Fig. 1t), on the north wall (Fig. 2).Footnote 16 Left in situ since its discovery, the list was heavily eroded until its removal for conservation, at which time Heikke Solin and Paola Caruso reanalyzed it and offered some corrections to Mau's transcription (translation author).Footnote 17


CIL IV 5380, as inscribed on the north wall of room t in house IX.7.25. (Photo by Heikki Solin and Paola Caruso. Reproduced with their kind permission and that of the Soprintendenza Archeologica di Pompei.)

Although there are no “A” abbreviations to indicate price in asses, it seems clear that the list describes the food and nonfood expenses incurred over an eight-day period, divided by day.Footnote 26 Solin and Caruso interpreted the “H” in Hxeres as a nundinal letter and, consequently, this day as a market day. They have therefore suggested a tentative date for the list in December of 63, 68, or 74 CE.Footnote 27 Expenses incurred for a slave (a domator) and possibly a person (Sittia) are distinguished by name from other, unassigned expenses.Footnote 28 Many of the items – bread, cheese, leeks, wine, oil, and wine – repeat in multiple days; whereas other foods such as meat shanks, sausages, and dates appear only once, along with a few consumer goods – a situla (a bucket, probably of wood or metal, judging by its cost),Footnote 29 a plate, and a lamp or lamp wick. Some items, e.g., montana, remain unclear.Footnote 30 The list describes a total of 227–28 asses (ca. HS 57) of expenses.
The other five lists offer no indication of time periods. As will be discussed below, there are some reasons to believe they list expenses for a single day only. CIL IV 4422 comes from the so-called Casa dei Gladiatori (V.5.3), a large peristyle courtyard with rooms along the south, east, and west sides.Footnote 31 In its final phase, the walls and columns of the peristyle were covered with graffiti, many of which pertain to gladiators, including combat scenes and names of combatants. The list in question was found in a so-called triclinium off the northeast corner of the peristyle. The list is headed by the name C. Iunius, presumably the person who incurred the expenses. Again, Mau's version has been slightly corrected by Solin, who has shifted the costs down to correspond with the items in question and changed some of the amounts (translation author):Footnote 32

The list therefore describes many of the same food items found in CIL IV 5380 – bread, wine, cheese, probably oil and onions, plus wood. The costs for two items – onions and a second wine expense – are illegible. The total legible costs amount to 15 asses (16.5 in Mau's version). If the costs for onions and wine are reconstructed using known prices for CIL IV 5380 (5 and 1 or 1.5, respectively), the total would have originally been around 21–22 asses.
Two further lists also come from a context associated with gladiators – the so-called Large Palaestra or Campus ad Amphitheatrum (II.7.1), adjacent to the amphitheater, the columns and walls of which also contained numerous graffiti associated with gladiators. CIL IV 8561 and 8566 both come from Column 18. CIL IV 8561 is captioned by the term “[at] Pompeii.” Below the list is a drawing of a gladiator captioned Soter or Sotericus, which may or may not be the name of the person who incurred the expenses. Della Corte assumed that the list referred to expenses incurred by a gladiator or trainer during a visit to the city (translation author):Footnote 33

The familiar food items – bread, wine, cheese, oil – are listed together with a pound of lard and pork for a total of 18 asses in expenses.
CIL IV 8566 came from the same column, is somewhat longer, and lists both expenses and moneys received (translation author):Footnote 34
pane(m) a(ssibus) II
purm(entarium) a(ssibus) III
oleum a(sse) I
[ - ] XC a(ssibus) IIII
vinum a(sse) s(emis)
casium a(sse) s(emis)
O(?)M(?) a(ssibus) IIII
vinum a(sse) s(emis)
XI K(alendas) ac(ce)pi X̶ I
vinum a(sse) I
porcin(am) a(sse) I
viinum a(sse) s(emis)
casiûm a(sse) s(emis)
L(ucius) Gavi X̶ IIII s(emis) <:ac(ce)pii?>Footnote 35
vinum a(sse) s(emis)
carn(em) a(sse) I
vin [ u ] m a(sse) I
bread 2 asses
relish (purm [ entarium ] = pulm [ entarium ]) 3 asses
oil 1 as
XC 4 asses
wine 1 as 1 semis
cheese 1 as 1 semis
O?M? 4 asses
wine 1 as 1 semis
on the 11th day (before the) Kalends accepted 1 denarius
wine 1 as
pork 1 as
wine 1 as 1 semis
cheese 1 as 1 semis
Accepted 1 denarius 4 semis from Lucius Gavius
wine 1 as 1 semis
meat 1 as
wine 1 as
Aside from the moneys received, the list names the usual foodstuffs. Wine appears multiple times with different prices, possibly pointing to different quantities or qualities (see below), whereas other consumables include pork, beef, and pulmentarium – in this case, probably a relish eaten with the bread listed above it rather than the pulse-based porridge of the same name. The list describes 27 asses worth of expenses and 34 asses received. The fact that the list more or less repeats itself after the indication of moneys accepted on the eleventh day before the Kalends may indicate that two days are listed here: the first day with 18.5 asses of expenses and the second with 8.5 asses. As we shall see, the fact that bread is only purchased once, however, points to a single day.
Two final lists come from workshop or industrial contexts and differ somewhat in the commodities listed from those mentioned above. In addition to staples such as bread and oil, they include other foodstuffs for both humans and animals. CIL IV 4888 was found in the backroom of a shop or workshop (VII.2.30) attached to the Casa di Mercurio (VII.2.35).Footnote 36 Costs are presumed to be in asses (translation author):

Unlike the other lists, the only common foodstuff listed is bread, together with a series of vegetables and herbs – cauliflower (or a cup?), beets, mustard, mint, and salt – plus wood, for a total of 16 asses in expenses. A possible payment to a procurator appears among the other items. To the right of this list, a list of many of the same foodstuffs – coli(culum), bet(am), men(tam), coeloe[?] (CIL IV 4889) – appears without costs, so it will not feature in the quantitative analyses below.
Finally, from a small room adjacent to the entrance of a bakery in Regio I (I.3.27),Footnote 37 beneath a bit of scurrilous graffiti alleging sexual services performed at a low price, comes a list of both foodstuffs and animal feed, as well as a possible reference to a daily wage or food allowance (diaria) (CIL IV 4000, translation author):

The total of 43 asses in expenses (assuming that the diaria is an expense and not moneys received) is dominated by hay, bran, and fenugreek, and it points to the maintenance of an animal. The presence of a stall with a manger in the rear of the bakery and the heavy paving around the mills to support animal labor suggest that animals – probably donkeys – were kept and used here.Footnote 38 Because this list is quite different from the others in the nature of the expenses, it will not feature in the quantitative analyses below, but it will be useful when considering the identity and economic status of the list makers.
Function and readership
Before considering what these lists have to tell us about costs and consumption in Pompeii, we should ask first how they were intended to be used and, by extension, what the identity of their authors and readers is. As is true of most ancient “accounting” in Pompeii, there is no evidence of addition or any other calculations performed on the costs.Footnote 39 They were clearly not made with the intent of producing a total expense figure. Instead, it is the enumeration of individual items and their individual costs that occupies the writer and reader. Costs are given in whole numbers, mostly in asses, but occasionally in denarii, plus semis fractions. CIL IV 8566 and perhaps CIL IV 4000, which may include instances of moneys received, do not distinguish these from moneys paid. With only two exceptions – the possible pound of oil and the pound of lard – no quantities are given for the items purchased.Footnote 40 Quantities therefore appear to be unimportant to this kind of accounting, either because quantities of commonly used items were broadly standardized and accepted or because it was the cost – not the cost per quantity – that mattered for these kinds of accountings.Footnote 41 All of these characteristics are typical of Roman monetary thinking: whole units, easily added in the head; commonly accepted prices per commonly accepted unit, which make units of measurement moot. This is what Melissa Bailey has described as a performance of knowledge and calculation that dominated cash-based encounters between individuals.Footnote 42
Performance may be more significant here beyond its role as a mere habit of accounting. As the last decade's work on graffiti has shown, graffiti is itself performative, a dialogic form of writing that more often than not imagines at least two interlocutors: a writer and a reader or responder.Footnote 43 Although expense lists such as these are rarely counted among examples of dialogic graffiti such as greetings, jokes, or insults, there are reasons to think that they, too, were intended not simply as private accounts but rather as a shared medium of verification. The short nature of all but one of these lists, seemingly recording expenses over a day or two at most, is quite different from, for example, the higher value accounts of Caecilius Iucundus that list transactions over longer periods of time.Footnote 44 Instead, these lists act more like an aide-mémoire for a confined set or day of transactions. Why they should be scratched on walls at all may indicate a need to verify a set of expenses incurred, possibly between a seller and a purchaser or consumer, the equivalent of a bill or an in-store account. Such is thought to have been the case for the seeming bar bill (CIL IV 10674) from the Suburban Baths in Herculaneum. Although the contents and locations of these lists are somewhat different, they, too, may well have served a similar function.Footnote 45
That these lists were written indicates that there was the expectation that all parties involved could read them. The spelling may be eccentric, but the fact that such small-scale transactions would have been written at all, whether for verification or for personal bookkeeping, is further evidence for what Wallace-Hadrill has termed the “trivializing uses of the skills of writing.”Footnote 46 Only a population of nonelites comfortable somewhere on the spectrum of writing and reading would produce or use such admittedly “trivializing” accounts, even if those accounts are structured according to different modes of numeracy and cost than modern ones. As new work on this kind of writing has emphasized, these expense lists describe a nonelite world – or at least a nonelite urban world – saturated with words and modestly numerate.Footnote 47
It is important to note that although these are often termed “household” or “shopping” lists, they appear in spaces that are hard to identify with typical households.Footnote 48 A back room in a possible hospitium for the multiday list, the back room of a workshop, the side room of a bakery, and two spaces associated with the housing and/or training of gladiators constitute the findspots. The possible hospitium, as well as the Casa dei Gladiatori and the Large Palaestra, are places where transient visitors to Pompeii may have gathered – something that is also possible, but less obvious, in the case of the workshop and bakery.Footnote 49 The short length of the lists, and therefore the potentially short duration of expenses incurred, would make further sense if some or all of these were expenses incurred by visitors, short-term occupants, or even poorer people eating out of their home quarters.Footnote 50 If these people were reliant on a third party – their host or a vendor – to supply these items (as is also thought to be the case for the Herculaneum bar bill), they might well find it useful to have a verifiable, durable list.
It is important to consider at the outset how the nonhousehold quality of these lists might impact the nature and quantity of consumption. First, if these lists were not made in the individuals’ permanent dwellings, it is possible – even likely – that these people were consuming food, beverages, or consumer goods in other venues. As I will note below, there are also many kinds of items missing from these lists that one would expect to find on a real household expense list. The likelihood that these lists represent only a portion of expenditure means that they should be read as barometers of consumption minima, not true household consumption records. On the other hand, particularly if they were visitors, these people were probably not consuming according to their normal patterns, with fewer consumer goods and more preprepared food. Consequently, although we cannot be certain of the identity of the persons writing and using these lists, we should be cautious about viewing them as normative for nonelite Pompeiian consumption.
Quantity and time
Despite these caveats, these lists share a number of features, which makes them useful for examining the consumption of staples in the city. In order to do so, however, we must first reckon with one of their principal lacunae: specific quantities of people, amounts of food, and time.
The exception to these lacunae is CIL IV 5380, the eight-day list that provides some details that might be cautiously applied to the other lists. The list names two distinct persons as receiving specific rations – a slave (puer) and a domator – whereas the remainder of the consumed items are unassigned. The size of this “family” group has therefore often been assumed to number three persons – two adults and a slave.Footnote 51 The number of people consuming the unassigned goods, however, is nowhere stated. We also cannot be certain that the slave was not also partaking of these unassigned items.
Given that this list supplies a set of expenses for eight days, it provides the opportunity to observe purchasing patterns. Particularly significant is the daily habit of purchasing bread. Unassigned bread is purchased each day. On most days, bread is also purchased for the slave. This pattern suggests that bread purchases might be used as a proxy for time – at least one bread purchase per day.Footnote 52
We might also gauge the cost of such bread – or, better, two kinds of bread: bread for the slave and regular, unassigned bread. There were a number of different kinds and qualities of bread in the Roman world, which are distinguished by the types and origins of wheat, the fineness with which it was ground, and extra ingredients to give it flavor.Footnote 53 On this list, bread for the slave consistently costs two asses. The exception is on the sixth day before the Ides, when the slave bread expense is doubled, and it is followed by a day when no bread is purchased for the slave, suggesting that double the amount was purchased and then expected to last two days. The coarse bread (panem cibarium) consumed the day before the Ides also costs two asses, all indicating a standard price for low-quality bread/day.
The unassigned bread costs considerably more: eight asses/day is spent on the first four days, and two asses/day for the last four days. Beginning on the fifth day, then, the list documents a decline in the number of people eating the bread and possibly also the quality of bread. If, as has been suggested, two persons are responsible for the eight asses/day bread expenditures, bread here costs four asses/day. This is on the high side for bread costs from the other lists, which vary between two asses in CIL IV 8561 and IV 8566, 5.5 asses according to Solin's reading of CIL IV 4422, and six asses in CIL IV 4888. It is also higher than that typically cited as the average cost of bread in Pompeii – two to three asses per loaf – although these widely repeated figures do not recognize any qualitative distinctions that might impact the price.Footnote 54 Smaller variations in price may also be a result of different sellers charging different prices, a product of the local market.Footnote 55 It is therefore possible that the eight-asses-worth of bread is either of particularly high quality or is supplying three people. For the calculations below, I have followed the communis opinio that the list is supplying two unnamed people plus a slave in the first four days, but only one unnamed person and a slave from the fifth day.
As noted above, weights or volumes are almost never supplied, almost certainly because most staples came in commonly accepted amounts, which obviated the need for quantity delimiters.Footnote 56 Bread, for instance, is likely to have been sold in loaves of a specified weight.Footnote 57 At Pompeii, the carbonized loaves found in the bakery of Modestus came in three sizes: their original weight is unknown, but they were carbonized into loaves weighing 500–600 g (some 80% of the total loaves preserved, averaging 567 g), 700–800 g (5%), and 1,200 g (1%).Footnote 58 Considering weight lost through charring, the “normal” bread loaf for Pompeii may have weighed somewhere between two and three librae (646–970 g).Footnote 59 Whether or not these loaves were also meant to be sold in subdivisions of this weight depends on whether one interprets the scoring on these loaves as intended subdivisions or as part of the prebaking process.Footnote 60 CIL IV 4227, a graffito from a house in Regio V, provides the only possible bread price with accompanying weight: “…pan(em) l(ibram) IS,” or 1.5 asses for a libra (323 g) of bread. There are reasons to be cautious about this evidence: the graffito is particularly badly preserved and may not describe bread per pound at all.Footnote 61 If it does, it is the only instance from the Vesuvian cities in which bread cost is accompanied by its weight or quantity, indicating that an unusual quantity is being listed – possibly half a loaf – and explaining its lower-than-usual cost.Footnote 62 If we can assume that bread was most often sold in whole loaves, the most common weight of which was around 2–3 librae, and that the most common price for a loaf is between two and three asses, we might arrive at a “normal” cost of two to three asses for 2–3 librae of bread.Footnote 63 This, then, may have been the standard weight and quantity assumed for the bread named in these lists.
Wine costs by quantity are better attested: the sextarius seems to be the standard serving size for wine in wine shops throughout the town and, like bread, varied with the quality of the product, from one as/sextarius for low-quality wine to four asses/sextarius for Falernian or other high-quality wine.Footnote 64 The advertisement from the wine shop Ad Cucumas in Herculaneum makes a display of these differences with four sextarii of different colors, beneath which are listed different prices (Fig. 3). The different costs of wine in CIL IV 8566 therefore may be differences in quality or quantity, with cheap wine costing one as/sextarius. Commonly accepted quantities for other staples such as cheese or oil are unknown.Footnote 65
Wine advertisement and prices painted on the exterior of the taberna Ad Cucumas, VI.14, Herculaneum. (Photo by Carole Raddato, licensed under the Creative Commons Attribution–Share Alike 2.0 Generic license, and with the kind permission of the Soprintendenza Archeologica di Pompei.)

Average expenses from the lists
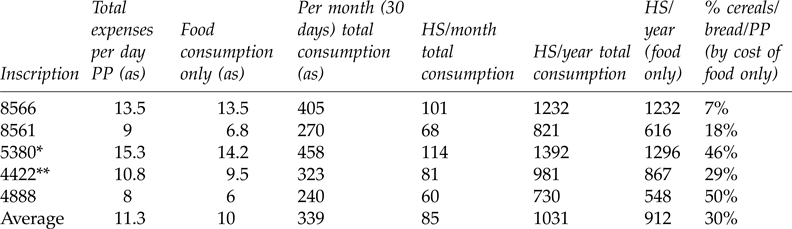
The observations about persons, quantities, and prices gleaned from CIL IV 2350 allow us to make estimates – still hypothetical – about those same missing quantities from the rest of the lists. Putting aside CIL IV 4000 with its majority of animal-feed expenses, the other lists have only one line item for bread – suggesting, according to the “daily bread” rule outlined above, a single day's worth of expenses. Were all these lists the expenses of a single person (and, in the case of CIL IV 5380, two people plus a slave [minus the domator and nonfood items] for four days, and one person plus a slave for four daysFootnote 66), total expenses average 19.6 asses/day/person (or 17.1 for food only). They range from 27 asses spent by the person in the Large Palaestra (CIL IV 8566) (if this is for a single day) to the average of 15.3 asses/day/person spent by the small family at CIL IV 5380 (Table 1).Footnote 67 Except in two cases, however, we cannot be sure that these expenses cover only the single individual imagined or that they cover only the single day suggested above. As noted, CIL IV 8566 has some indications that it tracks two days of expenses. Consequently, for the purposes of argument, using the same calculation for persons in CIL IV 5380 and doubling the number of people or days for other lists generates a minimum average of some 11.3 asses/day/person (or 10.0 for food only). The range is from 15.3 asses from our family of CIL IV 5380 to eight asses for the vegetarian in the workshop (CIL IV 4888) to nine asses for the person or persons in the Large Palaestra (CIL IV 8561) (Table 2). Very different in quantity and character are the expenses listed for the slave: at only 10 asses for eight days, his average expenses amount to only about 1.5 asses/day, assuming that he consumed only the bread assigned to him. I will have more to say below about these averages in the context of other calculations of Roman consumption and living costs – in Pompeii and beyond.
Total expenses for the five graffiti lists, assuming a single person and single day for each list. For CIL IV 5380, this assumes 2.5 persons (2 persons + 1 slave) for 4 days, and 1.5 persons for 4 days.

* calculated without “domator” for 2.5 persons for 4 days, and 1.5 persons for 4 days
** reconstructed total
Expenses for the five graffiti lists, assuming 2 persons, or 2 days. For CIL IV 5380, this assumes 2.5 persons (2 persons + 1 slave) for 4 days, and 1.5 persons for 4 days.

* calculated without “domator” for 2.5 persons for 4 days, and 1.5 persons for 4 days
** reconstructed total
Patterns of consumption beyond cereals
All of the lists except CIL IV 4000 are dominated by foodstuffs. The range of foods, however, is remarkably consistent, and almost all of them include bread, cheese, oil, and wine. These lists therefore present a consistent package of dietary staples as they existed in the Vesuvian cities, albeit a different one from those assumed by an earlier scholarship – and even from those emerging from the recent archaeological data.
Until recently, most scholarly accounts of Roman diet have assumed that cereals constituted the lion's share of the diet. Foxhall and Forbes's assessment of Greco-Roman cereal consumption estimated that 70–75% of calories derived from grain.Footnote 68 A heavy dependence on cereals also lay at the center of Garnsey's reconstruction of Greco-Roman foodways, its protein-deficient regime leaving ancient populations vulnerable to widespread periodic malnutrition.Footnote 69 Recent isotope data from the Herculaneum skeletons have postulated that the more than 70% of the diet not constituted by marine protein must have been dominated by cereals.Footnote 70 Cereals continue to be the basis on which subsistence requirements and land-carrying capacity measurements have been calculated, which in turn lie at the heart of calculations for Roman gross consumption and production more generally.Footnote 71
Recent work on ancient cereals has suggested that they constituted a far more positive, nutrient-rich dietary source than previously supposed.Footnote 72 More importantly, however, new archaeobotanical and faunal data have challenged the primacy of cereals in Roman diets generally and in the Vesuvian cities in particular. A significantly greater dietary variety has emerged from these data, even in nonelite contexts.Footnote 73 Jongman, who once assumed cereal dominance for both the Pompeiian diet and the carrying capacity of the hinterland, has now argued for important caloric contributions from both oil and wine.Footnote 74 Pulses, which had always figured as an important component in Garnsey's dietary models, are now seen to constitute a major source of vegetable protein in all Roman diets, whereas both textual and archaeological data show their centrality in the Vesuvian foodways of both elites and nonelites.Footnote 75 Archaeological evidence for moderate to robust levels of meat and fish protein has overturned the notion of a largely vegetarian diet.Footnote 76 Rowan's analysis of a Herculaneum sewer beneath a nonelite insula and Ellis's similar excavation of a drain from the Porta Stabia neighborhood epitomize this image of dietary variety beyond cereals. In the Herculaneum drain, some 113 separate food items were identified, consumed by the insula's denizens above. Although cereals are poorly preserved in this assemblage and are therefore probably underestimated, the range of other fruits, vegetables, fish, and shellfish, as well as imported goods such as dates and pepper, describe a highly varied diet. The drain outside VIII.7.9–11 at Pompeii produced young cuts of meat, shellfish, and dormice, along with the usual staples such as grain and legumes.Footnote 77 Both the Herculaneum and Pompeii data reveal a package of high-frequency dietary plants – cereals, grapes, olives, figs, nuts (hazelnuts and walnuts), lentils – consumed by rich and poor alike, along with the frequent addition of fish and shellfish. In the Pompeii case, two different establishments on the same block produced similar staples but different quantities of higher-status foods such as meat and dormice. Higher dietary status, Rowan argues, was evident through the specific choice of species or varietals, not a wholly distinct “elite” diet.Footnote 78
These new data have revealed the many kinds of noncereal, protein-rich foods that nonelite urban dwellers ate. Together with new estimates of the hinterland's agricultural output, the distribution of property, and the vast quantity of retail establishments – especially those for food – the data have led some to argue that the great majority of locals lived above dietary subsistence.Footnote 79 Nonetheless, these qualitative findings are hard to translate into absolute quantities or dietary percentages: knowing what people ate or might have eaten is not the same as knowing how much they ate and in what proportions. The Pompeiian lists are valuable in this regard because they present cereal consumption in the context of a significant portion of a broader diet.
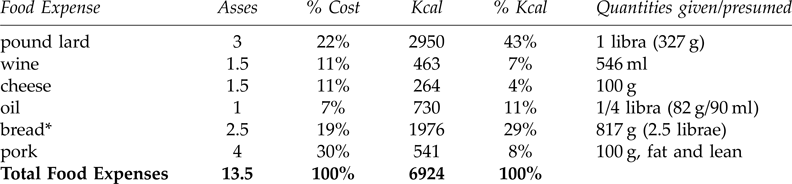
Cereals are here, but in a minority percentage by both expenditure and probably by calories (see Tables 1, 2, and 3). Expenditure on cereals averages around 30% of food-only expenditures for all the lists, ranging from 7% to 50% of food costs per person. Calculation of caloric quantities and percentages of cereals and other foods is fraught with problems, and the results presented here should be taken as an estimate only. As noted, most of the lists contain no quantities, in part, as Bailey suggests, because serving sizes were probably largely standardized. Furthermore, without knowing the specific ingredients in the bread – whether it was made with barley, millet, or other grains that had different nutrient mixes – our caloric and nutrient calculations are at best only partial. Indeed, using modern whole wheat bread almost certainly underestimates iron and protein, as well as zinc.Footnote 80 If we take the one list (CIL IV 8561) in which we have a quantity and a single, named person, and we assume (as above) that a single expense-line of bread indicates a single day's worth of expenditure, we might use our above-described bread weight estimate of 2–3 librae together with a sextarius portion for the wine and, adding some guesses for small standard serving sizes for the rest of the foodstuffs,Footnote 81 arrive at a total caloric estimate of some 6,900 kcal of food consumed (Table 3). This is a big quantity, although not, as we will see, without historical parallels, and it is heavily impacted by the estimated 2,950 kcal for the (libra) pondo (327 g) of lard. By these calculations, cereals would constitute only about 29% of kcal from this list, and 19% of food-only expenses. When the lard is removed from the calculations (assuming, for instance, that it was used for cooking and only a portion of it was consumed in a single day), total caloric intake drops to around 3,900, and cereals increase to 50% of those calories – still only half of a diet in which high-caloric staples of cheese, meat, and oil continue to occupy an important share. The admittedly still-sketchy nutritional balance sheet for such a diet is very high in fat, carbohydrates, and protein, as well as calcium, iron, and potassium, while being largely deficient in any of the vitamin C– and D–bearing fruits and vegetables – lacunae on which I will have more to say below.Footnote 82
Caloric reconstruction of diet from CIL IV 8561, food expenses only.

* assuming Pompeiian loaf of 2.5 librae
We can also reasonably calculate caloric minima consumed by one other person on our list – the slave in CIL IV 5380. Assuming, as I have done, a consistent quantity of 2–3 librae per unit of bread, his minimum caloric intake can be estimated at just under 2,000 kcal/day, assuming he ate nothing but the bread allotted to him. As noted above, the “slave” designation for bread is probably a designation of poorer quality, not an indication of a diet limited solely to bread. Consequently, it is unlikely that the slave was eating only bread. Nonetheless, the calculations provide a useful hypothetical minimum for overall consumption and a maximum for cereal consumption.
It is noteworthy in this regard that in the list with the person(s) spending the most – CIL IV 8566 – the least bread is consumed, and that the one person who seems to be consuming at or below caloric subsistence levels – namely the slave – is specified as consuming only bread. The same trends can be observed in the multiday list: on those days when this truncated family consumes more and higher-value foods, cereal consumption as a percentage decreases, whereas on those days when it seems to be practicing economy, cereals increase.Footnote 83 Cereals-based “subsistence” is therefore only evidenced here for a slave, whereas the other people mostly consume a minority of cereals, with the lion's share of both their calories and their expenses dedicated to more calorie-rich foods.
Cheese appears on these lists as a surprising second staple, featuring in all but the vegetable- and herb-dominated CIL IV 4888 and on three of the eight days of the multiday list. Although it plays a prominent role in Roman military rations, cheese is largely ignored in ancient Mediterranean dietary reconstructions, in part because of its near-invisibility in the archaeological record.Footnote 84 It is also largely left out of literary texts. But, tellingly, when it appears, it is in the context of a presumed military diet or associated with urban working people or rural laborers.Footnote 85 In the Pompeiian lists, it appears as a kind of second staple to be eaten with bread.Footnote 86 CIL IV 5380 specifies two kinds of cheese: an unspecified “daily” cheese and a particular “soft” cheese (casium mole[m]) – perhaps similar to those described by Columella – eaten along with a number of other extras on the fourth day before the Ides.Footnote 87 Cheese is essentially the milk of sheep, goat, or cow conserved for long-term use. In our reconstructed calorie balance sheet, it is assumed to have been served in relatively small (ca. 100 g) servings, and its caloric contribution is therefore relatively small – some 4% of the total when the lard is included and 7% without it. Nonetheless, the frequency of cheese in these lists points to secondary animal products in a more central dietary role than typically assumed and to a frequently-consumed source of fat, protein, calcium, and B vitamins.
Wine and olive oil are the other two most frequently consumed staples, appearing together in all but CIL IV 4888. Wine is presumed to be served by the sextarius and would have therefore contributed some 460 calories per serving, or 7% of the calories. Most lists suggest that wine was consumed once per day, although the individual in CIL IV 8566 drank six servings of cheaper wine, perhaps even more if the semis difference indicates an extra half sextarius instead of a somewhat better-quality vintage, as assumed here. The quantities of oil consumed in these lists are harder to know. Oil most frequently costs either one or three asses, presumably for different portion sizes. CIL IV 4000 lists a libra of oil as costing four asses, so perhaps the other lists describe a libra of cheaper oil and a quarter libra, respectively. In our reconstructed diet of CIL IV 8561, wine and olive oil together constitute some 1,180 calories, comprising 18% of the diet with the lard and some 30% without. Consequently, they still contribute less than bread but come close to equaling it. Hypothetical reconstructions of the Pompeiian diet had already staked out a major caloric role for oil and wine.Footnote 88 The lists confirm these hypotheses while placing wine and oil alongside cheese and bread in the dietary mix.
Meat is consumed somewhat less frequently than these four staples and may be an indication of either greater wealth or “excess” consumption.Footnote 89 It appears in three of the five food-based lists, and in all three instances, more than one type of meat is recorded. Meat is also a major component of a somewhat different kind of list – the food and bar bill from the Suburban Baths at Herculaneum (CIL IV 10674), mentioned above. This “bar tab,” amounting to some 51 asses of drinks and snacks, includes both three ofellae (cutlets) and four thymatla (thyme sausages), costing 12 and 8 asses respectively. The impression of a meat-heavy diet from these lists is balanced by the less frequent consumption in the multiday list. The family in CIL IV 3850 eats meat only one day out of eight (although the domator gets fish one day), and then in different kinds – femininum (shanks?), beef, and sausage – costing 10 asses in total. This fourth day before the Ides witnesses a marked increase in consumption – some 112 asses in total – and a whole range of nonstaples, including dates and a range of consumer objects. Here, meat consumption seems part of a splurge, just as the multiple forms of meat consumed in the other lists point to a particular desire for – and the means to obtain – a satisfying variety. It is important to note, however, that meat need not be terribly expensive: whereas the shanks from CIL IV 3850 and the cutlets and thyme sausages eaten in the Herculaneum baths were costly, one as was enough to buy a portion of beef, sausage, or pork in the other lists.Footnote 90 Pork seems to be the meat of choice in these lists, consumed either as a cut or chop or in sausages, whereas beef probably comes second. These are trends that are echoed in the city's faunal material.Footnote 91 Fish is only mentioned once, purchased for the domator in CIL IV 5380Footnote 92 Fish and shellfish comprise a significant component of the Herculaneum drain deposit and some 9–52% of the diet in isotopic studies of Pompeiian males. In contrast, the Herculaneum isotope studies found somewhat lower contributions, suggesting that fish was, as it is in the lists, an occasional but not rare dietary admixture.Footnote 93
The most frequently mentioned vegetables are onions. Although Columella mentions a varietal from Pompeii,Footnote 94 onions and the Amaryllidaceae family are rare in the archaeobotanical record of Pompeii, not least because, like other vegetables, they are consumed without their seeds.Footnote 95 As with cheese, the lists provide a window on those foodstuffs missing from the archaeological record but seemingly consumed with some frequency by local nonelites. Although they appear in two of the lists, a price (five asses) is only listed for CIL IV 5380, assuming this can be read as cepas and not fecias.Footnote 96 Leeks appear twice in CIL IV 5380. Onions and leeks form part of the literary imagining of the poor, whose smelly breath formed the bodily exhaust of ignorance and inferior morality.Footnote 97 It might be noteworthy, then, that onions and leeks are not eaten by those who eat the majority of meat, although given the relative cheapness of both, it is hard to see onions and leeks as a cost-saving food. Literary prejudices aside, the multiple appearance of leeks and onions point to a desire for strong flavors, which is lacking in the otherwise bland diet of cheese, bread, and oil. The only other vegetables appear in CIL IV 4888 – beets, probably cauliflower, mustard, and mint – which is the only vegan list of the group. Mustard and mint are reasonably well attested in the archaeobotanical record for the Vesuvian cities, whereas the Brassicaceae family, which includes both cauliflower and mustard, appears as a noticeable increase in the Roman-period pollen data from the area. This points to more widespread cultivation and consumption than attested in these lists.Footnote 98
These lists, then, present both a consistent image of nonelite dietary staples and also a somewhat different image than has been presented either in broader studies of Roman diet or in recent archaeological work on the Vesuvian cities. Rather than a cereal-majority diet, they describe a Mediterranean tetrad composed of bread, oil, wine, and cheese, with the latter three staples rivaling cereals in their caloric contribution and yielding a more diverse, protein-rich, and calcium-rich nutritional package than cereals alone. The additions to this dietary “core” – meat of different kinds and a limited range of pungent vegetables – attest both to frequent, although not daily, protein consumption and to a desire for flavor variety, even among the working population of the city. This is not to suggest that cereals were unimportant or that some people did not consume the kind of cereal-dominated diet supposed in an earlier scholarly literature. Indeed, as we will see in a moment, the lists provide detailed testimony for such regimes. Instead, the value of these lists is in quantifying the monetary and caloric contribution of cereals alongside other foodstuffs that, as a package, constituted the core of a more nutritionally complex and calorie-rich diet.
With its high-caloric value, plus the importance of cheese and meat alongside bread, this diet from the graffiti resembles the extant data for Roman military diets. As Davies demonstrated long ago, military diets, although having an important grain contribution, had equally significant additions of meat and cheese, as well as legumes.Footnote 99 The Vindolanda tablets describe the consumption of large quantities of lard – not unlike our person from CIL IV 8561 – as well as important shipments of meat consisting of both pork and hunted animals.Footnote 100 On the northern frontier, beer seems to have taken the place of wine as the principal alcoholic calorie contributor.Footnote 101 Stereotypes of soldiers likewise assume a diet composed of lard, cheese, and poor wine.Footnote 102 These are diets for men doing heavy labor and, very similarly to the graffiti diets, they invest heavily in calorie-rich foods. The expectation that meat and wine formed part of a working diet also makes further sense of Trimalchio's self-described ship cargoes as being dominated by wine, bacon, and beans, as well as slaves and perfume – the “low brow” part of the list drawing on the audience's knowledge of such diets as being heavy in alcohol, legumes, and protein.Footnote 103 Historically, too, such high-calorie working diets composed of bread, alcohol, and protein are not uncommon, and they suggest that even the high calorie estimate of CIL IV 8561 falls within historic ranges of possibility for those doing heavy labor.Footnote 104
Cycles of want
The multiday list in CIL IV 5380, however, reveals the temporal variation in even this expanded dietary tetrad. On the eighth, seventh, and fifth days before the Ides, this small “family” consumed a version of the bread-wine-oil-cheese package. On the fourth day before the Ides, they seem to have splurged, branching out into different kinds of meat and cheese, and even dates. Solin and Caruso suggest that this may have been a religious festival or a market day, or both.Footnote 105 For the next three days, however, perhaps as a result of the splurge, they spent considerably less, eating a cereal-only or cereal-majority diet, with some allowance made for leeks and oil – or fish for the domator. Their expenses vary according to their investment or capacity for dietary variety, along with what appears to be a departure of at least one person after day four: expenses average around 16 asses per day for the first three days, and only seven for the last three, whereas the splurge costs 112 asses – almost twice the sum of the first three days’ expenses.
We have no way of knowing if this list accounts for all food expenses consumed by this group. If they were transients, they might also have been consuming food in some of the city's abundant food and wine shops. It is therefore possible that the shifting consumption trends noted here are a product of either dining elsewhere for the second four days or slowly eating the leftovers purchased on the fourth-day splurge. The continued and regular purchase of bread, however – both unassigned and for the slave – suggests that staples continued to be purchased and recorded in the same place. As Solin and Caruso have also suggested, it appears that the variations represent actual changes in expenditure and consumption.Footnote 106
Variation between high and low consumption, reflective perhaps of changing levels of income or savings, are typical in modern household budgets of the poor and reflect lives lived in boom-bust cycles of plenty and scarcity.Footnote 107 The moments of scarcity, if that is what is recorded in the three days before the Ides, are composed of a cereal-majority diet of bread and spelt – with a single addition of leeks and oil, very similar to that envisioned in the earlier assessments of ancient diet. Here, however, we can see this diet not as a static norm but as a low point in eight days of changing dietary variety and caloric intake.Footnote 108
It is also important to note that the moments of plenty for this group do not seem to be expressed through consuming more bread, or even more of the bread-cheese-oil-wine tetrad identified here as a staple Pompeiian diet.Footnote 109 Instead, the splurge in the fourth day is marked by the consumption of different, more expensive, better-tasting food, and above all, different types of food – a variety of kinds of meat, two kinds of cheeses, and possibly dried fruits and nuts. It also included a variety of consumer goods, either as part of a religious ritual or intended to make the consumption of those foods a more pleasant experience – tableware, lighting, and even incense. New work on the diet and consumption patterns of the modern poor, particularly those living close to dietary subsistence, has found similar practices: a tendency to spend extra resources, not necessarily on more calories, but on better-tasting, more expensive, higher-status food, often in contexts of radically increased expenditure, such as religious holidays, weddings, funerals, or other celebrations.Footnote 110 Rowan's spatial analysis of the Herculaneum sewer noted a related phenomenon: higher-status residences consumed the same dietary “package” as poorer ones but with periodic admixtures of imported or unusual foods.Footnote 111 CIL IV 5380 reveals just such cycles of spending and consumption over time rather than a static image of subsistence.
Other consumer goods
These lists also reveal the impact that living in a major consumer culture had on the consumption patterns of nonelites. CIL IV 5380 includes incense, a cooking pot, a plate, a bucket – probably made of wood or bronze – and a probable lamp wick or lamp, whereas CIL IV 4888 may include a cup (although it is more likely to be cauliflower). In CIL IV 5380, these mostly ceramic consumer goods comprise some 6% of purchases and are tracked like food, with about one piece purchased every other day on average. The cheapness of these goods (most kinds of basic table and cooking ceramics cost only about one as) is notable, as is their ubiquity even on lists consisting otherwise only of food. For even transient nonelites, buying a plate from which to eat, or incense to improve the smell of one's rooms, seems to have been part of basic consumption habits – as frequent in these lists as the consumption of meat.Footnote 112
Income, dependents, and capital
These five lists are principally concerned with food expenses. Nonetheless, as a result of the peculiarities of their accounting, they provide an occasional glimpse of other pieces of nonelite economic life and, in the process, a complex image of the economic status of their agents. CIL IV 8566 lists 34 asses of income – one denarius on the ninth day before the Kalends and, seemingly, one denarius and four semis from one L. Gavius. These do not appear to be wages. Perhaps they are debts paid. But in any event, they are higher than what appears to be the rate for unskilled labor in the Vesuvian cities. Income data for Pompeii are scarce: an advertisement from Boscotrecase for operariis panem denarium (CIL IV 6877), and perhaps one for latrine or dung cleaning from Herculaneum at 11 asses (period not indicated; CIL IV 10606), provide an indication of some 11–16 asses/day for unskilled wage levels.Footnote 113 The individual in CIL IV 8566 residing in the Large Palaestra is evidently not a latrine cleaner or day laborer but someone earning or receiving and spending twice to three times those levels.
Other lists provide evidence of support or pay to others. The small family in CIL IV 5380 was supporting a male slave and paying some of the food expenses of a domator, including fish and wine. This domator could be an animal tamer or trainer (domitor) employed by the family, a person of Illyrian origin (Domator), or a manager – perhaps the proprietor of the hospitium.Footnote 114 If we accept Solin and Caruso's reading of sittiae in CIL IV 5380 as the cognomen Sittiae, they may also have been paying money to one of Pompeii's important families. The individual in the shop in Regio VII has among his or her expenses procu(ratori?) – possibly payment to an agent.Footnote 115 Similarly, the diaria in CIL IV 4000 is not indicated by the normal accepit and therefore seems to be a daily wage or ration paid to someone else.
This individual(s) of CIL IV 4000, about whom I have had little to say, given that most of his or her expenses were dedicated to animal feed, may have been the owner or employee of the bakery in which the list was found. She or he was not only paying someone a daily wage or food allowance of five asses but also feeding one or more animals with some 27 asses worth of fodder. If the montana in CIL IV 5380 can be read as montanum, or clover-based fodder, this small family, too, dedicated some 17 asses to feeding an animal. Animal feed in cities could be famously expensive: a humorous tavern sign from Aesernia finds a client who is content with the cost of a prostitute but complaining over the cost of donkey fodder.Footnote 116 Indeed, analysis of fodder found at Oplontis and Pompeii reveals not simply hay but a rich mixture of local and imported grasses and legumes.Footnote 117 Animal maintenance, as the Pompeii list attests, constituted a major expense and investment.
Most of the people in these lists therefore have some kind of capital (human or animal), individuals whom they are paying, or income that appears to be above the going rate for unskilled labors. Consequently, the impression of a more-than-bare-bones existence suggested by the overall consumption levels would seem reinforced by individuals employing, supporting, or being owed money from others. It is important to note that the support of dependents does not in itself indicate a significant level of prosperity. Slave-owning was common even in families of lower socioeconomic status: the quintessential literary topos of the poor man – Simulus in the Moretum – is said to own a slave, and the papyrological and literary corpora are full of instances of even the lower echelons of urban nonelites hiring day laborers, owning a slave, or having other kinds of occasional dependents such as apprentices.Footnote 118 The costs of supporting and paying these various dependents in our lists is low – five asses for daily rations, 1.5 asses/day for a slave's bread – in keeping with the small scale of the other expenses. Rather than absolute evidence for prosperity, these expenses reveal the complex of relationships that characterized nonelite economic balance sheets – paying wages, collecting debts, and, particularly, keeping track of the subsistence costs for others – be they slaves or an occasional worker.
Missing consumption
Although the lists are useful in revealing heretofore unexplored patterns of Roman consumption, they are far from being complete expense records in the way that a true household budget would be. Even their majority expense category – food – shows some surprising lacunae. Fruits, for instance, known from archaeological evidence to have loomed large in Vesuvian consumption, are entirely missing. Although grapes and olives are present as wine and oil, the figs, apples, and various nuts so abundant in the botanical data are largely absent; cabbage, seemingly a local staple vegetable, appears only once.Footnote 119 Solin and Caruso explain this in CIL IV 5380 by arguing that the list may date to the winter months when fresh fruit and vegetables were rare, also noting the presence of dried fruit, but this does not explain their absence in the other lists.Footnote 120 Pulses, common fare in rich and poor households alike, are likewise underrepresented, particularly if the pulmentarium of CIL IV 8566 is the relish to accompany bread and not the pulse porridge.Footnote 121
The small quantities or absence of these items, known to be major components of Vesuvian diets, is important to note. Their absence may be a product of the lists’ protagonists eating outside their homes and therefore preferring “preprepared” food rather than full meals, or purchasing these items elsewhere. Fresh fruit, in particular, might have been purchased ad hoc in market stalls rather than from those supplying bread, wine, and the like. The absence of pulses and puls in particular is very strange: the staple porridge made of emmer wheat and pulse would seem to form part of even a preprepared food diet and, given its seeming importance in all Romans’ diets and the ubiquity of its ingredients (emmer wheat and pulses) in the archaeological record of the Vesuvian cities, it would seem to be another staple along with bread and cheese.Footnote 122 Its absence here could, again, be the result of these people purchasing additional food elsewhere. Indeed, food remains from Roman hot food establishments are dominated by legumes – beans, lentils, chickpeas, and some instances of grain and legumes that could be puls – as well as new finds that point to dishes made of pork and seafood.Footnote 123
Also, unlike true household expenses, these lists contain no mention of rent or any other housing cost. If the list readers or writers were staying temporarily in the city, at a minimum one might expect a sum for lodging. Judging from the relief of an innkeeper from Aesernia mentioned above, however, such costs seem to have been regularly folded into overall board costs – or, at any rate, not included in the food bill issued by the inn – so their absence here is not surprising.Footnote 124
Conclusion: Consumption in context
By way of conclusion, it is useful to address the differences between the quantities – and more importantly, the practices – attested by these lists versus other consumption calculations, for both Pompeii and the Roman world more generally. The dietary tetrad, the importance of meat and consumer goods, and the complex but small-scale economic relationships evinced by these lists are somewhat different from many of the quantitative reconstructions of Vesuvian and Roman consumption, although they are supported by more and more qualitative archaeological evidence. The reasons for these disparities are revealing, both of the assumptions that have fed most quantitative work on Roman consumption and of the alternative possibilities presented by household-scale data.
All of the generalized estimates for Roman food consumption have at their heart either caloric minima or ancient basic rations expressed in wheat, multiplied by an average price for wheat and multiplied by a factor to account for other foods. Total per-capita-consumption calculations then introduce further multipliers – again applied to the wheat consumption constant – to account for other expenditures, taxes, and investments. For food consumption alone, the results have ranged from 86 (Temin) to 200 (Goldsmith, Maddison) HS/year/person, with total consumption ranging from 153 (Hopkins) to 380 (Goldsmith, Maddison) HS/year/person. Verboven made some similar calculations for Pompeii based on the documented cost for wheat (some 12–30 asses/modius) and (presumably) caloric minima for a food subsistence minimum of 115–300 HS/year. Footnote 125
The Pompeiian lists document much higher consumption expenses, both for food expenditure and the aspects of “total” expenditure that include consumer goods, wages, and the support of dependents. Average food expenditures from the lists can be estimated at between 912 (minimal) and 1,564 (maximal) HS/year/person, whereas total expenditure on food and consumer goods averages between 1,031 and 1,785 HS/year/person (see Tables 1 and 2). Food consumption from the Pompeiian lists therefore runs some four to 18 times more than that estimated in the general Roman food calculations, and three to five times the subsistence expenses estimated for Pompeii by Verboven. Only the slave, whose minimum food costs average around 130 HS/year, falls in the range of those general calculations.
Two reasons for the disparities between the lists and the general calculations can be noted – one having to do with the social status of the consumers behind these lists, and the second relating to the assumptions and methods used to estimate Roman consumption. The efforts to calculate Roman consumption rarely make plain whose consumption they are measuring: most use wheat consumption data from soldier or slave rations, or an average derived from 4th-c.-BCE Attic production estimates, and therefore presumably a population just over subsistence that constituted the majority of the population.Footnote 126 The lists’ vastly different consumption levels may therefore simply be a result of these Vesuvian consumers not being at the hand-to-mouth end of the socioeconomic scale envisioned by these calculations, but rather being members of some kind of “middling” class.Footnote 127 The fact that the people from the lists support others such as slaves and pay food or other compensation to occasional workers might also indicate this higher economic level. Average consumption stands about 9–14 times greater than the minimum estimates for the slave from those lists, providing an internal comparison against bare-bones subsistence.
It has further been argued that the Vesuvian cities enjoyed a particularly high standard of living, due to both the fertility of the surrounding region and the proximity of the great port of Puteoli, which provided both imported grain to supplement local supply and other imported foodstuffs.Footnote 128 Therefore, even if the lists’ consumers were not necessarily of higher economic status, their good fortune in being denizens of the Vesuvian region would, by this argument, have allowed them to enjoy a more robust diet than, for example, peasants living inland. In short, the lists may document the consumption habits of a “plebs media”Footnote 129 or, alternatively, demonstrate the relatively high standards of living that even poorer Vesuvian residents enjoyed.
Scheidel and Friesen have extrapolated their income calculations (which are analogous to their estimates for consumption) to produce a widely cited model for income distribution among brackets of the nonelite population.Footnote 130 Their calculations provide a useful quantitative framework in which to not only situate these claims about a relatively more affluent Vesuvian population but also test the utility of the more abstract Roman consumption calculations against some actual consumption patterns. Scheidel and Friesen estimate the uppermost nonelite bracket as having incomes of around 1,260 HS per year. If we optimistically place our Pompeiian transients in this highest nonelite status, this number ought to represent their income. Instead, they are spending between 921 and 1,564 HS on food alone, which – if food is assumed to constitute around 50% of total expenditure – yields a total reconstructed income of some 1,842–3,128 HS. Even a possible higher cost of living in Pompeii, relative to that assumed in these calculations, cannot account for the difference because the wheat prices that lie at the heart of Scheidel and Friesen's model (ca. 3.3 HS/modius) are more or less those attested at Pompeii.Footnote 131
Part of the difference between Scheidel and Friesen's calculations and the list data may have to do with the role that cereals play in Roman consumption calculations. As we noted above, broad Roman consumption calculations, including Scheidel and Friesen's consumption and income models, are centered on wheat. Wheat serves two, albeit not always clear, functions in these calculations. In Hopkins's model, wheat is “a currency of cross-cultural comparison,” a signifier used as a means of producing historically comparable consumption estimates.Footnote 132 In Goldsmith's, Temin's, Maddison's, and Scheidel and Friesen's calculations, wheat ceases to be an equivalent and is actually meant to estimate the core consumption of a cereal-based diet, to which multipliers are added to account for other foods.Footnote 133 These and subsequent calculations assume that cereals constituted anywhere between 64% (Temin; Scheidel and Friesen) to 76% (Goldsmith; Maddison) of total dietary consumption.
Unlike the calculations above, which are based on ethnographic figures for caloric minima (Hopkins), Garnsey's Attic carrying capacity estimates (Temin, Scheidel), or wheat rations for slaves and soldiers (Maddison, Goldsmith), the Pompeiian lists describe a full range of foods actually consumed. What they lack in numbers – they represent only the partial consumption of some seven working people living above subsistence – they compensate for in describing a significant piece of a whole diet. That diet, as seen above, gives cereals a significant but less central role than envisioned in these calculations. Cereals (mostly wheat in the form of bread) account for on average only 30% of expenses – a third to a quarter of what is assumed in most of the above calculations – and perhaps some 30% of calories. The only person consuming the cereal-majority diet is the slave The multiday list frames his wheat-majority diet as a low point in fluctuating consumption amounts. For the other people, expenses and calories are more evenly distributed not only among the dietary tetrad of bread, wine, oil, and cheese but also by the frequent consumption of meat. If we accept that these lists comprise only a portion of the food consumed by these people, who may have been purchasing things such as fruit and puls elsewhere, the role of cereals might diminish even further.
As noted above, a significant archaeological dataset has already cast some qualitative doubt on the reality of a cereal-majority diet for both the Vesuvian cities and Roman Italy more generally. The Pompeiian lists suggest the quantitative impact such a revised diet might have on our understanding of Roman consumption more broadly. The argument here is not that all Romans consumed according to the patterns expressed by these lists. Instead, the value of the lists is to show that when we use actual consumption measurements with the full range of consumables, as opposed to notional or comparative ones, the results cast doubt on the utility of the wheat or cereal proxy. Were wheat simply a signifier, “a convenient tactic,” this might not matter.Footnote 134 Where it ceases to be notional and embeds assumptions about diet into gross consumption calculations, its numerical and heuristic utility only holds so long as cereals are a majority diet expense. One could increase the noncereal multipliers to compensate, but once these become twice or more the wheat value, the centrality of the cereal proxy becomes harder to defend.
Secondarily, the lists provide a glimpse of what living in a consumer-good-saturated society might mean for consumption patterns more generally. Consumer goods are assumed to be largely irrelevant in the broad consumption calculations, footnotes to consumption budgets dominated by food. Although the Pompeiian lists include only about 6% of expenditures on consumer goods – in part because of the nonhousehold location of their consumers – these provide only a very low end. Nick Ray's statistical studies on the contents of a range of somewhat wealthier Pompeiian households has shown not only that those consumption choices are complex but that even less-wealthy households consumed far more expensive types of goods – bronze and glass rather than ceramics – than has long been assumed.Footnote 135 The bronze situla and incense purchased by the small family in CIL IV 5380 are more likely to be the tip of a large consumer-goods iceberg, which, like the other consumption patterns revealed here, may be underrepresented in general consumption calculations.
In short, what distinguishes the notional Roman consumption calculations from those represented in these lists is the historical specificity of the latter, attesting to the fact that a significant portion of a whole diet actually consumed by 1st-c.-CE people in a specific place, together with a subset of nonfood expenses – consumer goods, support of dependents – is accounted for in the same way as food. The lists may or may not suggest that we have greatly underestimated Roman consumption. But they do suggest that both the variables and the constants in Roman consumption equations are in need of rethinking.
Finally, although the quantitative results from these lists reveal patterns of consumption useful for rethinking broader patterns, they are equally important for what they reveal about individual preferences and decision-making. The tiny CIL IV 5380 “family” consumed very little wine, dedicated most of its budget to bread and staples, and binged on a big feast four days before the Ides, for which they then seemingly had to compensate by literally eating bread and water. The person staying in the Large Palaestra, perhaps a trainer or other person associated with gladiators, consumed a prodigious quantity of wine, which accounted for many of his calories. The individual in CIL IV 4000, whose list is recorded inside a bakery, clearly has some kind of large domesticate (a donkey, horse, or cow) to which he or she is giving over the bulk of the recorded expenses to feed – an animal that represents labor, transportation, or both. The variety of these consumption strategies reminds us that the averages are composed of radically different people and choices. It is the praxis described in these lists – penny-pinching, boom-bust spending, the importance of consumer goods and nonstaples – from which we have the most to learn about what it meant to consume in the Roman world.
Acknowledgments
Thanks to John Bodel, Cam Grey, Nicolas Monteix, Tina Sessa, and Brent Shaw for the bibliography and/or comments on earlier drafts. Heikki Solin and Paula Caruso provided their photos of CIL IV 5380, and Dott. Massimo Osana and Dott. Gabriel Zuchtriegel of the Soprintendenza Archeologica di Pompeii kindly provided image permissions. The two anonymous JRA reviewers improved the final version enormously. Remaining errors are all my own.