Implications
Recent developments in livestock genomic research have shown that host genetics has a significant role in the spread of an infectious disease. Experimental plans powerful enough to quantify the genetic variation in disease resistance in most livestock species require field data that, however, is very noisy due to incomplete exposure or imperfect diagnosis. The current work has demonstrated the potential use of individual historical field disease data to set an alternative experimental case–control designs for the study of genetic associations with infectious diseases in livestock aiming to reduce noise in field data, using mastitis in cattle as case study.
Introduction
Control of major infectious disease in livestock remains challenging despite the detailed characterisation of the infectious agents associated with common diseases and the deciphering of their genome sequences (Tomley and Shirley, Reference Tomley and Shirley2009). Furthermore, recent developments in livestock genetic and genomic research have shown that host genetics had a significant role in the spread of an infectious disease within populations (Springbett et al., Reference Springbett, MacKenzie, Woolliams and Bishop2003; Lively, Reference Lively2010; Anacleto et al., Reference Anacleto, Garcia-Cortés, Lipschutz-Powell, Woolliams and Doeschl-Wilson2015).
Disease resistance is defined as the ability of the host to exert some degree of control over the pathogen life cycle (Bishop and Stear, Reference Bishop, Doeschl-Wilson and Woolliams2003; Bishop and Woolliams, Reference Bishop and Woolliams2014). Host genetic variation in infectious disease resistance is present for most diseases (Bishop, Reference Bishop2010) and its variability could be used in selection. Therefore, a genetic approach, aiming to improve disease resistance could be applied as a complement to existing control strategies (Davis et al., 2009). Improvements in animal genome sequencing technologies have led to the application of genomic selection in several countries and to the identification of regions of the genome associated to characters of economic interest (e.g. production and/or resistance to diseases in dairy cattle) (Lillehammer et al., Reference Lillehammer, Meuwissen and Sonesson2011). This dual consequence facilitates the incorporation of disease-resistant loci information into livestock breeding (Bishop and Woolliams, Reference Bishop and Stear2010).
Infectious diseases in livestock are likely to increase considerably production costs, as is the case for mastitis which may cost up to 2 billion €/year in Europe (http://www.sabre-eu.eu/). Therefore, it is important to select for disease-resistant animals and to decrease steadily the infectious pressure within and across herds through reducing the number of infected animals, which may be achieved by taking advantage of genomic selection programmes applied worldwide.
Experimental plans powerful enough to quantify the genetic variation in disease resistance in most livestock species require field data, as the number of individuals needed in this type of study is usually very high (e.g. Bermingham et al., Reference Bermingham, Bishop, Woolliams, Pong-Wong, Allen, McBride, Ryder, Wright, Skuce, McDowell and Glass2014; Neibergs et al., Reference Neibergs, Seabury, Wojtowicz, Wang, Scraggs, Kiser, Neupane, Womack, Van Eenennaam, Hagevoort, Lehenbauer, Aly, Davis and Taylor2014). Field disease data for genetic association studies are very noisy (Bishop and Woolliams, Reference Bishop and Stear2010; Bishop et al., Reference Bishop and Woolliams2012), however, due to incomplete exposure or imperfect diagnosis of infection. Incomplete exposure will occur when individuals test negative because they are sampled from low incidence (LI) herds where they have never encountered the infectious agent. Then, if ones carries out a standard case–control study with equal number of cases and controls balanced by sampling in the same herd, incomplete exposure of the controls in low prevalence herds will lower the power of detection of differences in allele frequencies of the resistant alleles between the two groups. Imperfect diagnosis is associated to the dynamic aspects of individual resistance over the entire time course of the disease, and especially when a recovery is possible, as for mastitis. In this case, the use of a single-point phenotypic measure will be little informative. A new phenotype should be defined to represent the disease status condition, based upon repeated measurements over the entire life cycle of the animal. Ideally, it should consider the dynamic aspects of the individual’s response over time as well as changes in performance with respect to variations in pathogen load in the host population (Doeschl-Wilson et al., Reference Doeschl-Wilson, Bishop, Kyriazakis and Villanueva2012). Both these noise factors added to a number of usual environmental sources of variation will decrease the power of the experimental plans, and could be at the basis of the lower heritability estimates, which probably have lowered the expectations raised in the past by the genetic approach to increase disease resistance (Bishop and Woolliams, Reference Bishop and Stear2010).
In order to both decrease the noise intrinsic to disease field data and to maximise the expression of individual genetic differences of disease resistance in a case–control study, case (affected) animals should be sampled from herds with LI of infection, whereas control (healthy) individuals should be chosen in herds with high incidence (HI) level (Bishop et al., Reference Bishop and Woolliams2012). Under this setting, incomplete exposure could be overcome from prior classification of herds before sampling individuals. Next, to reduce imperfect diagnosis, all historical information obtained from field data related to the disease should be used synthetically to take into account the dynamic aspects of individual and herd classification variation in time (Bishop et al., Reference Bishop and Woolliams2012).
The purpose of this work was to apply these concepts to the genetic study of resistance to mastitis. The incidence and costs of mastitis, along with the growing public concerns for animal welfare and for the use of antibiotics in farm animals, have made mastitis one of the major diseases of the dairy sector (Thompson-Crispi et al., Reference Thompson-Crispi, Atalla, Miglior and Mallard2014). The concentration of somatic cells per millilitres of milk, recorded routinely in dairy cattle (somatic cell count (SCC)=cells/ml) can be used as an indicator of intra-mammary infection (Reents et al., Reference Reents, Jamrozik, Schaeffer and Dekkers1995). The logarithmic transformation of the value of SCC, called somatic cell score (SCS) or linear score (LS), has a strong genetic correlation (~0.70) with clinical mastitis and has a heritability close to 0.15 (Rupp and Boichard, Reference Rupp and Boichard2003). Mastitis represents an interesting case study for situations where an endemic disease with systematic industry-wide repeated phenotyping is concerned.
In a previous study, a genome-wide scan for mastitis resistance was performed on a panel of Italian Holstein top sires using de-regressed estimated breeding values (EBVs) for SCCs. Results showed two chromosomal regions associated to resistance/susceptibility located on chromosome 6 (Bos taurus autosome (BTA6)) and on chromosome 14 (BTA14) (Minozzi et al., Reference Minozzi, Nicolazzi, Strozzi, Stella, Negrini, Ajmone-Marsan and Williams2011) and further details on the seven significant single nucleotide polymorphisms (SNPs) identified are given in this paper. The operational objective of the present study was to check if these SNPs could be detected through the epidemiologically based design described above using a cohort of Italian Holstein cows selected as case and control individuals, respectively, from herds with low and high mastitis incidence.
Furthermore, the effect of the above-mentioned seven SNPs as well as the association with two other markers located in DGAT1 (Winter et al., Reference Winter, Krämer, Werner, Kollers, Kata, Durstewitz, Buitkamp, Womack, Thaller and Fries2002), were discussed in relation with possible candidate genes.
Material and methods
Phenotypic data
Data were provided by the Lombardy Breeders Association (Milano, Italy) and comprised 980 725 monthly test-day of milk (kg/day) and SCCs from 29 535 primiparous (n=10 964) and pluriparous (n=18 571) Holstein cows. Records were collected from 179 herds and included calvings from 1998 to 2013. Only the first four lactations were used and records were retained if between 10 and 400 days in milk (DIM). A minimum of 10 test-days/cow were required and if a cow had more than two lactations only the last 22 test-days were retained (e.g. if a cow had three calvings only the last two calvings were retained). After editing the data set included 146 160 records from 7662 cows: 67 062 records for first parity (45.9%), 63 115 records for second parity (43.2%), 13 375 records for third parity (9.2%) and 2608 records for fourth parity (1.8%). To obtain a distribution that is closer to normal, SCC data were transformed to LS as follows (Ali and Shook, Reference Ali and Shook1980):
 $${\rm Linear \,\,Scores (LS)}\,{\equals}\,{\rm }\log _{2} {{{\rm SCC}} \over {100}}{\plus}{\rm }3$$
Edited data were used to estimate for each cow a LS value adjusted for a set of fixed and random effects fitting the following repeatability mixed model:
 $$\eqalignno{ Y_{{ijlmnopqrs}} \,{\equals}\,\mu {\plus}T\,D_{i} {\plus}HERD_{j} {\plus}CDIM_{l} {\plus}Y\,S_{m} &\cr {\plus}PARITY_{n} {\plus}AGE_{o} {\plus}bp\left( {{\rm MILK}} \right) &\cr {\plus}PE_{q} {\plus}SIRE_{r} {\plus}{\epsilon}_{{ijlmnopqrs}} & $$
where Y ijlmnopqrs is the test-day record of LS, µ the overall mean of edited records, T D i the fixed effect of test-day, HERD j the fixed effect of the herd, CDIM l the fixed effect for class of DIM (defined as 1 class for every 30 days, resulting in 14 classes), Y S m the fixed effect for year and season of calving, PARITY n the fixed effect for the parity effect, AGE o the fixed effect of age at calving and b p the regression coefficient associated with the fixed effect of milk yield (MILK). The random environmental effect between consecutive test-day records within each lactation of a cow was included in the term PE q . Population stratification was accounted for by including an uncorrelated sire (SIRE r ) random effect and ε ijlmnopqrs the residual error. The R software (http://cran.r-project.org) and the lmer function from lme4 package (Bates et al., Reference Bates, Maechler, Bolker and Walker2015) were used for all the data editing and analyses.
Next, a two-step procedure was used to identify HI v. LI herds and control and case animals, respectively, within the two herd types.
Herd classification was based on the percentage of animals that showed individual high or low mean SCC values. A value of 200 000 cells/ml was used as a threshold to identify a possible case of mastitis or suggest an ongoing bacterial infection (Bradley and Green, Reference Bradley and Green2005; Madouasse et al., Reference Madouasse, Browne, Huxley, Toni, Bradley and Green2012).
Using historical SCC herd data, herds with >30% of the animals averaging above 200 000 cells/ml were classified as HI herds. Then, herds with <30% of animals above the threshold, on average, were classified as LI herds. Of the entire data set, 69 and 50 herds were classified as HI and LI herds, respectively.
Subsequently, individuals to be included in the association study were selected from these herds, identifying animals with high adjusted LS (case animals) in LI herds and animals with low adjusted LS (control animals) in the HI herds. An adjusted LS threshold equal to 0 was used to cluster animals in case and control groups. If a cow from a LI herd had a positive adjusted LS value, she was included in the ‘case’ cluster, and if a cow from a HI herd had a negative adjusted LS value she was included in the ‘control’ cluster. The adjusted LS practically represents the actual performance of any cow, that is, adjusted for non-genetic effects. A more stringent threshold could have been used but it would have reduced the sample size, eventually affecting the genome-wide association study (GWAS) statistical power. Cows with the most extreme LS values from all 119 herds were included as much as possible but selecting half and full sibs within herd was avoided.
DNA extraction and genotyping
DNA extraction was carried out on all blood samples using the commercial kit QIAamp DNA Mini kit and blood (Qiagen, Hilden, Germany) using the specific protocol (DNA purification from blood or body fluids). The DNA extracted was quantified by Nanodrop (NanoDrop Technologies, Wilmington, DE, USA). Only samples with a quantity of DNA between 5 and 40 ng/µl and A260/A280 values between 1.7 and 1.9 were considered suitable for analysis. Nine markers were studied in the present work. Seven had been identified in the previous GWAS analysis and are shown in Table 1 (Minozzi et al., Reference Minozzi, Nicolazzi, Strozzi, Stella, Negrini, Ajmone-Marsan and Williams2011), and marker rs109234250 and marker rs109162116 were added because they are located within the DGAT1 gene.
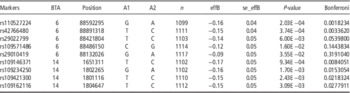
Results of the association analysis of nine single nucleotide polymorphism (SNP) on BTA6 and BTA14 tested in Holstein cattle

Marker=accession number of SNP as in the bovine 50 K SNP Chip panel; BTA=Bos taurus autosome; Position=position (bp) on Bovine Genome Assembly UMD 3.1.1.; n= number of animals tested for the specific marker; effB=effect of the minor allele (B allele); se_effB=standard error of the effect of the minor allele; P-value=raw significance level of association; Bonferroni=Bonferroni-corrected significance level.
The KBiosciences Competitive Allele-Specific PCR SNP genotyping system (KASPAR™; KBioscience Ltd, Hoddesdon, UK) was used to genotype the nine SNPs. KASPAR™ assays were developed to target nine genome-specific SNPs on BTA6 and BTA14, details of SNP position and chromosome are shown in Table 1. All assay primer sets were designed using PrimerPicker (KBioscience Ltd.) with default parameters. The genotyping assay was carried out on genomic DNA and read on a Real Time ABI7900 by means of an allelic discrimination assay according to the protocol specified by the manufacturer.
Association analysis
Association analysis was conducted using the R statistical environment with the ‘qtscore’ function of the package GenABEL (Aulchenko et al., Reference Aulchenko, Ripke, Isaacs and van Duijn2007). The response variable, namely the adjusted LS value, was analysed by fitting a single-SNP regression model. The significance of an association between a given SNP and the response was measured using a likelihood-based score test (Schaid et al., Reference Schaid, Rowland, Tines, Jacobson and Poland2002). In order to deal with multiple testing a Bonferroni correction was applied to uncorrected P-values. Bonferroni correction is used to change the threshold value (α)=0.05 against which the P-value is compared, into α/k (0.05/k) where k is the number of statistical tests performed.
Results
Results of the phenotypic analysis
Step 1: herd classification (high and low incidence herds)
On average, HI herds (n=69) had 40.7% of animals with high LS, with values ranging from 32.2% to 57.5%. In LI herds (n=50), the mean percentage of animals with high LS was 22.2%, with herd means ranging from 12.2% to 29.9%.
Step 2: selection of case–control individuals (case and control animals)
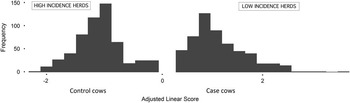
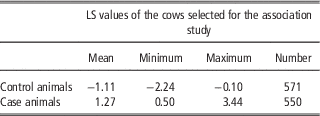
Control animals were selected within HI herds on adjusted LS values. After adjusting LS using model 1, its mean value in the control group was −1.11, ranging from −2.24 to −0.10. Their observed LS before adjustment ranged from 0.8 to 5 and the mean was 2.23. Case animals were selected from LI herds and showed a mean adjusted LS value of 1.27, ranging from 0.50 to 3.44 (Table 2), whereas their observed unadjusted LS values ranged from 2.09 to 6.7 with mean equal to 3.95. The distribution of the adjusted LS values of selected cows in HI and LI herds is shown in Figure 1.
Distribution of the adjusted linear score (LS) values of selected cows in high and low incidence herds. Case animals were selected in low incidence herds and control animals were selected in high incidence herds.

Adjusted linear score (LS) values of the case and control cow cohorts

Results of the Genotypic and association analysis
A total of nine SNPs were genotyped on 1121 samples (550 cases and 571 controls). Genotype efficiency ranged between 99.9% and 98.8%. Each SNP was considered significant at a threshold of α⩽0.05 after Bonferroni correction for the nine tests.
The results of the association analysis on five SNPs located on BTA6 and four SNPs located on BTA14 are shown in Table 1. Six out of the nine markers showed significant association with SCC expressed as adjusted LS. The association was significant for the four SNPs located on BTA14, with P-values ranging from 0.008 to 0.028 after Bonferroni correction, with the same minor allele showing the equal effect on the phenotype (−0.15) and both showing a similar standard error of the effect 0.05.
Only two out of the five markers on BTA6 were in association with the trait, namely markers rs110527224 and rs42766480 with P-values of 0.002 and 0.003, respectively (Table 1).
Discussion
When relying on the identification of resistant/susceptible animals under field conditions, the identification of significant markers may be difficult and validation is not always successful. Moreover, access to correct phenotypes and correction for environmental noise in disease field data may be somewhat limited when all animals are not routinely tested. However, for endemic diseases with phenotypes recorded on a regular basis, and if individual longitudinal data are available, as for mastitis, alternative approaches to reduce incomplete exposure can be applied. The synthetic phenotype for SCC developed in this work takes into account the dynamic aspects of the individual’s response or recovery over time as well as environmental and production effects and incomplete exposure through the prior step of classification into HI v. LI herds.
It is interesting to note that the present study with a cohort of 1121 cows selected in a two-step approach and a previous GWAS on a cohort of 1200 elite sires identified six (out of seven possible) common markers associated to mastitis. This convergence of results, however, is not always observed. For example, several GWAS on bovine paratuberculosis identified different chromosomal regions associated with infection with Mycobacterium avium. paratubercolosis (Gonda et al., Reference Gonda, Kirkpatrick, Shook and Collins2007; Settles et al., Reference Settles, Zanella, McKay, Schnabel, Taylor, Whitlock, Schukken, Van Kessel, Smith and Neibergs2009; Minozzi et al., Reference Minozzi, Buggiotti, Stella, Strozzi, Luini and Williams2010). Furthermore, these results extend and generalizes a previous validation of markers on BTA6 between 85.5 and 88.1 Mb, which were identified in GWAs on elite bulls and validated using logarithm transformed SCC measured in three lactations of cows from three German dairy farms similarly managed (Abdel-Shafy et al., Reference Abdel-Shafy, Bortfeldt, Reissmann and Brockmann2014).
The SNPs on BTA6 that were found in the Italian cow population are located in a region where several quantitative trait loci (QTLs) have been identified for mastitis traits (Lund et al., Reference Lund, Guldbrandtsen, Buitenhuis, Thomsen and Bendixen2008; Nilsen et al., Reference Nilsen, Olsen, Hayes, Nome, Sehested, Svendsen, Meuwissen and Lien2009; Sodeland et al., Reference Sodeland, Kent, Olsen, Opsal, Svendsen, Sehested, Hayes and Lien2011; Meredith et al., Reference Meredith, Berry, Kearney, Finlay, Fahey, Bradley and Lynn2013; Sahana et al., Reference Sahana, Guldbrandtsen, Thomsen and Lund2013; Abdel-Shafy et al., Reference Abdel-Shafy, Bortfeldt, Reissmann and Brockmann2014), and a similar association of SCS with rs42766480 has been identified in a study on American Holstein cattle (Cole et al., Reference Cole, Wiggans, Ma, Sonstegard, Lawlor, Crooker, Van Tassell, Yang, Wang, Matukumalli and Da2011). In addition, the analysis of EBV of progeny tested Nordic Holstein sires identified a region around 88.97 Mb on BTA6 of interest for several mastitis-related traits (Sahana et al., Reference Sahana, Guldbrandtsen, Thomsen and Lund2013). Likewise, QTL for clinical mastitis in a Norwegian Red cattle population have been identified in a region of chromosome BTA6 (Nilsen et al., Reference Nilsen, Olsen, Hayes, Nome, Sehested, Svendsen, Meuwissen and Lien2009) with a granddaughter design. This region on chromosome 6 includes the casein gene cluster and several genes thought to be involved in mastitis as the immunoglobulin J chain that is located at 87.75 Mb, close to the SNPs identified (Sahana et al., Reference Sahana, Guldbrandtsen, Thomsen and Lund2013) and the Mucin 7 gene located on BTA6 from 87 573 430 to 87 584 044 bp (Gene ID: 101905278). In particular, the Mucin 7 gene encodes an antimicrobial peptide that is involved in the mucosal immune system (Liu et al., Reference Liu, Rayment, Gyurko, Oppenheim, Offner and Troxler2000) making it a good candidate.
All four markers on BTA14 were associated to mastitis. Although both mastitis-related phenotypes, de-regressed EBVs for SCC and corrected LS, were corrected for milk production in the previous GWAS and in the present study, it is tempting to speculate that the four markers located in the region of the DGAT1 gene may be associated with mastitis through pleiotropy or indirect genetic selection. Indeed, the rs109162116 marker on the 3′UTR of the DGAT1 gene and rs109234250 in position 1802265 within DGAT1 are known to influence milk composition (Winter et al., Reference Winter, Krämer, Werner, Kollers, Kata, Durstewitz, Buitkamp, Womack, Thaller and Fries2002) and may have been indirectly selected for mastitis susceptibility. Both markers have been found to be significant in a genome scan for clinical mastitis in Nordic Holstein cattle, with effects showing same direction and standard error (Sahana et al., Reference Sahana, Guldbrandtsen, Thomsen and Lund2013). GWAS studies on bovine mastitis-related traits have also reported QTL affecting susceptibility to mastitis on chromosome 14 (Schulman et al., Reference Schulman, Viitala, De Koning, Virta, Maki-Tanila and Vilkki2004; Lund et al., Reference Lund, Sahana, Andersson-Eklund, Hastings, Fernandez, Schulman, Thomsen, Viitala, Williams, Sabry, Viinalass and Vilkki2007; Tiezzi et al., Reference Tiezzi, Parker-Gaddis, Cole, Clay and Maltecca2015) by using different populations and experimental plans.
In conclusion, this study has shown that results obtained through a GWAS on EBV for SCC from a population of elite sires were confirmed in a case–control approach with SCC field data from cows selectively chosen using individual and within herd epidemiological information. Most importantly, the current work has demonstrated the potential use of historical field disease data to set case–control designs for the study of genetic associations with infectious diseases in livestock, but further work would be needed to apply this procedure to other diseases. Of course, genetic studies for other infectious diseases may be more limited than for mastitis because availability of single or repeated individual phenotypic data may be lacking. Finally, while genomic information is widely accessible today, the most limiting step in extending the epidemiological approach to other diseases is the availability of longitudinal phenotypic data.
Acknowledgements
This work was funded by the MASTFIELD project no. 1745 of the Lombardy Region (Agricultural regional research program 2010–12). Massimo Battaglia and Lucio Zanini and ARAL Association are acknowledged for providing test-day records of all the animals used for this work.