I. INTRODUCTION
With the development of modern technology, the demand for oil and natural gas is increasing gradually. In the past several decades, the exploitation of the oil and natural gas has progressively extended to the deep sea area. Reference Zhou, Jia, Zhang, Liu and Misra1,Reference Cheng, Zhang, Li and Shen2 To improve the transmission efficiency, higher delivery pressure and larger diameter pipelines are often adopted. For the sake of transportation safety, there is an urgent need to develop ultra-high strength pipeline steels with good toughness. Reference Pouraliakbar, Khalaj, Nazerfakhari and Khalaj3
The thermal deformation behavior and the microstructure evolution of steels during the hot working process are usually complicated. To obtain an excellent combination of strength and toughness, it is important to control various parameters of the hot deformation process strictly. Reference Yang, Peng, Ren, Wen, Su and Xie4 In recent years, many scholars have done researches about the hot deformation behavior of ultra-high strength pipeline steels. Shahrani et al. Reference Shahrani, Yazdipour, Dehghan-Manshadi, Gazder, Cayron and Pereloma5 studied the effect of deformation temperature and strain rate on the dynamic recrystallisation (DRX) behavior of X70 pipeline steel. The examination of the microstructure shows that the DRX behavior of the investigated steel was dependent on the deformation temperature and strain rate, and the increasing deformation temperature and decreasing strain rate could lead to a more adequate proceeding of DRX. Qian et al. Reference Qian, Fang, Zeng and Wang6 investigated the hot deformation behavior of the API X100 pipeline steel. Results show that the stress approached the steady state when the strain reached 0.3. The constitutive equation of thermal deformation was determined. The estimated stress at 900 °C and the strain rate of 20 s−1 were consistent with the measured values. Quan et al. Reference Quan, Zhao, Chen, Wang, Mao, Lv and Zhou7 identificated the optimal working parameters of the as-extruded 42CrMo high-strength steel from a large range of strains, strain rates, and temperatures. The processing maps for investigated steel were plotted, and the microstructure evolution mechanism was also analyzed.
Precipitation of fine carbide particles during the thermal deformation plays a crucial role in improving the strength and toughness of ultra-high strength pipeline steels. Some studies focused on the precipitation behavior of carbides in pipeline steel during the hot deformation. Gomez et al. Reference Gomez, Valles and Medina8 investigated the evolution of the microstructure and precipitates during the mechanical process of an X80 micro-alloyed pipeline steel. They found that cuboidal TiN particles formed above 1150 °C, and spherical NbC precipitated between 900 and 1100 °C. The mean sizes of these two types of precipitates had no significant change after rolling at 870–1075 °C. Cao’s results Reference Cao, Xiao, Qiao, Zhang and Liao9 clearly show that the strain-induced precipitation behavior occurred during the thermal deformation process. The larger rich-Nb particles increased the peak stress and strain but could not influence the dynamic recrystallization due to the longer incubation period. However, the hot deformation behavior, microstructure evolution, and precipitation behavior of the Nb–V–Ti microalloyed ultra-high strength steel during hot compression were still not clear, which should be paid more attention.
Our previous studies have demonstrated that the experimental steel can obtain a good combination of strength and toughness after appropriate tempering and Q–P–T treatments. The mechanical properties of the experimental steel tempered at 600 °C for 1 h was investigated. The σb and σs could reach up to 1139 MPa and 1242 MPa, respectively. The Charpy impact properties at −40 °C was 30 J, and the reduction of area (Z) and elongation (E) of the specimens were 66% and 21%, respectively. Reference Dong, Zhou, Liu, Li, Liu and Guo10 A Q–P–T treatment with different partitioning times has been also applied to this steel. The effects of partitioning time on the microstructure and mechanical properties after Q–P–T were studied. When the partitioning time was 5 min, the volume fraction of the retained austenite in the specimen was 5.21%. The σb and σs were 1023 MPa and 1143 MPa, respectively. The Charpy impact property at −40 °C was 22 J, and the reduction of area (Z) and elongation (E) of the specimens were 57% and 21%, respectively. Reference Dong, Zhou, Liu, Li, Liu and Li11
The purpose of this research is to further investigate the hot deformation behavior of Nb–V–Ti microalloyed ultra-high strength steel. The microstructure evolution and precipitation behavior at different temperatures and strain rates were analyzed. The constitutive equation was established, and the thermal activation energy was also calculated. The processing map was developed based on the dynamic material model, which plays a guide role in optimizing the processing parameters of the investigated steel.
II. EXPERIMENTAL
The chemical composition of the experimental steel used in this investigation is given in Table I. The experimental steel in this work was prepared by sequential processes of melting in an electric furnace, continuous casting with argon shielding, and then hot piecing-rolling-stretching into a seamless steel tube. Cylindrical specimens were 8 mm in diameter and 12 mm in length, and the hot compression tests were performed using a Gleeble-1500 simulator (Dynamic Systems Inc., Poestenkill, New York) in the temperature range from 900 to 1200 °C with the interval of 100 °C. The total true strain applied was 0.6 and the strain rates used were 0.01, 0.1, 1, and 10 s−1. Prior to the compression, samples were heated at 10 °C/s to 1250 °C for 10 min and then cooled to the deformation temperature with the cooling rate of 30 °C/s. After deformation, the specimens were water quenched immediately to room temperature.
Chemical compositions of the experimental steel (wt%).

The microstructure was examined using optical microscopy (OM; OLYMPUS-BX51M, Olympus Corporation, Tokyo, Japan) and transmission electron microscopy (TEM; JEM-2000F JEOL Ltd., Tokyo, Japan). The specimens after deformation were sectioned along the axis of the compression direction, and the specimens for OM observations were etched at 70 °C for 6 min by a mixed solution of supersaturated picric acid. Specimens for the TEM microstructure examination were sliced to 300 μm thickness, mechanically polished to 50 μm, and then electrically thinned by a twin-jet polisher in a 7 vol% perchloric acid and 93 vol% ethanol solution. The morphology, size, distribution, and chemical composition of second phase particles were determined through examining carbon extraction replicas. The carbon coating of 250 Å was deposited in a vacuum system. The film was scored with a sharp blade to divide it into several smaller squares. Then, chemical etching in 7% Nital was conducted to remove the carbon film with the extracted carbides. Finally, the small films were mounted on copper grids for the TEM analysis. An image analyzer (Image Pro Plus 6.0 Media Cybernetics, Rockville, Maryland) was used to quantitatively analyze the sizes of grains and precipitates.
III. RESULTS AND DISCUSSION
A. True stress-true strain curves
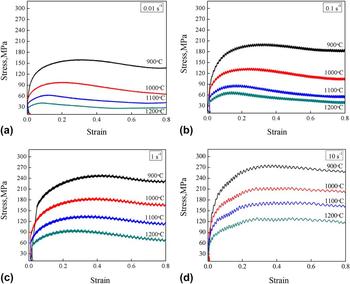
Figure 1 shows the true stress-true strain curves of the experimental steel deformed at different temperatures and strain rates. According to Ref. Reference Liu, Rong, Gao, Li, Liu and Wang12, a single peak flow curve is associated with the occurrence of dynamic recrystallization (DRX), while a constant flow stress is indicative of dynamic recovery (DRV). It can be easily observed that the investigated steel exhibited a representative DRX behavior, and the stress monotonous rose to a peak after the strain hardening, which was caused by the dislocation interaction and defects formed during the straining process. Reference Zhong, Li, Song, Liang and Guo13 With the increase of the strain rate, the dislocation tangles or defects in the matrix reached saturation gradually. The matrix could provide maximum resistance to deformation, and the flow stress reached a peak value. The peak represented the beginning of dynamic recrystallization and then the flow curve followed by the steady state. The steady state occurred when a new balance between the work hardening and the dynamic softening was reached. Reference Zhou, Liu, Zhou, Liu, Yu and Li14,Reference Liu, Guo, Li, Mei, Zhou, Huang and Li15
True stress-true strain curves at different strain rates: (a) 0.01 s−1; (b) 0.1 s−1; (c) 1 s−1; and (d) 10 s−1.

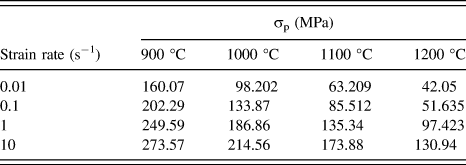
The peak stress at different strain rates and deformation temperatures are shown in Table II. It can be seen that the peak stress increased with the decrease of the deformation temperature and the increase of the strain rate. It is due to that higher temperature or lower strain rate could provide a longer time for energy accumulation. This energy could provide the conditions for the nucleation and growth of dynamic recrystallized grains and dislocation annihilation, and therefore the flow stress decreased. Reference Wu, Liu, Hu, Wang, Zhang, Tao and Liu16
The peak stress (MPa) of the samples under different conditions.

Under the higher strain rate of 10 s−1, the flow stress curves had fluctuations, as illustrated in Fig. 1(d). This is due to the existence of an alternation between dynamic softening and work hardening, which was caused by the rapid growth of grains at high temperatures and DRX. Reference Prasad, Sasidhara and Sikka17
B. Constitutive equation
In the research of hot deformation behavior of experimental steel, the constitutive equation is an important method to establish the relationship among deformation temperature, flow stress, and strain rate. The Zener–Hollomon parameter is widely used to describe the hot deformation behaviors of steel and can be expressed as follows Reference Mirzadeh, Cabrera, Prado and Najafizadeh18–Reference Kim, Lee, Lee and Yoo20 :
 $$Z = \dot \varepsilon \exp \left( {{Q \over {RT}}} \right)\quad ,$$
 $$\dot \varepsilon = A{\sigma ^{{n_1}}}\exp \left( { - {Q \over {RT}}} \right)\quad ,$$
 $$\dot \varepsilon = {A_2}\exp \left( {\beta \sigma } \right)\exp \left( { - {Q \over {RT}}} \right)\quad ,$$
 $$\dot \varepsilon = A{\left[ {\sinh \left( {\alpha \sigma } \right)} \right]^n}\exp \left( { - {Q \over {RT}}} \right)\quad ,$$
where A, α, n
1 are the material constants, R is the gas constant (8.314 kJ/mol), T is the absolute temperature (K), Q is the activation energy of hot deformation (J/mol),
 $\dot \varepsilon$
is the strain rate (s−1), and σ is the flow stress (MPa). The power function Eq. (2) can be used for lower stress (ασ < 0.8), the exponential function Eq. (3) is preferred for higher stress when ασ > 1.2, and the hyperbolic sine function Eq. (4) is suitable throughout the entire stress.
Reference Sellars and McTegart21
Peak stress, steady state stress, and stress under the specific strain can also be used to establish the constitutive equation.
Reference Li, Wang, Liang, Liu and Zhang22–Reference Zhang, Li and Wang24
Peak stress is usually chosen to estimate the Q value because the peak stress is more important for industrial production, and the steady state stress may not be obtained accurately.
Reference Huang, Zhang, Liu, Song, Geng and Wu25
In this research, the peak stress σp is brought into the above equations. α is a stress multiplier, and the value of α can be defined as
 $$\alpha = {\beta \over {{n_1}}}\quad ,$$
where β and n
1 are the average values of slopes obtained from the
 $\ln \dot \varepsilon$
− ln σ and
 $\ln \dot \varepsilon$
− σ as shown in Figs. 2(a) and 2(b), respectively. The β and n
1 values were evaluated as 0.0627 and 8.3871, and therefore α = 0.0075.
Linear relationships of (a) σp −
 $\ln \dot \varepsilon$
; (b) ln σp −
 $\ln \dot \varepsilon$
; (c) ln[sinh(ασ)] −
 $\ln \dot \varepsilon$
; and (d) ln[sinh(ασ)] − 1000/T.

For a particular strain rate, the activation energy can be obtained from the following relationship:
 $$Q = R{n_2}b = {\left| {{{\partial \ln \dot \varepsilon } \over {\partial \ln \left[ {\sinh \left( {\alpha \sigma } \right)} \right]}}} \right|_T}{\left| {{{\partial \ln \left[ {\sinh \left( {\alpha \sigma } \right)} \right]} \over {\partial \left( {{{1000} \mathord{\left/ {\vphantom {{1000} T}} \right. \kern-\nulldelimiterspace} T}} \right)}}} \right|_{\dot \varepsilon }}\quad ,$$
where n
2 is the average slope of
 $\ln \dot \varepsilon$
versus ln[sinh(ασ)] plots at various temperatures and b is the mean slope of ln[sinh(ασ)] − 1000/T plots at different strain stresses. Figures 2(c) and 2(d) show the linear fitting plots of
 $\ln \dot \varepsilon$
versus ln[sinh(ασ)] and ln[sinh(ασ)] − 1000/T, respectively. The average of n
2 and b can be estimated to be 5.784 and 8.3424, and the value of Q is evaluated as 407.29 kJ/mol.
 $$Z = A{\left[ {\sinh \left( {\alpha \sigma } \right)} \right]^n}$$
To determine the constitutive equation of investigated steel, the logarithm is taken on both sides of Eq. (7) to derive:
 $$\ln Z = \ln A + n\ln \left[ {\sinh \left( {\alpha \sigma } \right)} \right]\quad .$$
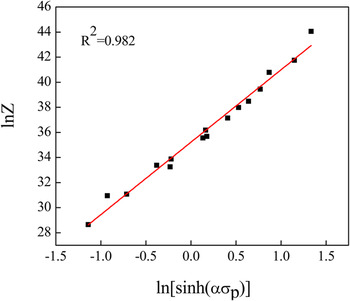
According to Eq. (8), the value of ln A and n can be determined by the intercept and the slope of ln Z versus ln[sinh(ασ)], as shown in Fig. 3. It can be observed that the correlation coefficient for the linear regression was 0.982, which indicates a good linear fitting for the experimental steel. The ln A and n were estimated as 35.21 and 5.773, and the value of A could be finally obtained to be 1.9566 × 10¹⁵. Therefore, the constitutive equation of the investigated Nb–V–Ti microalloyed ultra-high strength steel could be described as
 $$\dot \varepsilon = 1.9566 \times {10^{15}}{\left[ {\sinh \left( {0.0075{\sigma _{\rm{p}}}} \right)} \right]^{5.773}}\exp \left( {{{ - 407290} \over {RT}}} \right)\quad .$$
Plots of ln Z versus ln[sinh(ασ)] for experimental steel.

The deformation activation energy in the constitutive equation indicates the difficulty of deformation and implies the deformation mechanism of the experimental steel. Reference Zhao, Xu and Xu26 When the deformation activation energy is similar to the selfdiffusion activation energy, the diffusion or DRV softening mechanism is the main mechanism of hot deformation. When the deformation activation energy is much greater than the selfdiffusion activation energy, the dynamic recrystallization (DRX) plays a dominant role in hot deformation of the investigated steel. Reference Han, Liu, Zou, Liu and Qiao23 The deformation activation energy in the constitutive equation was 407.29 kJ/mol, which is much greater than the selfdiffusion activation energy of 272 kJ/mol for the pure Fe. Reference Mannan, Kostryzhev, Zurob and Pereloma27 It is believed that the dynamic recrystallization (DRX), originated dislocation slip or climb, is a main hot-deformation mechanism, Reference Zhu, Feng, Sun, Han and Zhou28 which is consistent with stress–strain curves.
In addition, the flow stress which can be expressed by the hyperbolic sine equation as a function of the Z parameter is given by Eq. (10) Reference Guo, Wang, Luo, Li, Chen and Su29 :
 $${\alpha _{\rm{p}}} = {1 \over \alpha }\ln \left\{ {{{\left( {{Z \over A}} \right)}^{{1 \over n}}} + {{\left[ {{{\left( {{Z \over A}} \right)}^{{2 \over n}}} + 1} \right]}^{{1 \over 2}}}} \right\}\quad .$$
The expressions for the peak stresses of investigated steel are shown as follows:
 $${\sigma _{\rm{p}}} = {1 \over {0.0075}}\ln \left\{ {{{\left( {{Z \over A}} \right)}^{0.1732}} + {{\left[ {{{\left( {{Z \over A}} \right)}^{0.3464}} + 1} \right]}^{{1 \over 2}}}} \right\}\quad .$$
Figure 4 shows the calculated peak stresses using Eq. (11) and experimental values of the peak stress. If all the points can be on a line with 45° to the X-axis, the equation is expected to be accurate. It is observed that most of the points are close to the prediction line, and the relative error of the calculated peak stress is less than 13%. The calculated values are in good agreement with the experimental results. It suggests that the constitutive equation can be used to accurately estimate the peak stress of the experimental steel.
Variation of the predicted flow stress with experimental flow stress for the investigated steel.

C. Processing map
Generally, the low strain and high temperature are beneficial to the microstructure reconstruction, and the low flow stress in the DRX may result in a low production efficiency and grain coarsening. While the high strain rate may generate an adiabatic temperature rise or strain hardening, resulting in the deformation failure or instable flow. Reference Kai, Chen, Sun, Wang and Zhao30 Based on the dynamic materials model, the hot processing map originally proposed by Raj Reference Fréour, Gloaguen, Francois and Guillén31 and developed by Prasad and Seshacharyulu Reference Prasad and Seshacharyulu32 is an effective method to evaluate the hot deformation process of metal materials. The hot deformation of experimental steels is a process of power dissipation, and the whole power dissipation can be divided into two parts Reference Prasad and Seshacharyulu33 :
 $$P = G + J = \int_0^{\dot \varepsilon } {\sigma {\rm{d}}\varepsilon } + \int_0^\sigma {\dot \varepsilon {\rm{d}}\sigma } \quad ,$$
where G is the power content, which is the power dissipated by the plastic work; J is the power co-content, which related to the microstructural evolution during deformation; σ is the flow stress (MPa); and
 $\dot \varepsilon$
is the strain rate (s−1). The strain rate sensitivity coefficient m can be calculated as follows:
 $$m = {{\dot \varepsilon {\rm{d}}\sigma } \over {\sigma {\rm{d}}\dot \varepsilon }} = {{{\rm{d}}J} \over {{\rm{d}}G}}\quad .$$
The dissipator co-content J can be defined as follows Reference Venugopal, Mannan and Prasad34 :
 $$J = {m \over {m + 1}}\sigma \dot \varepsilon \quad .$$
For a linear dissipation process, m = 1 and J = P/2. The efficiency of power dissipation η can be expressed as follows:
 $$\eta = {{2m} \over {m + 1}}\quad .$$
The criterion of continuous instability is established to determine the flow instability region in the form of Reference Prasad and Seshacharyulu33 :
 $$\xi \left( {\dot \varepsilon } \right) = {{\partial \ln \left( {{m \mathord{\left/ {\vphantom {m {\left( {m + 1} \right)}}} \right. \kern-\nulldelimiterspace} {\left( {m + 1} \right)}}} \right)} \over {\partial \ln \dot \varepsilon }} + m \lt 0\quad .$$
The variation of η and ξ with the strain rate and deformation temperature constitute the power dissipation map and the flow instability map, respectively. The processing map can be constructed by superimposing the flow instability map on the power dissipation map. ξ is the instable factor, and the experimental steel may exhibit a deformation instability phenomenon when the value of ξ is negative. The processing map can be used to optimize the processing parameters during the hot deformation process.
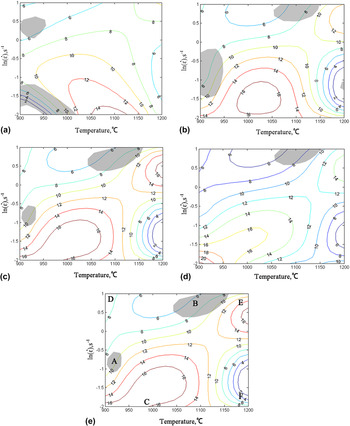
With calculation and analysis, the processing maps of the investigated steel deformed at strains of 0.2, 0.4, 0.6, and 0.8 were established as shown in Figs. 5(a)–5(d), respectively. The different color contours indicate the efficiency of power dissipation, and the shaded domains represent the flow instability zones. The values of η slightly increased as the strain increased, and the instability region decreased with the increase of the strain. It can also be observed that these maps demonstrated a similar characteristic, where flow instability occurred at lower temperatures and higher strain rates.
Processing maps for the experimental steel at a true strain of: (a) 0.2; (b) 0.4; (c) 0.6; (d) 0.8; and (e) the processing map indicating different deformation regions with a true strain of 0.6.

At the strain of 0.6 in Fig. 5(e), six domains (A–F) were observed at the deformation temperature range from 900 to 1200 °C with strain rates from 0.01 to 10 s−1. Figure 6 shows the typical microstructure of experimental steel deformed at different deformation conditions. According to Figs. 6 and 7, these six domains can be divided into three major classifications.
-
(i) Flow instability zone. At the strain of 0.6, the flow instability zones appeared in two regions. One was at the deformation temperature around 900 °C and the strain rate was about 0.1 s−1 (A zone); the other one was at the deformation temperature at about 1100 °C and the strain rate was around 10 s−1 (B zone) as covered by gray color in Fig. 5(e). Figures 6(a) and 6(b) represent the microstructures of the instability zone A and B in the processing maps, respectively. In Fig. 6(a), it can be seen that the grains of the A zone in the processing maps were elongated, and only a few recrystallized grains were observed as indicated by the black arrows. This means that the softening mechanism of the A region was mainly a dynamic recovery. As illustrated in Fig. 6(b), there are some recrystallized grains observed, especially in the shear zone as marked by the black arrows. This means that the DRX was incomplete in domain B. Therefore, these instability regions should be avoided during hot deformation.
-
(ii) Unsafe zone. In region D (900 °C, 10 s−1) with a relatively high strain rate, the deformation time is too short to dissipate heat. The temperature increased with a localized plastic flow resulting in the formation of shear bands and cracks in the shear planes. Reference Ning, Guo, Cao, Wang, Li and Sun35 Some recrystallized grains around original grain boundaries and shear bands as pointed out by the black arrows are shown in Fig. 6(c). This means that the DRX is incomplete in domain D and a mixed grain microstructure was obtained. In the F zone, larger dynamic recrystallization grains formed due to the high temperature and low strain rate. The microstructure of the domain F deformed at 1200 °C and 0.1 s−1 is shown in Fig. 6(d). In this region, the size of the dynamic recrystallization grain coarsened significantly. This can be attributed to the reason that recrystallized grains at high temperatures had a large driving force for nucleation and growth. Reference Kong, Chang, Li, Xie and Zhu36 Thus, D and F domains are also considered to be unsafe. Based on the above analysis, these hot deformation conditions should be avoided for the investigated steel.
-
(iii) Safety zone. Domains C and E are the stable zones with a peak efficiency of power dissipation at about 16%. Karami et al. Reference Karami and Mahmudi37 clearly showed that a higher η value means that the material dissipates more energy through the microstructure evolution, such as DRX. The DRX process is regarded as the best deformation mechanism and provides a stable flow stress and produces fewer defects. Figures 6(e) and 6(f) show the typical microstructures of safety zones C and E. Both small equiaxed grains along the grain boundaries and uniform grain are observed under these two deformation conditions. These features imply that the DRX occurs completely. Therefore, domains C and E are considered as the safe region for hot deformation.
Optical micrographs of the investigated steel deformed at (a) 900 °C/0.1 s−1; (b) 1100 °C/10 s−1; (c) 900 °C/10 s−1; (d) 1200 °C/0.1 s−1; (e) 1000 °C/0.01 s−1; and (f) 1200 °C/10 s−1.

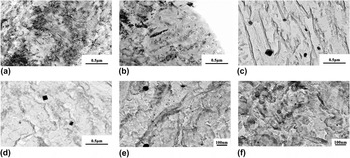
Optical micrographs and the TEM micrographs of specimens deformed at 1200 °C with the strain rate of (a), (e) 0.01 s−1; (b), (f) 0.1 s−1; (c), (g) 1 s−1; and (d), (h) 10 s−1.

D. Microstructure evolution
The effect of the strain rate on the microstructure evolution at the deformation temperature of 1200 °C is shown in Fig. 7. It can be seen from Figs. 7(a) to 7(d) that the average grain size decreased with increasing the strain rate. The average grain size of the investigated steel under different strain rates were about 91.17, 58.70, 30.67, and 22.73 μm, respectively. DRX started at the grain boundaries with a high dislocation density, where it had high stored energy. Enhancing the strain rate can increase the work hardening rate, which is beneficial for the recrystallization. In addition, more dislocations were produced. Reference Xiao, Huang and Liu38 With the increase of strain rate, the dislocation and energy caused by work hardening increased, while the time for the growth of grains decreased simultaneously. Therefore, the grains became finer when the strain rate increased from 0.01 to 10 s−1.
To further analyze the microstructure evolution during the DRX process, the TEM micrographs of samples deformed under different strain rates at 1200 °C are shown in Figs. 7(e)–7(h). All microstructures exhibited a typical martensite structure. With the increase of the strain rate, the width of the martensite lath decreased, and the dislocation (as pointed by black arrows) density increased gradually. The average width of the martensite lath under different strain rates were about 178.45, 134.48, 109.52, and 87.60 nm, respectively.
E. Precipitation behavior
Figure 8 illustrates the TEM micrographs of precipitates in the specimens deformed at different deformation conditions. Considerable amount of needle-like precipitates, the square or rectangular precipitates, and nanosized spherical shape particles can be observed from the samples. In the previous works, Reference Yang, Peng, Ren, Wen, Su and Xie4,Reference Shahrani, Yazdipour, Dehghan-Manshadi, Gazder, Cayron and Pereloma5 it has identified the crystal structure of these three types of particles. The needle-like precipitates (orthorhombic) could be identified as M3C carbides and rich in Fe with a small amount of Mn and Cr. The PDF number is 35–6772, α = β = γ = 90°, and a = 5.091 nm, b = 6.743 nm, and c = 4.526 nm. The other two types of precipitates are both f.c.c cubic structures with α = β = γ = 90°. The square or rectangular larger precipitates (PDF: 65-7931) were rich-Ti MC carbides, mainly containing Ti with minor Nb and V, and a = b = c = 4.225 nm. The smaller spherical precipitates were rich-Nb MC carbides, mainly containing Nb with minor Ti and V. The PDF number is 47–1418 and a = b = c = 4.427 nm. The differences in morphology and composition can be attributed to different nucleation temperatures of the precipitates. M3C carbide is one type of precursor carbide precipitated during the early period of self-tempering. Reference Zhou, Liu, Yu, Liu and Li39 Some investigations Reference Lee, Hong, Park and Park40 reported that the larger rich-Ti MC formed in the austenite region had a K–S relationship with austenite and the small rich-Nb MC carbides were formed in the ferrite region and satisfied the B–N relationship with ferrite.
The TEM micrographs of M3C carbides, rich-Ti MC, and rich-Nb MC precipitates deformed at 1200 °C with a strain rate of (a), (c), and (e) 0.01 s−1; (b), (d), and (f) 10 s−1.

As demonstrated in Fig. 8, the amount of precipitates decreased with the decrease of strain rates. Furuhara et al. Reference Furuhara and Maki41 reported that dislocations, grain, and subgrain boundaries can act as the nucleation sites for carbides. With the increase of the strain rate, the stress value in unit time increased gradually. The stress applied during the deformation steps gives rise to an increase in the dislocation density. Reference Gomes, Menina and Valles42 As shown in Fig. 7 above, the average grain size decreased with increasing the strain rate; furthermore, the number of grain boundaries in the unit volume subsequently increases. The rise in the strain rate leads to an increase in the number of available sites for the nucleation of carbides. Thus, the amount of carbides increased with the increasing strain rate. Meanwhile, the size of carbides also decreased gradually with the increase of the strain rate. With the increase of the strain rate, the standing time of samples at relatively high temperatures decreased gradually. Carbides could not grow adequately, and therefore, the size of carbides decreased with the increase of the strain rate. The average length of M3C at different strain rates were 97.77 and 65.33 nm, the rich-Ti MC had an average dimension around 70.52 and 58.74 nm, and the rich-Nb MC had an average diameter about 8.67 and 5.34 nm when the strain rates are 0.01 s−1 and 10 s−1, respectively, as shown in Fig. 8.
Prikyl et al. Reference Prikryl, Kroupa, Weatherly and Subramanian43 suggested that the stable TiN particles were the most effective microalloyed precipitation particles to retard the grain growth. On the other hand, other investigations indicated that Nb (C,N) had a dominant role in inhibiting the growth of austenite grains, compared to TiN. Reference Alogab, Matlock, Speer and Kleebe44 Fu et al. Reference Fu, Wang, Wang and Shan45 reported that niobium is the most effective microalloyed element to refine the final grain structure. In the previous work, Reference Alogab, Matlock, Speer and Kleebe46 the pinning effect of Nb-rich MC was much larger than that of Ti-rich MC, and therefore, it can be concluded that fine Nb-rich MC plays a leading role in controlling the grain growth behavior. Fernández et al.’s Reference Fernández, Uranga, López and Rodriguez-Ibabe47 research also indicates that Nb had an effect stronger than that of Ti in retarding DRX in the Nb–Ti steel.
As observed above, the amounts of Nb-rich MC increased and the average sizes of the Nb-rich MC decreased gradually with the increasing strain rate. It can be observed from Fig. 1 that the peak stress increased with the increasing strain rate under the same temperature condition. The increase in the amount of finer Nb-rich MC plays a more retarding effect on the dynamic recrystallization. Therefore, the peak stress increased with the increasing strain. The increase in the amount of Nb-rich MC could also play a stronger pinning effect on the recrystallized grains; thus, the size of the dynamically recrystallized grain decreased gradually with an increase in strain rates. It can be concluded that the decrease of carbides size after hot deformation at a higher strain rate could lead to a refinement of the recrystallization grain.
IV. CONCLUSIONS
The hot deformation characteristics and microstructural evolution behavior of Nb–V–Ti microalloyed ultra-high strength steel were investigated. The following conclusions have been drawn from this investigation:
-
(1) The peak stress increased gradually with increasing the strain rate and decreasing the deformation temperature.
-
(2) The activation energy of hot working was about 407.29 kJ/mol, and a constitutive equation was derived on the basis of true stress-true strain curves as following:
 $\dot \varepsilon = 1.9566 \times {10^{15}}{\left[ {\sinh \left( {0.0075{\sigma _{\rm{p}}}} \right)} \right]^{5.773}}\exp \left( {{{ - 407290} \over {RT}}} \right)$
.
-
(3) According to the processing maps constructed, two instability domains were located in the (900 °C, 0.1 s−1) and (1100 °C, 10 s−1) when the strain was 0.6. Two unsafe zones are (900 °C, 10 s−1) and (1200 °C, 0.01 s−1). The hot working of the material should avoid these instability regions. Two safe regions with a relatively high power dissipation efficiency were located in (1000 °C, 0.01 s−1) and (1200 °C, 10 s−1).
-
(4) The grain size of experimental steel decreased with the increase of the strain rates. M3C, rich-Ti MC, and rich-Nb MC were identified. The amount of three types of carbides gradually increased, while the size of carbides gradually decreased with the increase of the strain rates.

ACKNOWLEDGMENTS
The authors are grateful to the National Nature Funds for Distinguished Young Scientists of China (Granted No. 51325401), the National Magnetic Confinement Fusion Energy Research Project (Granted No. 2015GB119001), and the National Natural Science Foundation of China (Granted Nos. 51474156 and U1660201) for grant and financial support.