





Fermented foods and beverages have been part of traditional diets across the globe for centuries. People have long relied on them not only for preserving food but also for their distinctive flavours and cultural significance(Reference Tamang, Cotter and Endo1). In recent years, they have attracted renewed scientific and public health interest due to their potential nutritional and health benefits(Reference Kaur, Kaur and Ali2–Reference Valentino, Magliulo and Farsi4). Those are primarily attributed to functional compounds produced during microbial fermentation, such as organic acids, bioactive peptides, bacteriocins, exopolysaccharides, amino acid derivatives and vitamins(Reference Keyvan, Adesemoye and Champomier-Vergès5–Reference Şanlier, Gökcen and Sezgin7). These foods, produced by the metabolic activity of microorganisms, can enhance nutrient bioavailability, support gut and metabolic health and mental health(Reference Balasubramanian, Schneider and Gunnigle8). Moreover, they may introduce live microbes that could exert probiotic-like effects(Reference Marco, Heeney and Binda9–Reference Shah, Tarfeen and Mohamed11). Emerging evidence also suggests that fermented foods may contribute to gut microbiome diversity, immune modulation and metabolic regulation, although mechanistic insights and clinical validation remain limited(Reference Rul, Béra-Maillet and Champomier-Vergès12).
The global diversity of fermented products is well documented, ranging from dairy and cereal-based foods to fermented vegetables, legumes and beverages(Reference Cuamatzin-García, Rodríguez-Rugarcía and El-Kassis13,Reference Tamang, Watanabe and Holzapfel14) , reflecting their cultural and nutritional significance. These differences reflect not only culinary heritage but also the influence of local agricultural systems, highlighting the nutritional and sociocultural importance of fermented foods(Reference Lee, Ahn and Son15,Reference Santa, Huch and Stoll16) . European fermented food traditions demonstrate substantial regional diversity with marked variation in product types, preparation methods, consumption frequency and portion sizes(Reference Ashaolu, Varga and Greff17–Reference Papademas, Laranjo and Syrpas20).
Despite their prevalence, comprehensive data on the consumption patterns of fermented foods across Europe remain scarce. Existing studies typically concentrate on specific food types or on the consumption patterns of individual countries(Reference Ashaolu and Reale21–Reference Praagman, Dalmeijer and van der Schouw24), limiting the ability to assess broader trends and demographic influences. Moreover, the lack of standardised definitions, variation of serving sizes and regulatory frameworks for fermented foods complicates research reproducibility and consumer transparency(Reference Caffrey, Perelman and Ward25). Large-scale European studies, such as the European Prospective Investigation into Cancer and Nutrition (EPIC) InterAct study(Reference Sluijs, Forouhi and Beulens26), apply standardised dietary assessment methods, but to date, have captured only limited characteristics of fermented foods required for a comprehensive classification across all major food groups. This gap hinders efforts to develop evidence-based dietary guidelines and to conduct robust nutritional epidemiological research on the associations between fermented food intake and health outcomes.
Traditional FFQ and national nutrition surveys often fail to capture the full diversity of fermented products or omit, for example, less conventional but increasingly relevant plant-based alternatives(Reference Park and Bae27). Moreover, many previous studies have relied on FFQ with limited definitions of fermented foods, potentially overlooking major food items consumed by the target populations. For instance, a recent study in Japan(Reference Fujihashi and Sasaki28) demonstrated the complexity of identifying and quantifying fermented foods, including partially fermented products, highlighting their substantial contribution to energy and nutrient intake. Overall, these findings indicate the need for a more comprehensive and standardised approach to assessing fermented food consumption.
To address this critical gap, we developed the Fermented Food Frequency Questionnaire (3FQ) under the Promoting Innovation of Fermented Foods (PIMENTO) COST Action(29,Reference Magriplis, Smiliotopoulos and Myrintzou30) . The 3FQ is the first tool specifically designed to assess habitual consumption of a broad range of fermented food categories across multiple European countries and incorporates country-specific food examples within standardised food group classifications and validated portion-size photographs, enabling cross-regional comparisons while accounting for local dietary traditions. It has been validated for repeatability and relative validity using a representative sample from four European regions(Reference Magriplis, Smiliotopoulos and Myrintzou30). In summary, repeatability assessment (n 2315, ∼6 weeks apart) demonstrated strong to very strong Spearman correlations (0·6–0·8) for most fermented food groups across all four regions, with intra-class correlation coefficients indicating moderate to excellent reliability. Relative validity was assessed against 24-h dietary recalls using the automated multipass method. Bland–Altman analysis revealed excellent agreement (>90 % within the limits of agreement) for most food groups, with particularly strong performance for fermented dairy products, coffee and bread categories (>95 % agreement). Validation was more limited for infrequently consumed items such as fermented fish(Reference Magriplis, Smiliotopoulos and Myrintzou30). Using the 3FQ, we assessed consumer prevalence and intake among consumers for fifteen fermented food groups across four European regions as defined by EuroVoc(32). The present study aims to characterise fermented food consumption patterns among European populations, identify regional differences across major food groups and examine the independent variation in consumer prevalence and intake.
Materials and methods
Study population and data collection
The current study is based on cross-sectional survey data collected using an online version of the 3FQ from adults residing in European countries between October 2023 and May 2024, conducted under the PIMENTO COST Action CA20128 framework. The questionnaire was initially developed in English by experts in food science and technology, nutrition, nutritional epidemiology and consumer science. It was translated into twenty-seven other languages by National Contact Points from participating countries using a standardised back-translation methodology. The study received approval from the Ethics Committee of the Agricultural University of Athens (27/05.05.2023) and adheres to the principles of the Declaration of Helsinki regarding research with human participants(Reference Shrestha and Dunn33). The study targeted representative samples per European region, with a minimum of 1536 per region, as per the STEP process (total N 6144), stratified by sex and age group (18–49·9 years and ≥50 years). The European regions targeted included: Western Europe: Austria, Belgium, France, Germany, Ireland, Liechtenstein, Luxembourg, Andorra, Monaco, Netherlands, UK, Switzerland; Northern Europe: Estonia, Finland, Faroes, Iceland, Latvia, Lithuania, Norway, Denmark, Sweden; Central and Eastern Europe: Albania, Armenia, Azerbaijan, Georgia, Hungary, Poland, Romania, Bulgaria, Belarus, Bosnia and Herzegovina, Croatia, Kosovo, North Macedonia, Montenegro, Moldova, Slovakia, Czechia, Russia, Serbia, Slovenia and Ukraine; Southern Europe: Gibraltar, Greece, Italy, Malta, Portugal, San Marino, Türkiye, Holy See, Cyprus, Spain as defined by the EuroVoc(32). All participants were asked to provide informed consent via a General Data Protection Regulation-compliant platform (Conjointly, https://conjointly.com) prior to data collection. Eligible participants were adults aged 18 years or older, residing in European countries included in the four EuroVoc regions, who provided informed consent before completing the web-based 3FQ. Individuals younger than 18 years, those unable to provide informed consent and those not providing the minimum information required for inclusion in the survey were not eligible. No exclusions were applied on the basis of sex, BMI, education, health status, chronic disease or fermented food consumption status. Participants who did not consume a specific fermented food group were retained in the study and were directed to the next relevant section of the questionnaire. For the weighted analyses, observations without sufficient regional information to allow assignment of population weights were excluded.
The data used in the current analysis were fully anonymised, as no IP addresses or other contact details were included in the database. The details of the development, implementation and validation of the 3FQ have been previously reported(Reference Magriplis, Smiliotopoulos and Myrintzou30,Reference Magriplis, Kotopoulou and Adamberg31) . Briefly, the core study sample comprised 12 646 participants from fifty-three countries, distributed across the four European regions: Northern Europe (n 9), Southern Europe (n 10), Central and Eastern Europe (n 22) and Western Europe (n 12). Participants were recruited via the PIMENTO website, social media platforms and email invitations, using convenience sampling and snowball sampling. The recruitment strategy aimed to achieve a minimum of 1536 participants per European region, calculated using the WHO STEPwise approach for a 5 % margin of error, 80 % power and 95 % confidence level, stratified by sex and age group (18–49·9 and ≥50 years)(Reference Magriplis, Kotopoulou and Adamberg31). To address potential under-representation in specific demographic strata, supplementary panel-based sampling via the Conjointly platform was employed when quota targets were not met through organic recruitment. This study was designed as a descriptive cross-sectional analysis. The primary objective was to estimate and compare reported intake of fifteen fermented food groups across European regions; the analyses were not designed to assess individual-level health effects or causal associations.
Assessment of the consumption of fermented foods
The 3FQ was developed to map the frequency and quantity of fermented food consumption across European regions, covering a diverse range of food categories, including fifteen primary groups with multiple subcategories for each main group. In this study, ‘fermented food consumption patterns’ refers to descriptive population-level distributions of fermented food intake, including consumption prevalence, frequency, quantity and variation across European regions and participant characteristics. No empirically derived dietary pattern analysis, such as principal component analysis, factor analysis or cluster analysis, was performed. These groups included plant-based meat and/or dairy alternatives; fermented dairy products; fermented pulses and legumes; fermented meat and/or fish products; fermented vegetable products; fermented cereal products; chocolate; fermented non-alcoholic beverage products; vinegar; coffee; fermented tea; cocoa beverages; beer or cider; wine and strong spirits. A screening, yes/no consumption question was primarily asked for each main fermented food group. If the response was positive, details on the frequency and quantity of subcategories within each food group followed. The screening question was used for two reasons: (i) to decrease response burden and move to the next food group if one was not consumed and (ii) to assess participants’ awareness of actual fermented foods per food group, using specific examples. Frequency of consumption for each food group was defined using predetermined categories. The full frequency scale included eight categories: ‘Never’, ‘Rarely’, ‘Monthly 1–2 times’, ‘Weekly 1–2 times’, ‘Weekly 3–6 times’, ‘Daily 1 time’, ‘Daily 2 times’ and ‘Daily more than 2 times’. Most questions used these eight response options, while for less frequently consumed foods, six options were provided. Specifically, six categories were used for cereals and most beverages, ending at ‘Daily’.
To increase accuracy and consistency in dietary reporting, the questionnaire incorporated portion-validated food pictures, enabling participants to visually estimate and select the portion sizes that most closely represent their usual intake. Images were selected in consultation with nutrition professionals and, where possible, were aligned with data population intakes from national surveys. Each image was catalogued in a database linking visual cues to specific portion weights and standard household measures. Participants were asked to indicate the portion size most representative of their typical consumption, thereby minimising measurement errors and improving data reliability. Details of the 3FQ derivation can be viewed in the published protocol(Reference Magriplis, Kotopoulou and Adamberg31). Daily intake (g or ml/day) was calculated by multiplying the midpoint of each frequency category by the corresponding portion size (g). Frequency midpoints were Never = 0; Rarely = 0·03/day; Monthly 1–2 times = 0·05/day; Weekly 1–2 times = 0·21/day; Weekly 3–6 times = 0·64/day; Daily one time = 1·0/day; Daily two times = 2·0/day and Daily more than two times = 3·0/day. Weekly intakes were derived by multiplying daily values by 7.
Demographic, anthropometric and health data
The first part of the 3FQ collected general demographic information and self-reported anthropometric data. The participants’ educational levels were categorised according to international education standards (International Standard Classification of Education). These included four categories: Primary (>6 years); Secondary (≥6–12 years); Bachelor’s University and Postgraduate (MSc/PhD). Employment status was classified according to the Eurostat/International Labour Organisation labour force status standards. Specifically, participants were categorised as: employed full-time, employed part-time, not employed but a student, retired, unemployed or a homemaker. Reported weight and height were used to calculate participants’ weight status using BMI = weight (kg)/height2 (m2). Participants were then categorised according to the WHO criteria(34) (BMI < 18·5 indicates underweight; BMI 18·5–24·9 indicates normal weight; BMI ≥ 25·0–29·9 indicates overweight; BMI ≥ 30·0 indicates obesity). Information on marital and smoking status was also collected, along with questions about health status (including any chronic conditions and comorbidities), as these factors may affect knowledge and behaviour regarding fermented food consumption. These variables were used to describe the study population and to evaluate potential heterogeneity in reported fermented food intake.
Participants were also asked to report whether they had a background in nutrition or food science. Sensitivity analyses were conducted to assess differences in consumption patterns between the total population and the population after excluding participants with a background in nutrition or food science.
Data analysis
The population sample for the current study was adjusted to match the actual population sizes in each European region, with post-stratification weights across European regions, sex and age groups to achieve comparability with the population structure. Post-stratification weights were calculated using Eurostat population data for each European region, stratified by sex and age group, yielding eight strata per analysis dimension. Weights were applied to all descriptive and inferential analyses to improve representativeness and correct for differential non-response(Reference Henry and Valliant35). Observations were excluded from the analysis when regional population data were missing, preventing the assignment of weights. Socio-demographic characteristics and data on individual health conditions, as well as fermented foods consumption data, were presented using a survey design analysis weighted by European region, as determined by the sampling structure and the latest population census. Categorical variables were presented proportionally to each region’s population. Pearson χ 2 tests were performed to determine differences in regional distributions. Continuous variables were checked via P-P and k-density plots to determine whether they follow normal or skewed distributions and are presented as mean ± sd and as median and range (25th, 75th percentiles), respectively. Between-group differences were tested using ANOVA or the Kruskal–Wallis test for parametric and non-parametric continuous variables, respectively. Heatmaps were generated to depict consumption patterns, and the prevalence of low-to-moderate and high responses, along with corresponding intakes, was derived and compared. Analyses were descriptive and conducted at the group or regional level. Subgroup summaries were therefore interpreted as descriptive differences in reported intake. Significance for all analyses was set at p < 0·05. Database cleaning and statistical analysis were performed using Stata 18.0 (StataCorp, Texas Ltd.).
Results
Study population demographics
The socio-demographic and anthropometric characteristics of the study population by European Region are summarised in Table 1. Detailed characteristics of the study population by sex and age group are presented in Supplementary Materials, Tables S1 and S2, respectively. The total sample comprised 12 646 participants from fifty-three European countries across the four EuroVoc regions: Northern Europe (n 2315), Central-Eastern Europe (n 5185), Western Europe (n 2577) and Southern Europe (n 2569). Weighted values were applied to derive all results, and statistical analyses indicated significant differences between regions for all socio-demographic and health variables reported (Table 1). The median age ranged from 39 to 45 years, with the lowest median observed in Central-Eastern Europe and the highest in Northern Europe. Despite variations in sex distribution, women were the most prevalent respondents across all regions. Self-reported health status also differed significantly by region. The proportion of participants reporting no chronic condition was lowest in Northern Europe (58·4 %) and highest in Western Europe (74·0 %), while reporting two or more chronic conditions was most frequent in Northern Europe (13·6 %) compared with Southern Europe (8·6 %), Central-Eastern Europe (5·8 %) and Western Europe (5·8 %) (p < 0·001). Self-reported cardiometabolic diagnoses also varied regionally, with the highest prevalence in Northern Europe (27·1 %), followed by Southern Europe (21·4 %), Central-Eastern Europe (18·2 %) and Western Europe (11·9 %) (p < 0·001).
Socio-demographic and anthropometric characteristics in the study population by European region, as depicted in the 3FQ 1

Table 1. Long description
The table presents socio-demographic and anthropometric characteristics of a study population across four European regions: Northern Europe, Central-Eastern Europe, Western Europe, and Southern Europe. It includes data on 12646 participants from fifty-three European countries. The table has 32 rows and 10 columns, with column headers including ‘Characteristic’, ‘European region’, ‘Northern Europe (n 2315)’, ‘Central-Eastern Europe (n 5185)’, ‘Western Europe (n 2577)’, ‘Southern Europe (n 2569)’, and ‘p’. Row labels include characteristics such as age, sex, BMI, educational level, employment status, marital status, smoking status, scientific background on food science, nutrition, chronic condition diagnosed, and cardiometabolic condition diagnosed. Each row provides percentages and confidence intervals for each region. Notable trends include variations in age distribution, sex prevalence, health status, and chronic conditions across regions.
Values are weighted by population distribution and living area within the primary sampling unit (PSU) for the European region. Weighted percentages (%) are shown for the total population and for each variable of interest. P values are based on Pearson’s χ 2 tests for within-group total differences. An adjusted Wald test was performed for the within-group difference of age as a continuous variable.
1 3FQ, Fermented Food Frequency Questionnaire.
2 n: Study sample population.
3 Variables are presented as percentages assigned to each category, except for age, which is presented as median and quartiles 50 (25–75) according to each region’s distribution.
4 BMI calculated as weight (kg)/height2 (m2)).
By body weight status, the Western Europe sample had the highest prevalence of normal weight (65·8 %) and the lowest obesity rate (7·8 %), whereas participants from Northern Europe exhibited the highest obesity prevalence (18·2 %). Educational attainment was highest in Western Europe participants, with 54·6 % holding postgraduate qualifications, followed by Southern Europe (39·9 %), compared with 30·3 % in Central-Eastern Europe.
Consumer prevalence of fermented foods by European region
Before answering questions on frequency and intake, respondents first specified for each fermented food category whether they consumed fermented foods from the specific product categories. Significant regional differences in the prevalence of fermented food consumption were observed across fourteen of fifteen categories (p < 0·001 for all; Table S3, Figure 1). Fermented dairy products were the most widely consumed fermented foods across all regions (prevalence of 94·1 % to 95·6 %) and were the only category without significant regional variation, although a potential trend was observed (p = 0·059). Other highly consumed categories included fermented cereal products (89·9 % to 95·9 %) and coffee (78·4 % to 84·1 %). Heatmap visualisation (Figure 1) revealed three distinct consumption tiers: (i) High prevalence of consumption (≥75 %), which included fermented dairy products, chocolate, fermented cereals, fermented vegetables and coffee, which were consistently consumed across regions; (ii) moderate prevalence of consumption (50–75 %) including fermented meat/fish products, vinegar, wine, fermented pulses/legumes and beer or cider that demonstrated intermediate consumption with notable regional variation and (iii) low prevalence of consumption (<50 %) comprising of fermented non-alcoholic beverages, plant-based meat/dairy alternatives, cocoa beverages and fermented tea that exhibited the lowest prevalence, with pronounced variation. For instance, the prevalence of plant-based alternative consumers was substantially higher in Western Europe (72·8 %) than in other regions (<52 %), whereas the prevalence of fermented non-alcoholic beverage consumers was the lowest in Southern Europe (18·3 %). Details of population-derived 95 % CI are provided in Supplementary Materials Table S3. The lowest consumption prevalence was observed for fermented tea (33·8 % in Northern Europe to 44·3 % in Central-Eastern Europe). In comparison, the most significant regional disparities were observed for plant-based meat/dairy alternatives (44·4 % in Central-Eastern Europe v. 72·8 % in Western Europe) (Figure 1). Western Europe reported high consumption prevalence across most categories, except for strong spirits, cocoa beverages (moderate), fermented non-alcoholic beverages, plant-based alternatives and fermented teas (low prevalence). Fermented pulses and legumes were highly consumed only in Western Europe (80·5 %) but moderately in other regions (59·4 %–67·6 %). Similar patterns were observed for vinegar, wine, beer/cider and plant-based alternatives. Fermented meat/fish products showed a moderate reported consumption prevalence in Southern Europe (62·5 %), but were higher in the other regions, ranging from 75·5 % in Western Europe to 83·2 % in Central and Eastern Europe.
Heatmap of fermented food consumption in the study population by European region. Values are weighted by population distribution and living area within the primary sampling unit (PSU) for the European region. Weighted percentages (%) are depicted for the total population and percentages by variable of interest.

Regional patterns of consumer prevalence and intake among consumers
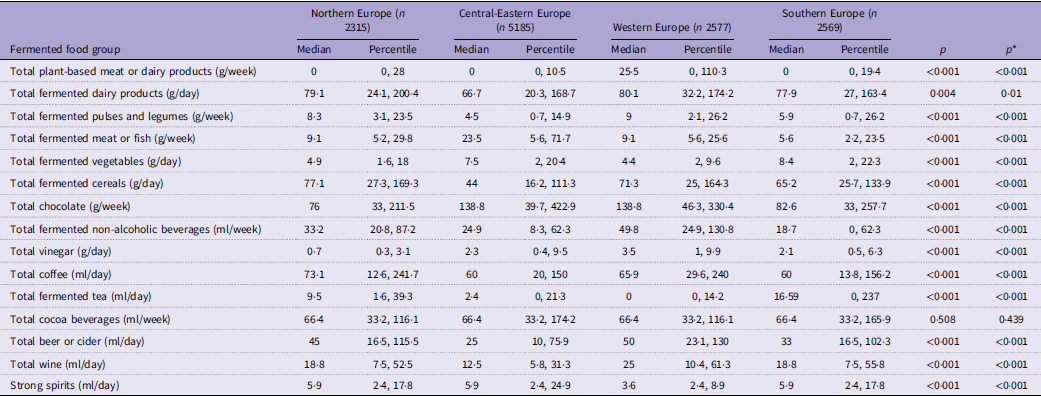
Intake among consumers varied substantially across regions and food groups (Table 2, Figure 2). Detailed subcategory data are presented in Supplementary Table S4. Three main intake tiers were identified: (i) Low (0 to 50 g/day); (ii) moderate (51 to 100 g/day) and (iii) high (>101 g/day). No fermented food category exceeded 101 g/day among consumers. Moderate daily intake was observed for fermented dairy and coffee across all regions and for cereals only in Northern, Southern and Western Europe. Specifically, fermented dairy products had the highest median intake among consumers (ranging from 66·7 g/day in Central-Eastern Europe to 80·1 g/day in Western Europe; p < 0·001). For subcategories, fermented yoghurt and milk ranged from 44 to 55·7 g/day, while cheese ranged from 5 to 20 g/day (Supplementary Table S4). Coffee intake among consumers ranged from 60·0 ml/day in Southern and Central-Eastern Europe to 73·1 ml/day in Northern Europe (p < 0·001). Fermented cereals ranged from 44·0 g/day in Central-Eastern Europe to 77·1 g/day in Northern Europe (p < 0·001). Among alcoholic beverages, wine intake was highest in Western Europe (25·0 ml/day) compared with 12·5 ml/day in Central and Eastern Europe (p < 0·001). Beer/cider ranged from 25·0 ml/day in Central-Eastern Europe to 45 and 50·0 ml/day in Northern and Western Europe, respectively (p < 0·001). Fermented vegetables showed one of the lowest daily intakes among consumers, ranging from 4·4 g/day in Western Europe to 8·4 g/day in Southern Europe (Table 2).
Intake among consumers of fermented foods by European region, as depicted by the 3FQ 1

Table 2. Long description
The table presents data on the intake of various fermented foods among consumers in different European regions. It includes Northern Europe, Central-Eastern Europe, Western Europe, and Southern Europe. The table has 17 rows and 10 columns. Column headers are: Fermented food group, Northern Europe (n 2315) Median, Northern Europe Percentile, Central-Eastern Europe (n 5185) Median, Central-Eastern Europe Percentile, Western Europe (n 2577) Median, Western Europe Percentile, Southern Europe (n 2569) Median, Southern Europe Percentile, p, p*. Row labels include different fermented food groups such as Total plant-based meat or dairy products, Total fermented dairy products, Total fermented pulses and legumes, Total fermented meat or fish, Total fermented vegetables, Total fermented cereals, Total chocolate, Total fermented non-alcoholic beverages, Total vinegar, Total coffee, Total fermented tea, Total cocoa beverages, Total beer or cider, Total wine, Strong spirits. Each row provides median and percentile values for each region, along with p-values indicating statistical significance.
Values are weighted by population distribution within each European region. Data are presented as median (25th, 75th percentile). P values are based on the Kruskal–Wallis test for between-region differences. P value* indicates sensitivity analysis excluding participants with a scientific background in nutrition.
A median of 0 indicates that most consumers reported consumption as ‘rarely’, which corresponds to a negligible daily intake after conversion of frequency midpoints and rounding.
1 3FQ, Fermented Food Frequency Questionnaire. Detailed subcategory data are presented in Supplementary Table S4.
Prevalence and intake of fermented foods among consumers across European regions. Left panel: Consumer prevalence (%) with vertical reference lines indicating low (<50 %), moderate (50–75 %) and high (≥75 %) prevalence tiers. Right panel: Median intake among consumers (g or ml/day) displayed on logarithmic scale. Weekly consumption values were converted to daily equivalents. Data points represent regional medians; regions with zero median intake are plotted at 0·1 for visualisation.

Figure 2. Long description
Panel A: A scatter plot showing consumer prevalence of fermented foods by European region. The horizontal axis represents consumer prevalence in percent, ranging from 0 to 100 percent. The vertical axis lists different types of fermented foods. Data points are color-coded by region: Northern Europe, Central-Eastern Europe, Western Europe, and Southern Europe. Panel B: A scatter plot showing the intake among consumers of fermented foods by European region. The horizontal axis represents intake in grams or milliliters per day on a logarithmic scale. The vertical axis lists different types of fermented foods. Data points are color-coded by region: Northern Europe, Central-Eastern Europe, Western Europe, and Southern Europe.
Among foods typically consumed on a weekly basis, chocolate showed the highest intake among consumers, with Western and Central-Eastern Europe reaching 138·8 g/week v. 76·0 g/week in Northern Europe (p < 0·001). Cocoa beverage consumption was consistent across regions (∼66·4 ml/week; p = 0·508). Plant-based alternatives had low weekly intake among consumers despite high consumer prevalence in Western Europe, with only Western Europe showing measurable intake (25·5 g/week; others = 0; p < 0·001). Fermented non-alcoholic beverages varied widely among consumers (18·7 ml/week in Southern Europe to 49·8 ml/week in Western Europe; p < 0·001). Fermented meat/fish and vegetables also had low intakes among consumers: meat/fish ranged from 5·6 g/week in Southern Europe to 23·5 g/week in Central-Eastern Europe. Pulse/legume intake among consumers was minimal (4·5–9·0 g/week), and fermented tea intake ranged from 0 ml/day in Western Europe to 16·6 ml/day in Southern Europe (p < 0·001). Detailed subcategory breakdowns are available in Supplementary Table S4. Sensitivity analyses confirmed that regional differences persisted for most categories (e.g., cereals, vegetables, coffee, wine, beer/cider and chocolate), with most p values remaining significant (<0·001). Some categories showed attenuated significance, such as fermented meat and fish and some teas and beer, although differences remained.
Relationship between consumption prevalence and intake amounts
Consumer prevalence and intake showed expected but noteworthy variation across food categories. Fermented dairy products showed near-universal consumer prevalence (94–96 %) and moderate intake (66–80 g/day). Plant-based alternatives were prevalent among consumers in Western Europe (72·8 %) but were consumed in low quantities (median 25·5 ml/week). Conversely, fermented non-alcoholic beverages had low consumer prevalence (18–49 %) but higher per-capita consumption (19–50 ml/week).
Supplementary Figure S1 directly compares consumer prevalence and intake among consumers (normalised) across fermented food categories, illustrating their independent variation. Several food groups demonstrated high consumer prevalence but low relative intake, most notably plant-based alternatives (consumer prevalence up to 72·8 % in Western Europe; median intake 0–3·6 g/day) and fermented vegetables (consumer prevalence 89·5–92·0 %; median intake 4·4–8·4 g/day). Conversely, fermented tea showed low consumer prevalence (33·8–44·3 %) but relatively higher intake among consumers in Southern Europe (16·6 ml/day). These patterns confirm that consumer prevalence and intake provide complementary rather than redundant information for characterising population exposure to fermented foods.
Discussion
The study aimed to provide a comprehensive, Europe-wide mapping of fermented food consumption patterns across regions, an essential step towards understanding the emerging evidence for the health-beneficial roles of these foods. A systematic examination of fifteen distinct fermented food categories across four European regions was consequently conducted, with a weighted sample of 12 646 participants, to map both the self-reported prevalence of fermented food consumption and estimated intakes using validated survey methodology with population-representative sampling and the validated 3FQ tool(Reference Magriplis, Smiliotopoulos and Myrintzou30,Reference Magriplis, Kotopoulou and Adamberg31) . The findings showed significant regional heterogeneity in fermented food consumption, highlighting the importance of region-specific nutritional interventions. A key methodological observation from this study concerns the independent variation in consumer prevalence and intake. Near-universal consumer prevalence of fermented dairy, combined with moderate intake, suggests habitual consumption in small, regular portions, consistent with dairy’s integration into daily European meals. The contrasting pattern for plant-based alternatives, high consumer prevalence but minimal intake among consumers in Western Europe, likely reflects occasional or trial-based consumption rather than dietary integration, possibly due to documented sensory barriers(Reference Hoek, Luning and Weijzen36,Reference Michel, Hartmann and Siegrist37) and the relatively nascent market position of these products, with pan-European data showing high awareness but modest purchase frequency(38). The inverse pattern observed for fermented non-alcoholic beverages (low consumer prevalence, higher intake among consumers) suggests niche but committed consumption(Reference Baschali, Tsakalidou and Kyriacou18). These patterns indicate that consumer prevalence alone is insufficient to characterise population exposure to fermented foods; both metrics are essential for nutritional epidemiology applications and should be reported separately in future studies examining fermented food–health associations.
These findings align with recent evidence that consumer perception and preference for fermented foods are driven by intrinsic product characteristics, alongside biological, psychological, situational and sociocultural factors, highlighting the value of a multidisciplinary approach to understanding consumption(Reference García-Barón, Carmona-Escutia and Herrera-López39).
Substantial regional variations were observed across most fermented foods, other than fermented dairy, confirming the distinctive nature of European fermented food traditions, which have been reported sporadically to date(Reference Gänzle40,Reference Sõukand, Pieroni and Biró41) . Distinct consumption patterns were identified across European regions, warranting further studies on fermented-food practices and bacterial communities(Reference Van Reckem, Geeraerts and Charmpi19,Reference Comasio, Verce and Van Kerrebroeck42) . However, the regular and universal consumption of fermented dairy products (94 to 96 % prevalence) at moderate levels (66 to 80 g/day) makes fermented dairy the primary contributor to fermented food intake across Europe, suggesting that fermented dairy products are a highly diverse and culturally accepted food group. These findings warrant further research into optimal intakes of dairy-based probiotic-fermented functional foods, given their observed health-promoting properties associated with gut microbiome diversity(Reference Kaur, Kaur and Ali2). In this context, label information, particularly sugar or sweetener type, protein source and lactose-related claims, could play a key role in shaping consumer acceptance of fermented dairy products, depending on lifestyle and consumption habits(Reference Borges, Gutarra and Melo43).
Although few studies have reported on fermented food intake patterns, the presented findings align with previous national and cohort-based evidence, which suggests that a limited set of fermented foods dominates European diets, particularly coffee, bread, yoghurts/cheeses, beer and wine, with wide variation in less common categories (e.g., kombucha, water kefir and kvass) across countries. In the Dutch NQplus cohort, approximately 16–18 % of consumed foods were classified as fermented, with an additional 9–14 % consisting of dishes containing a fermented ingredient(Reference Li, Brouwer-Brolsma and Burton22). Specifically, the high contributors to fermented food intake included coffee (∼453 ml/day), yoghurts (∼88 g/day), beer (∼84 ml/day), whole grain bread (∼81 g/day), wine (∼65 g/day) and cheese (∼32 g/day), comparable with the findings of the current study. Similar fermented food consumption patterns were reported in Switzerland, with coffee at 251·9 g/day, bread products at 114·1 g/day, beer and cider at 103·3 g/day, yoghurt and fresh cheese at 71·9 g/day and cheese consumption (including hard and soft cheeses) at around 43·9 g/day(Reference Pertziger, von Ah and Bochud23). In a non-European context, a previous study in Japan reported that fermented foods contributed 438 g per person per day, accounting for approximately 17 % of total food weight. The main sources were beer, coffee, bread and yoghurt, confirming the importance of our findings in a global context(Reference Fujihashi and Sasaki28).
In this study, we found that consumption of alcoholic beverages was higher in Western Countries. While these patterns partly reflect long-standing cultural and traditional drinking habits, they may also be influenced by economic factors, as highlighted by a recent study showing that the affordability of alcoholic beverages is higher in countries such as Germany, Austria, France and Luxembourg compared with other EU Member States(Reference Kilian, Manthey and Neufeld44).
One of the key findings of our study was that high self-reported consumption of fermented foods does not necessarily translate into actual consumption. Approximately 70 % of respondents in Western Europe reported consuming plant-based alternatives, whereas this proportion ranged from 40 % to 50 % in the other European regions. This difference may partially reflect the increasing trend towards vegan and vegetarian diets observed in Western European countries(Reference Saari, Herstatt and Tiwari45). Moreover, the higher prevalence observed in Western Europe may also be influenced by the socio-demographic profile of respondents, as this region included a significantly greater proportion of participants with postgraduate education (MSc/PhD) and a scientific background in food science and nutrition, as indicated by the questionnaire, which may be associated with higher awareness and acceptance of plant-based alternatives. However, actual intake of plant-based fermented products was low in Western Europe (about 25 g/day) and negligible elsewhere, highlighting a discrepancy between reported consumption frequency and actual intake, suggesting that only small amounts are typically consumed. Sensory limitations, particularly off-flavours in vegetable-based beverages, likely restrict regular consumption despite increased availability and growing awareness of the health benefits of fermented foods(Reference Ueda, Fernández-Ruiz and Morales46). However, a recent study reported that consumers may accept fermented mixed animal–plant products, with sensory quality as the main driver of acceptance and nutritional information having a greater impact than environmental claims, supporting the potential role of innovative foods in more sustainable diets(Reference Saint-Eve, Irlinger and Pénicaud47). This finding relates to the documented limitations of traditional FFQ in capturing the full diversity of fermented products(Reference Caffrey, Perelman and Ward25). Additionally, it supports calls for more detailed characterisation to classify fermented foods across major food groups, as highlighted in large-scale European studies such as EPIC InterAct(Reference Sluijs, Forouhi and Beulens26).
Regarding other fermented foods, the low intake of traditional fermented vegetables and legumes/pulses warrants closer examination. Consumption was low, despite the potential health benefits of fermented vegetables and legumes as dietary sources of live microorganisms and their role in gut microbiome diversity(Reference Rezac, Kok and Heermann10,Reference Park and Mannaa48) , highlighting a substantial gap between expected benefits and actual intake. A similar low intake of fermented vegetables (0·8 g/day) was also reported among Swiss adults(Reference Pertziger, von Ah and Bochud23). While home production of fermented vegetables appears to be increasing across Western countries, likely encouraged by mainstream publications and social media promoting DIY approaches(Reference Thierry, Madec and Chuat49), this interest has not translated into substantial consumption at the population level. The gap between expected benefits and real-world intake may reflect current market practices, in which vinegar-based pickled vegetables dominate European shelves due to their long shelf life, capacity for mass production and lack of refrigeration requirements until opened(Reference Behera, El Sheikha and Hammami50). By contrast, in several Asian settings, fermented vegetables remain dietary staples(Reference Tamang, Cotter and Endo1). Cultural factors and taste preferences, therefore, seem to play a significant role in limiting wider adoption in Western countries.
When interpreting consumption patterns, it is essential to consider the diversity of fermentation practices across Europe. Traditional methods often rely on spontaneous fermentation and local microbial communities, while industrial processes may use standardised starter cultures and post-fermentation treatments such as pasteurisation, which can reduce microbial viability. These practices influence not only the nutritional and functional properties of fermented foods but also consumer perception and intake behaviour. For example, many unfermented pickles, whether salt-stock preserved in concentrated brine or vinegar, that are typically pasteurised are often perceived as fermented, yet they lack the functional qualities of true fermented products like sour pickles, which develop lactic acid through natural fermentation and typically contain live microorganisms(Reference Behera, El Sheikha and Hammami50).
Similarly, plant-based yoghurt or cheese alternatives can be produced using acidifiers rather than through true microbial fermentation. These products are frequently perceived by consumers as fermented, despite lacking the microbial and functional characteristics of lactic acid fermentation(Reference Hanley, Dobson and Marangoni51–Reference Montemurro, Pontonio and Coda53).
Therefore, although the food categories considered in this study are generally regarded as fermented, differences in production technologies may contribute to consumer misunderstanding, potentially leading to a slight overestimation of fermented food consumption in our findings. Finally, it should be emphasised that cultural norms and values regulate the acceptance of fermented foods, including ethnic fermented products, by shaping perceptions of appropriateness, portion size, consumption context and sensory expectations, thereby contributing to cross-regional differences in consumer appreciation(Reference Greis, Nolden and Kinchla54,Reference Yamamoto, Ballester and Takayanagi55) .
In this study, we applied the definition of fermented foods proposed by the International Scientific Association for Probiotics and Prebiotics, which defines them as ‘foods made through desired microbial growth and enzymatic conversions of food components’(Reference Marco, Sanders and Gänzle56). This definition provides a clear framework for distinguishing fermented foods from those acidified or preserved by non-fermentative methods. Importantly, International Scientific Association for Probiotics and Prebiotics emphasises that not all fermented foods contain live microorganisms at the time of consumption, particularly when post-fermentation methods such as pasteurisation are used. There are some small-to-midsize randomised clinical trials with postbiotics (i.e. microbial products or metabolic by-products, such as peptides, organic acids, polysaccharides and cell wall fragments) and paraprobiotics (i.e. inactivated probiotics) that show promising health benefits to the host, such as mood(Reference Mutoh, Kakiuchi and Kato57), immune modulation and gut health(Reference Salminen, Collado and Endo58). However, most trials are small, strain- or product-specific, and thus, more large, independent randomised controlled trials are needed. This distinction may have significant implications for dietary assessment, public health messaging and the interpretation of the functional benefits of fermented food, although more research is required.
Moreover, the level of processing, including additives and/or heat treatment, can affect whether a food is classified as truly fermented, especially in the context of health-promoting live microbes(Reference Rezac, Kok and Heermann10). Indeed, the concept of characterising live microbes in foods in an epidemiological context was recently developed by Marco et al., who classified fermented and unfermented foods in the NHANES dataset based on their estimated microbial content, as low, medium and high(Reference Marco, Hutkins and Hill59). This study supported the classification of foods in the Swiss menuCH study, which applied detailed food characterisation, identifying 186 microorganisms across six taxonomic levels in the fermented foods consumed(Reference Pertziger, von Ah and Bochud23). This approach established a comprehensive cartography of microbial species ingested with fermented foods and explicitly addressed viability, using a classification of live microorganism levels. Future studies should aim to characterise fermentation and processing methods alongside intake data to better understand dose–response relationships and the functional potential of fermented foods.
These results provide essential baseline data to understand the contribution of fermented foods to European diets and offer critical insights for public health nutrition policy, particularly given the growing interest in their potential health benefits and their role in sustainable food systems. Regional differences in self-reported chronic conditions and cardiometabolic diagnoses were also observed in this study, reflecting variation in participants’ health profiles across European regions. These differences should be taken into account in future studies examining associations between fermented food intake and health outcomes, both within and between regions. However, the present study was descriptive and cross-sectional and was not designed to assess these associations. Beyond the strengths of this study, several limitations warrant consideration. First, the cross-sectional design precludes causal inference about temporality or causality. Health status may influence food choices, and reverse causation cannot be excluded. Fermented food intake, health status and anthropometric measures were self-reported and are therefore subject to recall error, misclassification and systematic reporting bias. Although the large sample size improves the precision of descriptive estimates, it does not eliminate these sources of bias. Furthermore, as in most large European dietary surveys (including EPIC), convenience sampling with broad regional targets was used, aiming to achieve a specific number of participants by European region and sex or age group in each case, as specified by the STEPS design. Post-stratification analyses were applied using weights appropriate to each analysis dimension, yielding eight strata in each case. This widely used approach reduces potential bias in sample-based estimates and corrects imbalances that can arise when the sample design differs from the target population in response rates across subgroups(Reference Henry and Valliant35).
Finally, while the developed 3FQ tool distinguishes subcategories and portion sizes, it cannot differentiate among specific products per country, nor capture variations in brand, processing level, or post-fermentation treatments (e.g. pasteurisation). Additionally, in fermented products containing live microorganisms, viable microbial counts at the point of consumption were not evaluated, a parameter likely to modulate biological effects and vary across markets.
Conclusions
Overall, the results provide estimates of fermented food consumption across Europe by systematically examining fifteen distinct categories of fermented food intake across European regions, using a standardised methodology and provide the baseline data necessary for robust nutritional epidemiology research. This approach moves beyond simple prevalence measures by capturing actual intake levels and specific subtypes of fermented foods. This could enable investigations into health associations and provide a foundation for evidence-based dietary guidelines, as emphasised by the PIMENTO initiative.
Looking ahead, integrating the 3FQ with multi-omics approaches, gut microbiome profiling and detailed product characterisation, including viable microbial counts (probiotic effects) and metabolite profiles, may enable future studies to progress from descriptive exposure assessments to understanding dose–response relationships. The present study, however, was designed as a descriptive mapping of habitual fermented food consumption using the 3FQ, rather than an analysis of total diet or diet–health associations. Future work may use recall-based complete diet data to examine fermented food consumption in the context of overall dietary intake and to conduct calibration or sensitivity analyses.
From a policy perspective, although no specific recommendations currently exist, several countries are considering dietary guidance that includes fermented foods. Our results suggest that population-level intake is modest across most categories, with significant regional variation, indicating that region-specific guidance and food-environment strategies may be more feasible than a pan-European recommendation. Clarifying nomenclature and labelling, for example, indicating whether a fermented product contains live microbes at the time of consumption, could enhance consumer transparency and research reproducibility, in line with ISAPP recommendations.
Supplementary material
To view supplementary material for this article, please visit https://doi.org/10.1017/S0007114526108563
Data availability statement
The original contributions presented in this study are included in the article/supplementary material. Further inquiries can be directed to the corresponding author(s).
Acknowledgements
The authors sincerely thank all members who helped with the translation, dissemination and data collection for the questionnaire: J. Rajić, A. Kostić, D. Milinčić, S. Stanojević (SRB), Tagli Pitsi (EST), E. Hillesheim, J. J. Kristin Lüthi (CH), L. Hoxha (ALB), M. Beglaryan (ARM), M. Gandia (ESP), Taner Sar (SWE), M. Deschasaux (FRA), L. Ove Dragsted (DNK), L. Ozola (LV), M. Wronkowska (POL), A. Kušar, E. Hafner (SVN). The authors also thank the administrative team of PIMENTO for their support, particularly Nadège Picard and Elena Gerbaud (INRAE). This article is based upon work from COST Action PIMENTO CA20128, supported by COST (European Cooperation in Science and Technology). M. Laranjo acknowledges the R&D unit MED – Mediterranean Institute for Agriculture, Environment and Development (https://doi.org/10.54499/UID/05183/2025) and the Associate Laboratory CHANGE – Global Change and Sustainability Institute (https://doi.org/10.54499/LA/P/0121/2020).
Conceptualisation, MS. and E.M.; methodology, E.M; formal analysis, T.S, E.M., M.S.; investigation, all authors.; data curation, T.S, E.M, C.P, N.M, M.S.; writing – original draft preparation, M.S and E.M.; writing – review and editing, all authors; visualisation, M.S and E.M.; supervision, M.S and E.M.; project administration, M.S and E.M; funding acquisition, C.C. All authors have read and agreed to the published version of the manuscript.
This article is based upon work from COST Action PIMENTO CA20128, supported by COST (European Cooperation in Science and Technology; www.cost.eu). COST CA20128 had no role in the design, analysis or writing of this article. Other sources also supported data collection: Igor Pravst acknowledges the Slovenian Research and Innovation Agency (ARIS P3–0395). Zuzana Ciesarova acknowledges the Slovak Research and Development Agency (APVV 23–0169).
The authors declare that they have no known competing financial interests that could have appeared to influence the work reported in this paper. The funding source did not play any role in study design, data collection, analysis, interpretation, report writing, or the decision to submit the article for publication.
The study was conducted in accordance with the Declaration of Helsinki and was approved by the Ethics Committee of the Agricultural University of Athens. Protocol number: 27/05.05.2023. Date of approval: 10/05/2023. Informed consent was obtained from all subjects involved in the study.




 Open access

